1652
In vivo imaging of cerebral glutamate changes using chemical exchange saturation transfer MRI in a rat forced swimming test model of depression1Department of Radiology, Asan Medical Center, University of Ulsan College of Medicine, Seoul, Korea, Republic of, 2Department of Convergence Medicine, Asan Medical Center, University of Ulsan College of Medicine, Seoul, Korea, Republic of, 3Convergence Medicine Research Center, Asan Institute for Life Sciences, Asan Medical Center, Seoul, Korea, Republic of, 4Department of Radiological Science, College of Health Sciences, Yonsei University, Wonju, Korea, Republic of
Synopsis
Glutamate-weighted chemical exchange saturation transfer (GluCEST) imaging is a novel enhancement technique for the non-invasive detection and quantification of cerebral glutamate levels in neuro-molecular processes. The present study quantitatively evaluated glutamate signal changes in the hippocampal region of a rat forced swimming test model (FS) of depression. The GluCEST and proton magnetic resonance spectroscopy results showed that GluCEST values and glutamate concentrations were significantly lower in the FS rats than in the controls. These findings might provide a key marker to better understand the cerebral neurochemical responses in depressive disorders.
INTRODUCTION
Depression is a complex psychiatric disorder characterized by persistent and pervasive low mood accompanied by anhedonia, disturbances of sleep and/or appetite, and feelings of sadness.1,2 To date, numerous proton magnetic resonance spectroscopy (1H-MRS) studies have evaluated changes in glutamatergic metabolites in the hippocampal region of depressive disorders.3,4 However, various findings have been observed across studies in patients and animals, including elevation,5 no difference,6,7 and reduction8,9 of glutamate levels. Thus, detecting and evaluating alterations in glutamate levels is important, as it has the potential to be used as an essential key-marker for quantifying cerebral metabolism in depressive disorders. Glutamate-weighted chemical exchange saturation transfer (GluCEST) imaging is a powerful sensitivity enhancement technique that provides indirect detection of glutamate in vivo, with exchangeable protons and exchange-related properties.10,11 This study aimed to visualize and quantitatively evaluate hippocampal glutamate changes in a rat model of depression using in vivo 1H-MRS and GluCEST.METHODS
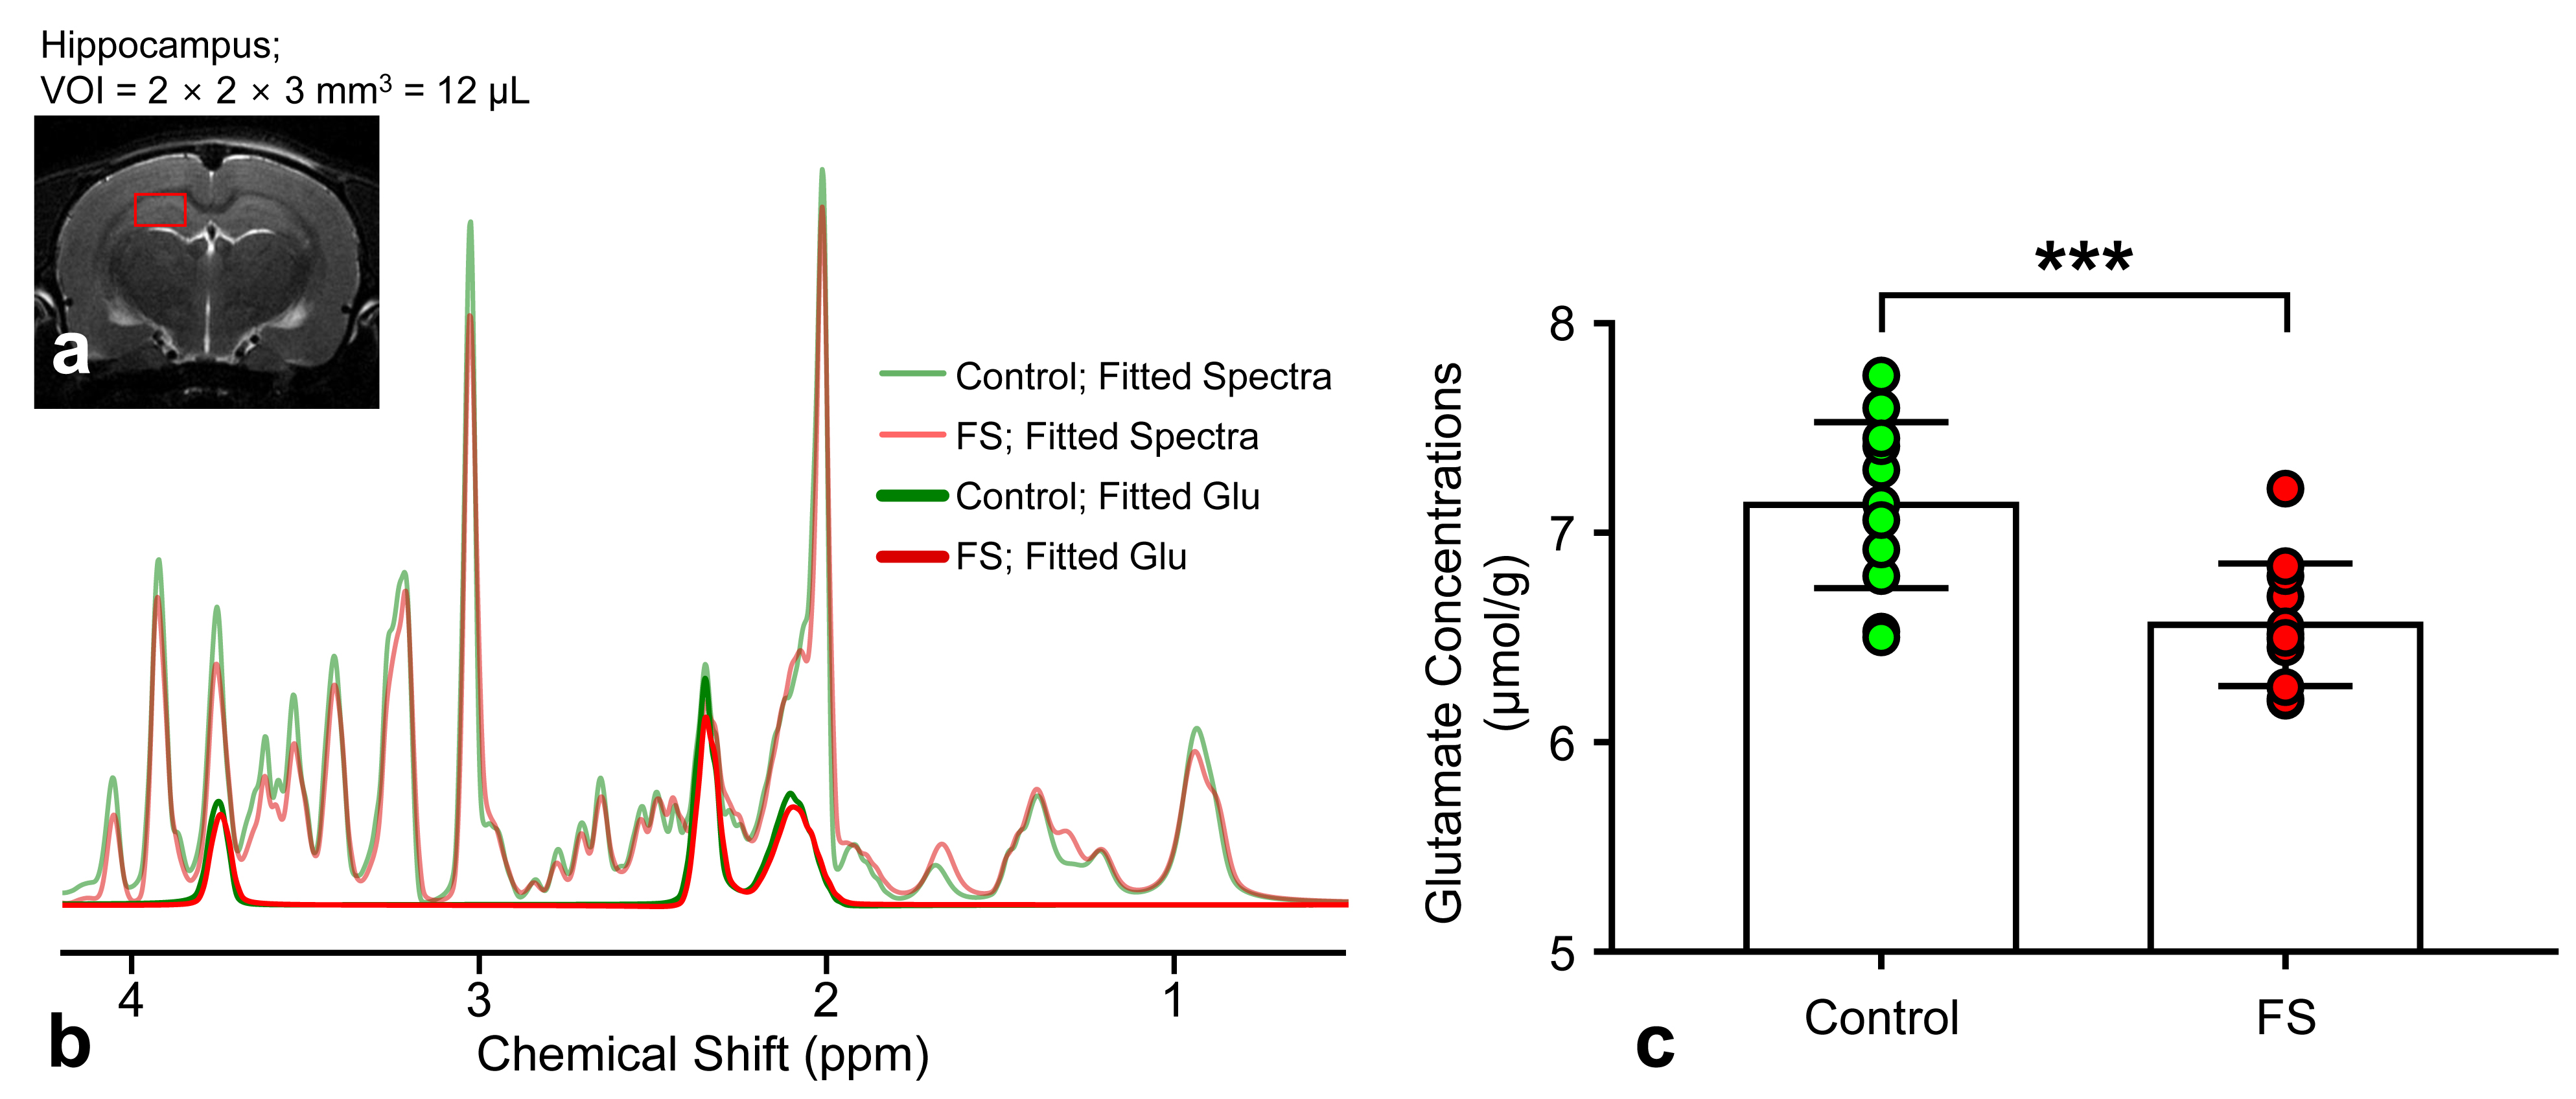
Animals: Twenty-four rats were randomized into two groups (forced swimming test [FS], n = 12; and control, n = 12). Rats were individually forced to swim in an open Plexiglas cylinder (height: 60-cm; diameter: 25-cm) filled with water (23-25°C) up to 40-cm deep.12 All FS rats were individually subjected to two swimming sessions: an initial pre-swimming trial (15-min), followed 24-h later by a 10-min test.MRI Experiment: GluCEST, 1H-MRS, and multi-parametric MR images were sequentially obtained using a 7-T scanner. GluCEST imaging was carried out in a selected single slice in which the hippocampus was well observed using the following parameters: fat-suppressed turbo-RARE sequence, slice thickness = 1.5-mm, FOV = 30×30-mm2, TR/TE = 4200/36.4-ms, RARE-factor = 16, echo spacing = 6.1-ms, and continuous-wave RF saturation pulse (power/length) = 3.6-μT/1000-ms. Z-spectra were acquired at 25-frequency offsets from 6 to -6ppm with a step size of 0.5ppm, and the reference image (S0).10,13 To correct for B0- and B1-inhomogeneity, water saturation shift referencing Z-spectra (33-frequency offset; ±0.8ppm; 0.05ppm step size; 0.05-µT RF saturation power),14 and B1-field map (flip-angle 30° and 60°)10 were obtained. Multi-parametric MRI was carried out as follows: T1-relaxation maps (RAREVTR sequence with six TRs [600, 900, 1500, 2500, 4000, and 7000-ms] and 12.2 ms-TE), T2-relaxation maps (MSME sequence with 15 TEs [10–150-ms with 10-ms increments] and 3000-ms TR), ADC maps (single-shot spin-echo EPI sequence with 7 b-values [0, 166.7, 333.3, 500, 666.7, 833.3, and 1000-s/mm2], TR/TE = 3000/18.7-ms, and three averages), and CBF maps (FAIR sequence with variable TI [35, 100–1400-ms at 100-ms increments, and 1600-ms], and 36.36-ms TE). In vivo 1H-MRS data were acquired from a single voxel (12-μL) positioned in the hippocampus using a spin-echo based PRESS sequence (TR/TE = 5000/16.3-ms, spectral width = 5000-Hz, data points = 2048, and 256 averages).15
Data Analysis: The equation for calculating the GluCEST map was as follows: GluCEST(%)=100×(M[−3ppm]–M[+3ppm])/M[−3ppm] where, M[±3ppm] are B0- and B1-corrected signals at ±3ppm from water resonance, respectively.10,13 A ROI was drawn in the hippocampal region for the computation of GluCEST values. The LCModel was used to quantify MRS data. Metabolite concentrations were determined using the unsuppressed water spectrum as an internal reference. An estimate of the fitting reliability was provided by the LCModel and was accepted as less than 20%SD.
Statistical Analysis: The quantified metabolite concentrations in all spectra were normally distributed (Kolmogorov-Smirnov test of normality, all p >0.2), and independent t-tests were used. Statistical differences were assumed to be significant for p-values below 0.05.
RESULTS AND DISCUSSION
Figure 1 shows the magnetization transfer ratio asymmetry (MTRasym) curves (Fig.1a) and quantified GluCEST-weighted values (Fig.1b) in the hippocampus of the FS and control rats. The average GluCEST value between the left and right hippocampus in the FS group was significantly lower (3.67±0.81%) than that in the control group (5.02±0.44%; p < 0.001). Figure 2 shows the voxel placement in the hippocampal region of rats (Fig.2a) and presents the spectral fitting results of 1H-MRS data in a representative rat from each group (Fig.2b). The quantified glutamate concentrations in the hippocampal region were significantly lower in the FS rats than in the controls (Fig.2c) (6.560±0.292μmol/g vs. 7.133±0.397μmol/g, respectively; p = 0.001). Previous studies have suggested that the significantly lower glutamate levels in the hippocampus might reflect an alteration in the glial physiology caused by stress-induced depressive disorder.4,16 Figure 3 indicates the calculated multi-parametric MR values (ADC, CBF, T2, and T1) in the FS and control groups in the hippocampal region (Fig.3a-d). There were no significant differences between the two groups (all p ≥ 0.109). These results might reflect that multi-parametric values do not affect the formation of the GluCEST signals in the present study.17 Figure 4 shows reconstructed maps of the quantified multi-parametric MR and GluCEST values overlaid on the corresponding S0 images from a representative rat in the FS and control groups (Fig.4a,b). There was no apparent difference in the multi-parametric MR images in visual inspections, as shown in Fig.3, but remarkable contrasts were observed in the GluCEST maps of the hippocampal region.CONCLUSION
Our findings suggest that GluCEST may provide a unique method to detect and monitor glutamate levels in a rat model of depression. Furthermore, using GluCEST and 1H-MRS techniques may yield greater insight into the neurochemical role of glutamate in various psychiatric disorders.Acknowledgements
This work was supported by the National Research Foundation of Korea (NRF) grant funded by the Korean Government (Ministry of Science and ICT, MSIT; NRF-2018R1C1B6004521 and NRF-2020R1A2C1103133).References
1. Zhou X, Liu L, Zhang Y, et al. Metabolomics identifies perturbations in amino acid metabolism in the prefrontal cortex of the learned helplessness rat model of depression. Neuroscience. 2017;343:1–9.
2. Liu L, Zhou X, Zhang Y, et al. The identification of metabolic disturbances in the prefrontal cortex of the chronic restraint stress rat model of depression. Behav Brain Res. 2016;305:148–156.
3. Moriguchi S, Takamiya A, Noda Y, et al. Glutamatergic neurometabolite levels in major depressive disorder: a systematic review and meta-analysis of proton magnetic resonance spectroscopy studies. Mol. Psychiatry. 2019;24:952–964.
4. Kumar BSH, Mishra SK, Rana P, et al., Neurodegenerative evidences during early onset of depression in CMS rats as detected by proton magnetic resonance spectroscopy at 7 T. Behav Brain Res. 2012;232:53–59.
5. McGirr A, Berlim MT, Bond DJ, et al. A systematic review and meta-analysis of randomized, double-blind, placebo-controlled trials of ketamine in the rapid treatment of major depressive episodes. Psychol Med. 2015;45:693–704.
6. Baeken C, Lefaucheur JP, Van Schuerbeek P. The impact of accelerated high frequency rTMS on brain neurochemicals in treatment-resistant depression: insights from (1)H MR spectroscopy. Clin Neurophysiol. 2017;128:1664–1672.
7. Gabbay V, Bradley KA, Mao X, et al. Anterior cingulate cortex gamma-aminobutyric acid deficits in youth with depression. Transl Psychiatry. 2017;7:e1216.
8. Pfleiderer B, Michael N, Erfurth A, et al. Effective electroconvulsive therapy reverses glutamate/glutamine deficit in the left anterior cingulum of unipolar depressed patients. Psychiatry Res. 2003;122:185–92.
9. Bhagwagar Z, Wylezinska M, Jezzard P, et al. Low GABA concentrations in occipital cortex and anterior cingulate cortex in medication-free, recovered depressed patients. Int J Neuropsychopharmacol. 2008;11:255–60.
10. Cai K, Haris M, Singh A, et al. Magnetic resonance imaging of glutamate. Nat Med. 2012;18(2):302–306.
11. Bagga P, Pickup S, Crescenzi R, et al. In vivo GluCEST MRI: Reproducibility, background contribution and source of glutamate changes in the MPTP model of Parkinson’s disease. Sci Rep. 2018;8:2883.
12. Porsolt RD, Le Pichon M, Jalfre M. Depression: a new animal model sensitive to antidepressant treatments. Nature 1977;266:730–732.
13. Lee DH, Woo CW, Kwon JI, et al. Cerebral mapping of glutamate using chemical exchange saturation transfer imaging in a rat model of stress-induced sleep disturbance at 7.0T. J Magn Reson Imaging. 2019;50(6);1866–1872.
14. Kim M, Gillen J, Landman BA, Zhou J, et al. Water saturation shift referencing (WASSR) for chemical exchange saturation transfer (CEST) experiments. Magn Reson Med. 2009;61(6):1441–1450.
15. Tkac I, Starcuk Z, Choi IY, et al. In vivo 1H NMR spectroscopy of rat brain at 1 ms echo time. Magn Reson Med. 1999;41:649–656.
16. Milne A, MacQueen GM, Yucel K, et al. Hippocampal metabolic abnormalities at first onset and with recurrent episodes of a major depressive disorder: A proton magnetic resonance spectroscopy study. Neuroimage. 2009;47(1):36–41.
17. Lee DH, Heo HY, Zhang K, et al. Quantitative assessment of the effects of water proton concentration and water T1 changes on amide proton transfer (APT) and nuclear overhauser enhancement (NOE) MRI: The origin of the APT imaging signal in brain tumor. Magn Reson Med. 2017;77(2):855–863.
Figures