1651
White matter connectome alterations in tuberous sclerosis complex patients with neuropsychiatric disorders revealed by DTI1Department of Medical Imaging and Radiological Sciences, and Bachelor Program in Artificial Intelligence, Chang Gung University, Taoyuan, Taiwan, 2School of Medicine, Chung Shan Medical University, Taichung, Taiwan, 3Department of Pediatrics, Chung Shan Medical University Hospital, Taichung, Taiwan, 4Institute of Medicine, Chung Shan Medical University, Taichung, Taiwan, 5Department of Medical Imaging, Chung Shan Medical University Hospital, Taichung, Taiwan, 6Medical Imaging Research Center, Institute for Radiological Research, Chang Gung University and Chang Gung Memorial Hospital at Linkou, Taoyuan, Taiwan, 7Department of Psychiatry, Chang Gung Memorial Hospital, Chiayi, Taiwan
Synopsis
Previous studies indicate that the occurrence of tuberous sclerosis will cause neurotransmission in brain blocked by tumors and produce abnormal discharges. In the study we used diffusion tensor imaging (DTI), graph theoretical analysis (GTA) and network-based statistical (NBS) analysis to explain brain structural network alterations in TSC patients with different intellectual disability, seizure, and Neurological Severity Score.
Introduction
Tuberous sclerosis complex (TSC) 1-3 is a rare genetic disease that causes benign tumors occur in the brain and other organs. Nodular tumor that occurs in the brain can cause emotional, behavioral and IQ effects on patients. The most common symptoms are developmental delays, autism, learning disabilities and mental retardation. The degree of white matter involvement is believed to be associated with the severity of neurological impairment. The goal of the study was to evaluate the brain structural network alterations in TSC patients using diffusion tensor imaging (DTI) 4-6, graph theoretical analysis (GTA) 7,8, and network- based statistical (NBS) 9 analysis.Methods
Forty-two TSC patients were scanned with 3T MRI (Verio, Siemens) to obtain brain diffusion MR images. The scanning protocol was performed with the following parameters: TR/TE= 4800 / 97 ms, number of excitations (NEX)= 1, field of view (FOV)= 250 × 250 mm2, Slice thickness= 4 mm, voxel size = 2 × 2 × 4 mm3, b-value = 1000 s/mm2, diffusion direction = 64, and 12 additional null images without diffusion weighting (b = 0 s/mm2). The scan time was approximately 6 min. After acquired the image, FMRIB Software Library (FSL) and statistcal parametric mapping (SPM) was used to correct the artifacts produced by eddy current and normalize all the images to anterior commissure. The diffusion images were then spatially normalized to the Montreal Neurological Institute T2 template. DTI reconstruction was performed using DSI Studio, and fractional anisotropy (FA) were calculated. The patients was then divided into multiple three groups, including TSC patients with intellectual disability (ID) vs. patients with normal intelligence, patients with intractable seizure vs. patients with none/controlled seizure, patients with higher NSS vs. patients with lower NSS. The GTA was performed on the inter-regional connectivity matrix, and NBS analysis was used to identify the significance of any connected subnetworks evident in the set of altered connections.Results
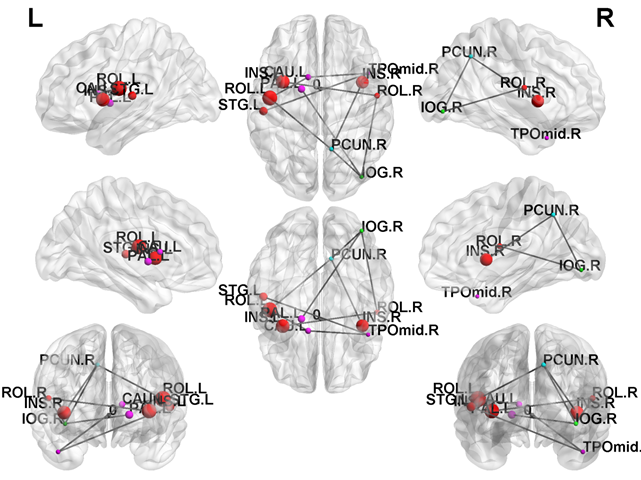
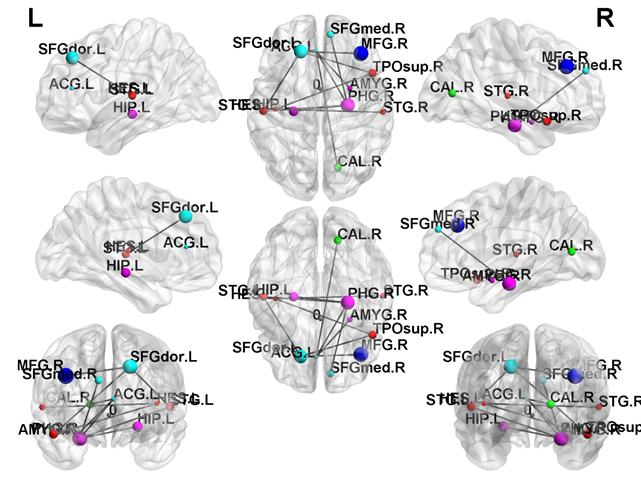
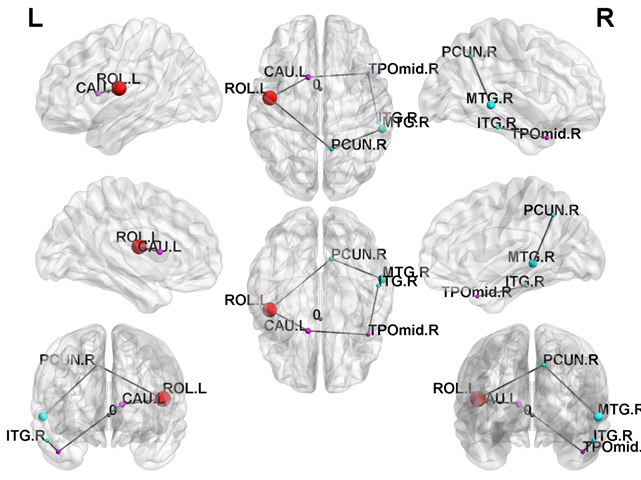
In NBS, there were several disruptions in the connectivity between the subgroups of TSC patients. NBS analysis revealed a disrupted subnetwork in TSC patients with ID compared with those who with normal intelligence (ID < intelligence; p < 0.05) (Fig. 1), including connections from the temporal lobe to the insula. NBS analysis was also used to compared the edges of the brain networks between TSC patients with intractable or none/controlled seizures (Fig. 2). One subnetwork exhibited more edges in the none /controlled when compared with intractable seizure (NR > AR; p < 0.05), including the connections from the frontal lobe to the parietal lobe. Figure 3 illustrates the disrupted subnetwork in TSC patients with higher NSS (6–8) compared with who with lower NSS (0–5) (higher NSS [6–8] < lower NSS [0–5]; p < 0.05), including connections from the temporal lobe to the caudate. The structures marked with different colors stand for the different modularity. The abbreviation of node stand for the brain region based on a standard parcellation template contained in the Automated Anatomical Labeling software package.Discussion
DTI has the potential to provide valuable information about cytoarchitectural changes in TSC lesions beyond morphological MRI findings alone. Using GTA and NBS, current results provide the information of disrupted white matter connectivity and organization in TSC patients with different neuropsychological impairments 10-12. TSC is a rare genetic disease, so limited shortage of data can be obtained. To prevent the influence caused from the shortage of data, we divided patients into different groups by symptoms to increase accuracy of results.Conclusion
The current results suggest that DTI has the potential to determine valuable information about cytoarchitectural changes in TSC lesions beyond morphological MRI findings, and provides information regarding disrupted white matter connectivity and organization in TSC patients with different neuropsychological impairments using GTA and NBS. Our current findings may help better understand the variable clinical phenotypes seen in TSC patients and the underlying physiological mechanisms.Acknowledgements
This study was supported by the research program, MOST107-2221-E-182-054-MY3, which was sponsored by the Ministry of Science and Technology, Taipei, Taiwan.References
1. Webb, D. W., & Osborne, J. P. (1992). New research in tuberous sclerosis. BMJ (Clinical research ed.), 304(6843), 1647–1648.
2. Henske, E. P., Jóźwiak, S., Kingswood, J. C., Sampson, J. R., & Thiele, E. A. (2016). Tuberous sclerosis complex. Nature reviews. Disease primers, 2, 16035.
3. Crino, P. B., Nathanson, K. L., & Henske, E. P. (2006). The tuberous sclerosis complex. The New England journal of medicine, 355(13), 1345–1356.
4. Assaf, Y., & Pasternak, O. (2008). Diffusion tensor imaging (DTI)-based whitematter mapping in brain research: a review. Journal of molecular neuroscience :MN, 34(1), 51–61.
5. Basser, P. J., Mattiello, J., & LeBihan, D. (1994). MR diffusion tensorspectroscopy and imaging. Biophysical journal, 66(1), 259–267.
6. Hatton, S. N., Panizzon, M. S., Vuoksimaa, E., Hagler, D. J.,Fennema-Notestine,C., Rinker, D., Eyler, L. T., Franz, C. E., Lyons, M. J., Neale, M. C., Tsuang, M. T., Dale, A. M., & Kremen, W. S. (2018). Genetic relatedness of axial and radial diffusivity indices of cerebral white matter microstructure in late middle age. Human brain mapping, 39(5), 2235–2245.
7. Stam CJ, Reijneveld JC. Graph theoretical analysis of complex networks in thebrain. Nonlinear Biomed Phys. 2007 Jul 5;1(1):3. doi: 10.1186/1753-4631-1-3.
8. Hosseini SMH, Hoeft F, Kesler SR (2012) GAT: A Graph-Theoretical AnalysisToolbox for Analyzing Between-Group Differences in Large-Scale Structuraland Functional Brain Networks. PLOS ONE 7(7): e40709.
9. Zalesky, A., Fornito, A., & Bullmore, E. T. (2010). Network-based statistic:identifying differences in brain networks. NeuroImage, 53(4), 1197–1207.
10. Grajkowska, W., Kotulska, K., Jurkiewicz, E., & Matyja, E. (2010). Brainlesions in tuberous sclerosis complex. Review. Folia neuropathologica, 48(3),139–149.
11. DiMario F. J., Jr (2004). Brain abnormalities in tuberous sclerosiscomplex. Journal of child neurology, 19(9), 650–657.
12. Ridler, K., Bullmore, E. T., De Vries, P. J., Suckling, J., Barker, G. J., Meara, S.J., Williams, S. C., & Bolton, P. F. (2001). Widespread anatomicalabnormalities of grey and white matter structure in tuberoussclerosis. Psychological medicine, 31(8), 1437–1446.
Figures