1649
The circle of stent design for intracranial aneurysm treatment: role of MRI.1Department of Radiology and Neuroradiology, Section Biomedical Imaging, Molecular Imaging North Competence Center (MOIN CC), University Medical Center Schleswig-Holstein (UKSH), Kiel University, Kiel, Germany, Kiel, Germany, 2Chair for Inorganic functional materials, University of Kiel, Kiel, Germany, Kiel, Germany, 3Acquandas GmbH, Kasierstrasse 2, Kiel, Germany, Kiel, Germany, 4Research Campus STIMULATE, University of Magdeburg, Magdeburg, Germany, Magderburg, Germany
Synopsis
Intracranial aneurysms are a life-threatening disease, which can be treated with flow diverter stents. However, complications during or after this endovascular treatment might occur. Therefore, there is a need to improve the current minimally-invasive technologies. In the present study, we proposed and utilized the concept of the iterative stent design focusing on 1) fast prototyping using microsystem technologies and 2) in vitro testing the flow reduction in real-world conditions using 4D flow MRI. As a result, the flow volume entering the aneurysm in the presence of a stent was reduced by 10 %, and then by 85 %.
Introduction:
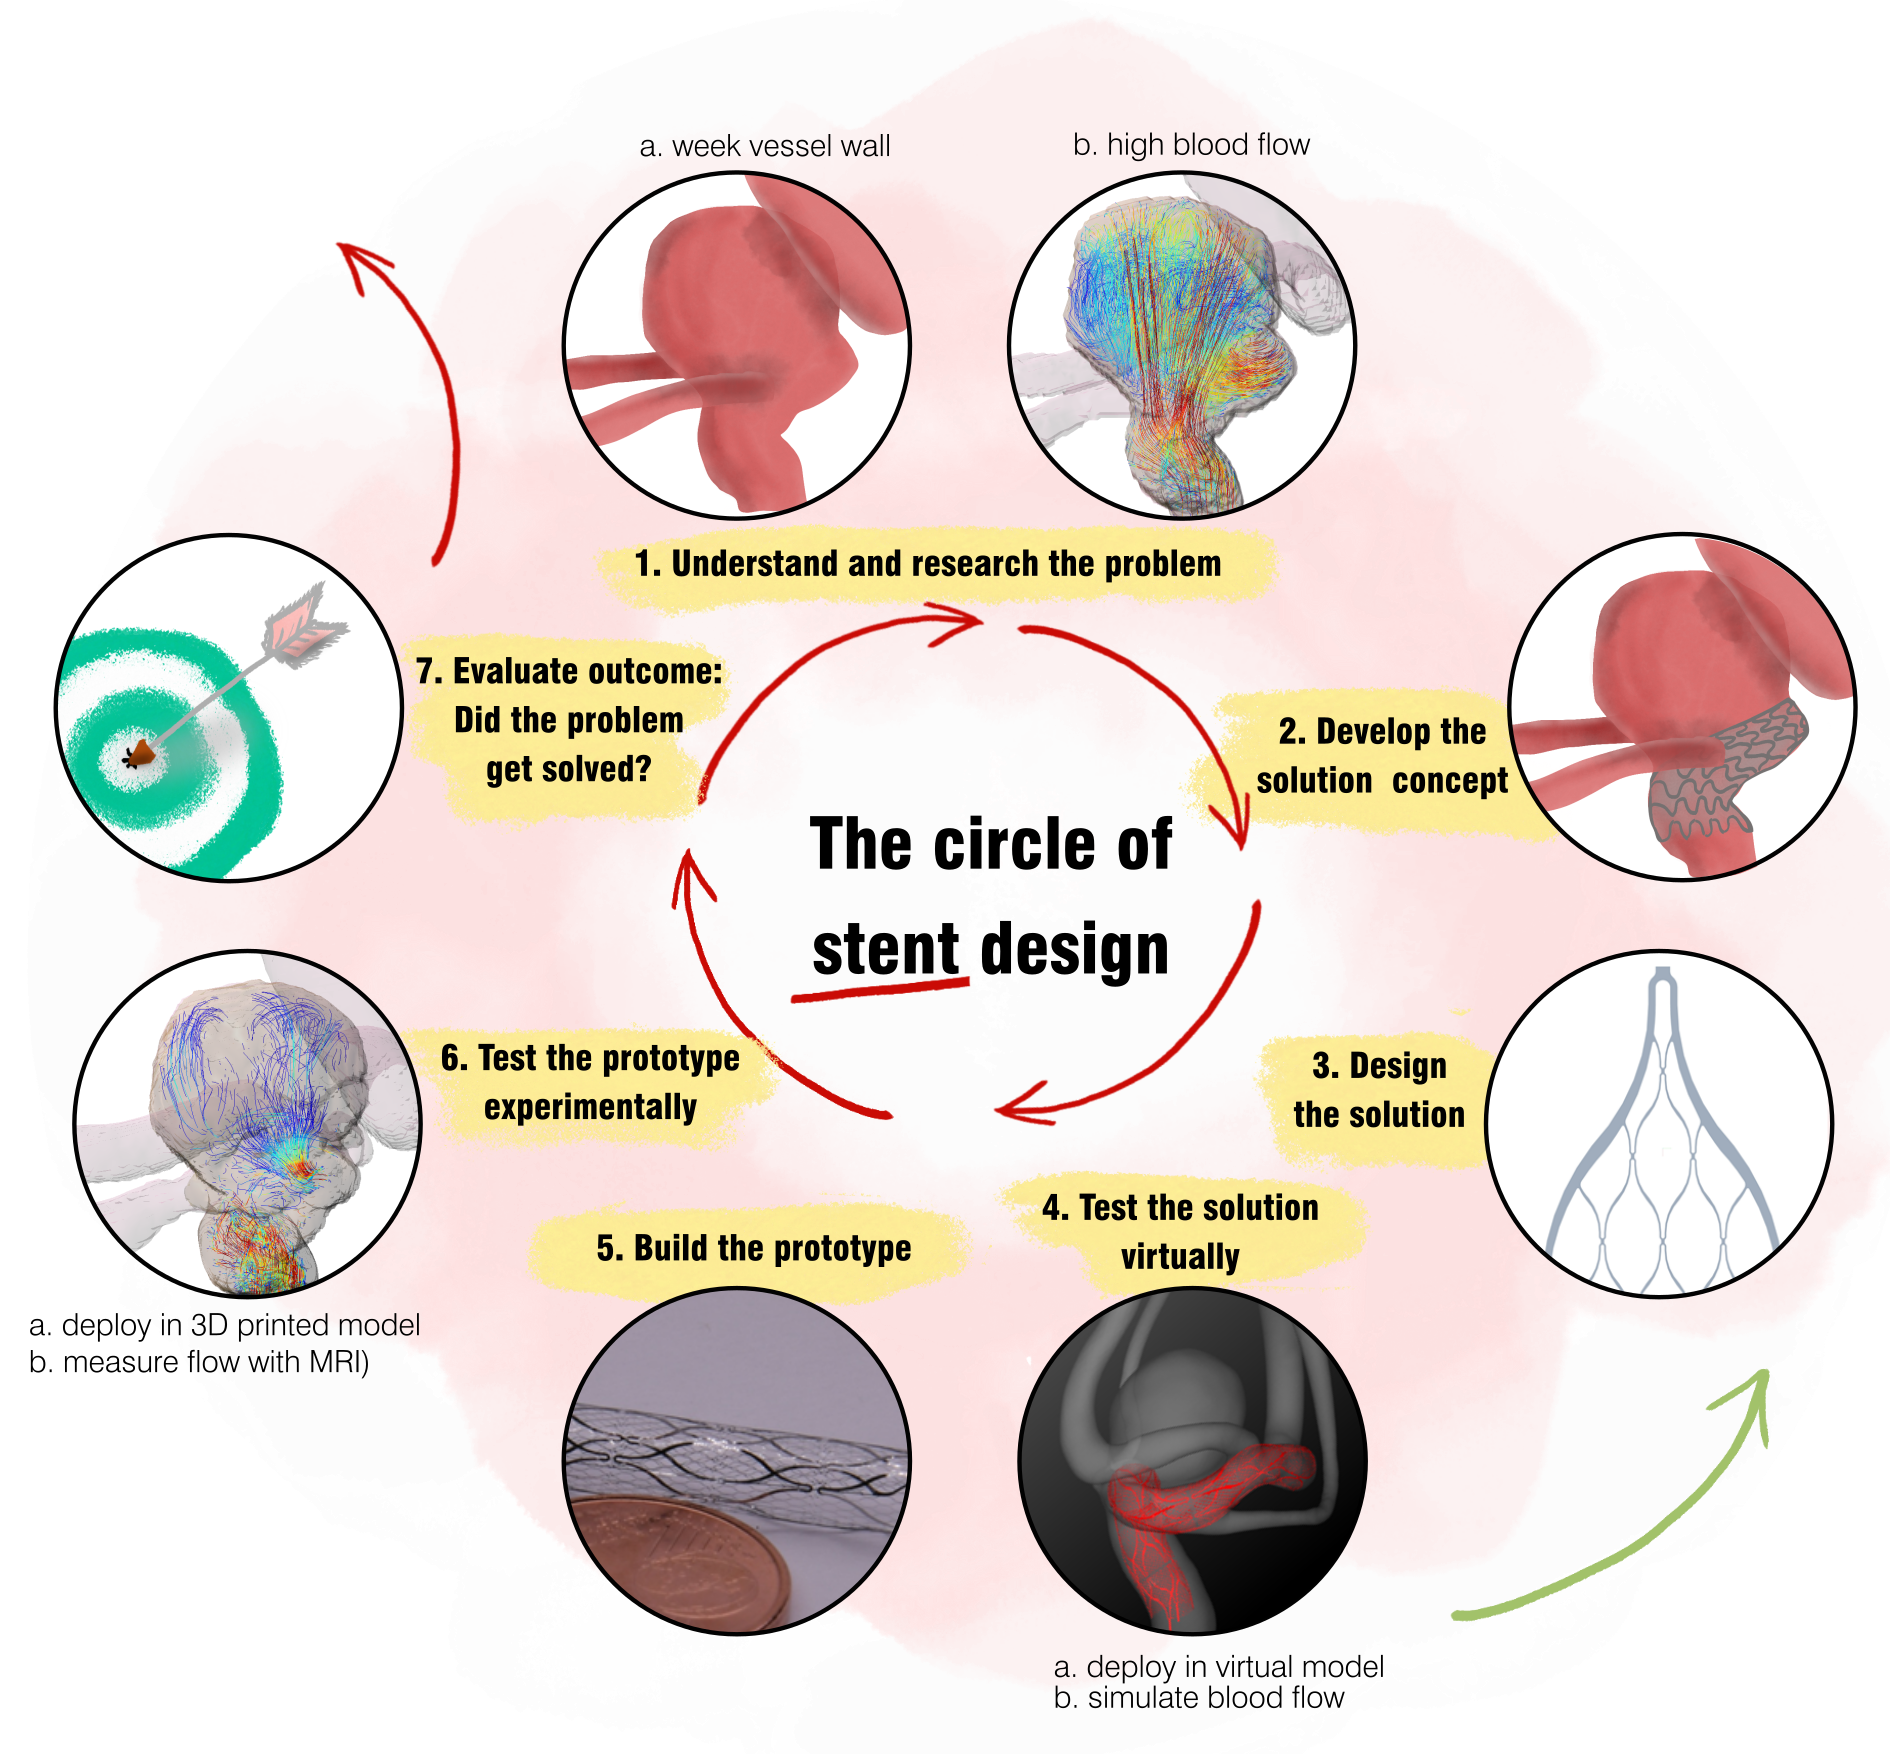
Intracranial aneurysms can cause a life-threatening intracranial hemorrhage. The endovascular flow diverter stents (FDs) deployed into the aneurysm parent artery can reduce intra-aneurysmal blood flow and promote aneurysm occlusion. While the clinical application of FDs is generally successful, complications still occurs1. Therefore, considerable efforts are being made to improve FDs.This work presents an iterative, fast prototyping design concept used to develop novel FDs (Figure 1). The device was based on TiNi thin-films2, which provide higher design freedom, than standard woven TiNi wires.
The stents were designed virtually and deployed into the patient-specific aneurysm model. Flow reduction was assessed with blood flow simulation. Based on these results, the best stent design candidates were fabricated and deployed in a 3D printed flow model, where the 4D flow MRI was used to measure the actual flow properties. This data was used to improve the design, resulting in a novel stent with 85% aneurysm flow volume reduction.
Here, we focus exclusively on MRI and its role in the stent development process.
Methods:
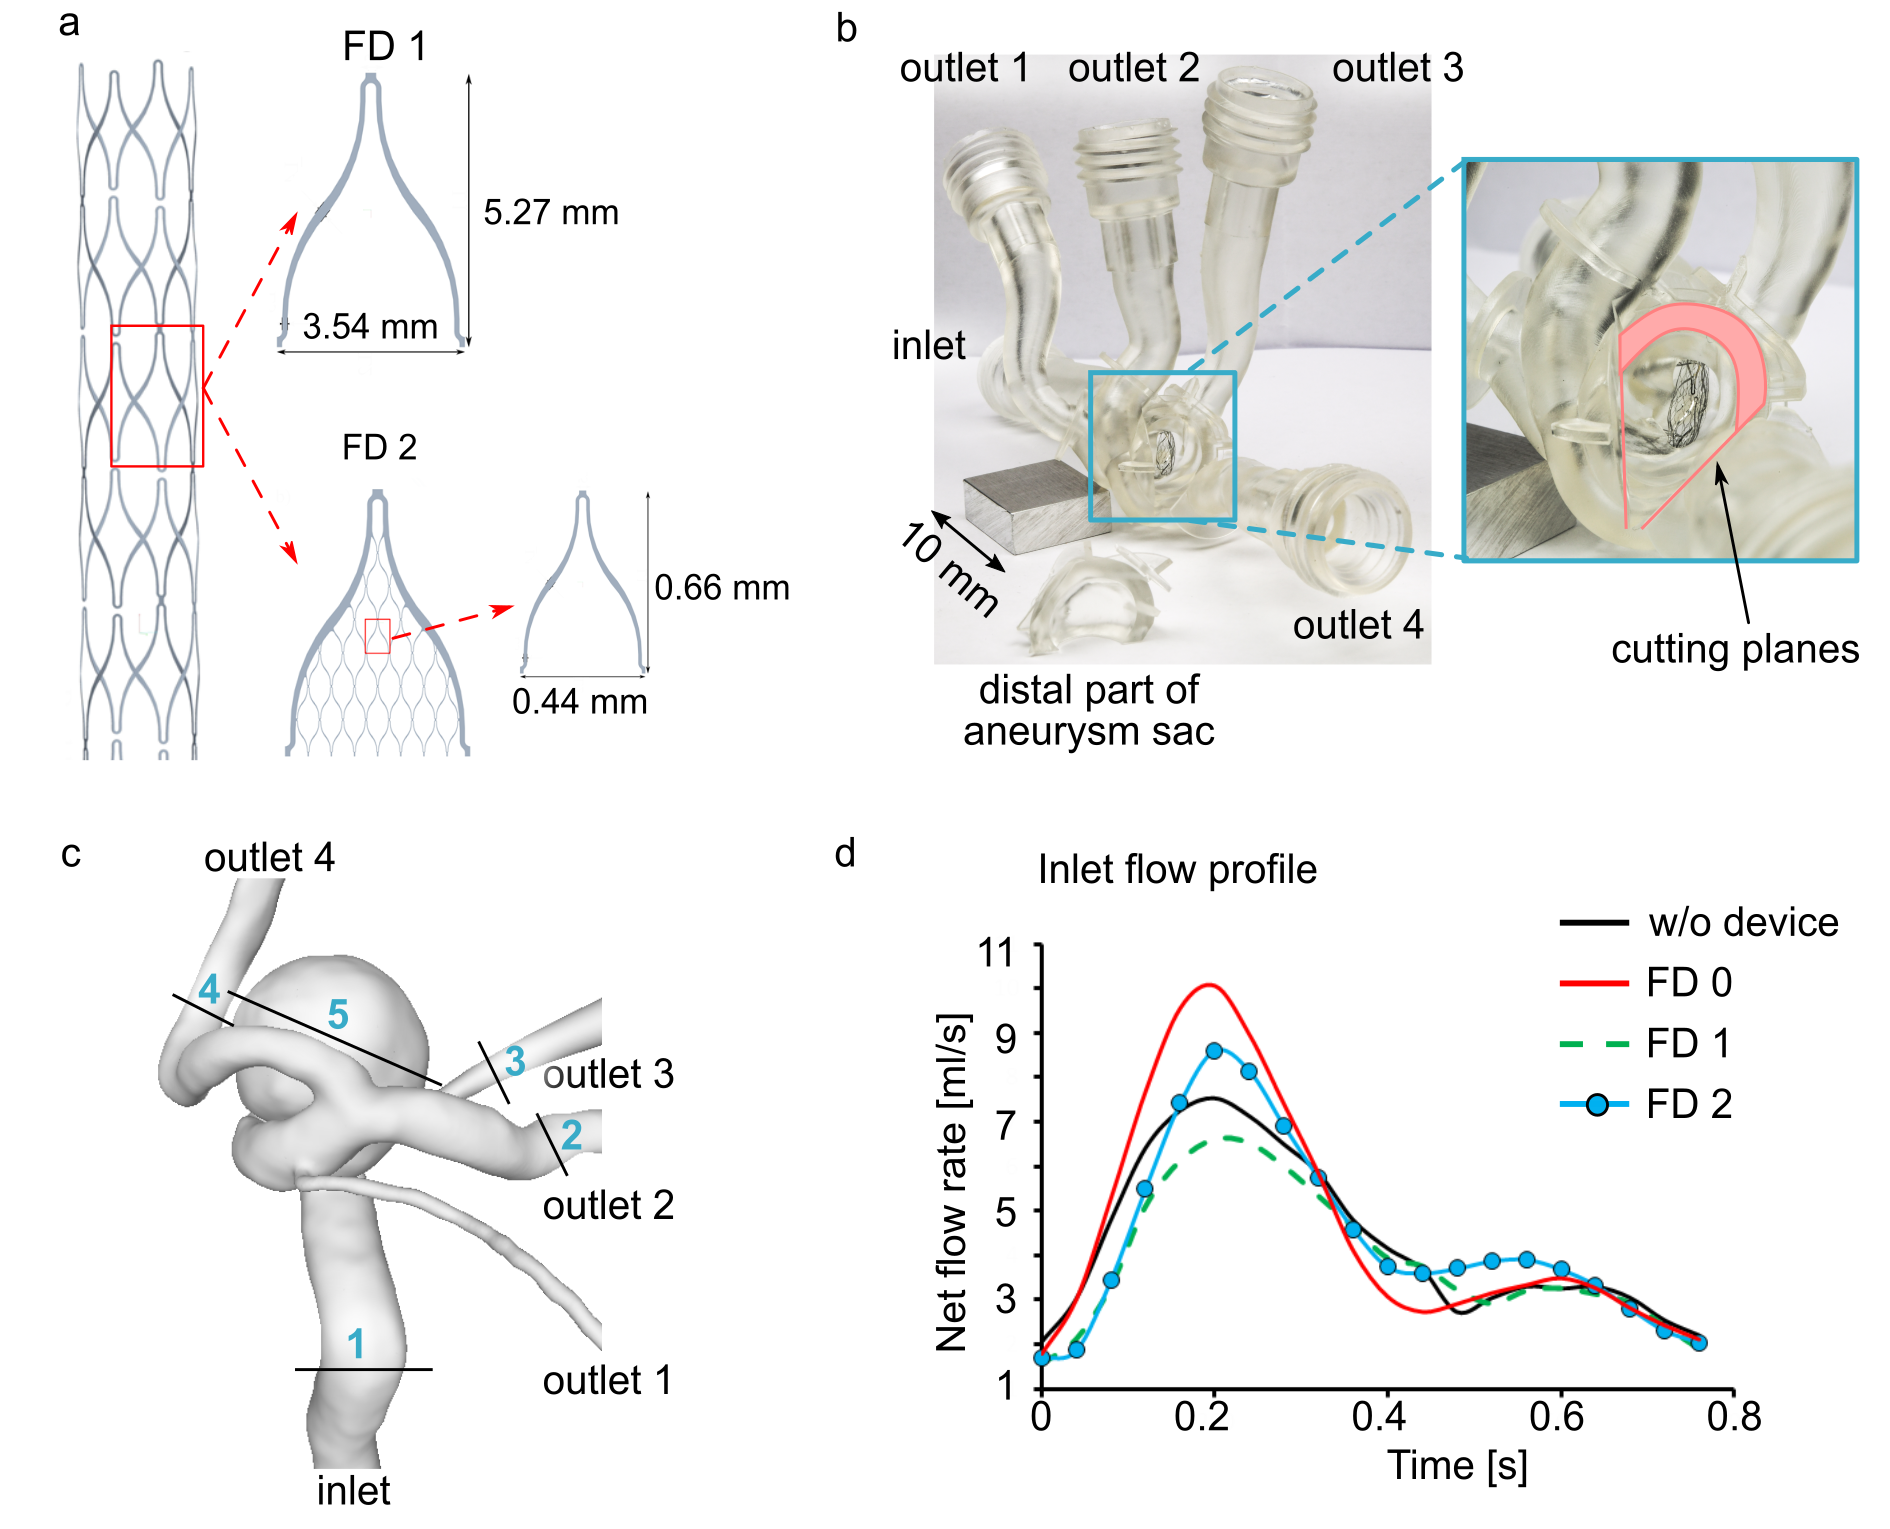
The five stent configurations were virtually deployed in the aneurysm model, and image-based blood flow simulations were carried out using STAR-CCM+ 13.04 (Siemens PLM Software Inc., Plano, USA).Afterward, a commercial stent (FD 0, Derivo, Acandis) and two verified stent design candidates with a porosity of 86 % (FD 1) and 80 % (FD 2) were fabricated using thin-film technology2 (Figure 2 a) and deployed to the 3D printed model (Figure 2 b-c, Form 3, Formlabs) for in vitro testing.
After the deployment, the model was connected to a pulsatile pump with an averaged flow of 250 ml/min set to 0.8 Hz (glycerol-water mixture, PD-1100, BDC Laboratories, Figure 2 d).
4D flow MRI was conducted at 3 T (Ingenia CX, R5 V6.1, Philips Healthcare, Netherland) using a 3D, spoiled gradient, T1-weighted sequence (TE/TR: 5/8.4 ms; FOV: 110 × 110 × 50 mm3, iso voxel size 0.75 mm3). The maximum velocity encoding parameter was set to 25-120 cm/s, 20 cardiac phases were obtained.
The flow was evaluated in the outlets and within the aneurysm (Positions 2-5, Figure 2 c, GTflow, Version 3.1.12, Gyrotools, Switzerland). The evaluation plane in the aneurysm sac was chosen to avoid signal voids from the stent. Finally, the flow volume ratio was calculated, reflecting the flow reduction after stenting normalized to the parent artery flow volume.
Results:
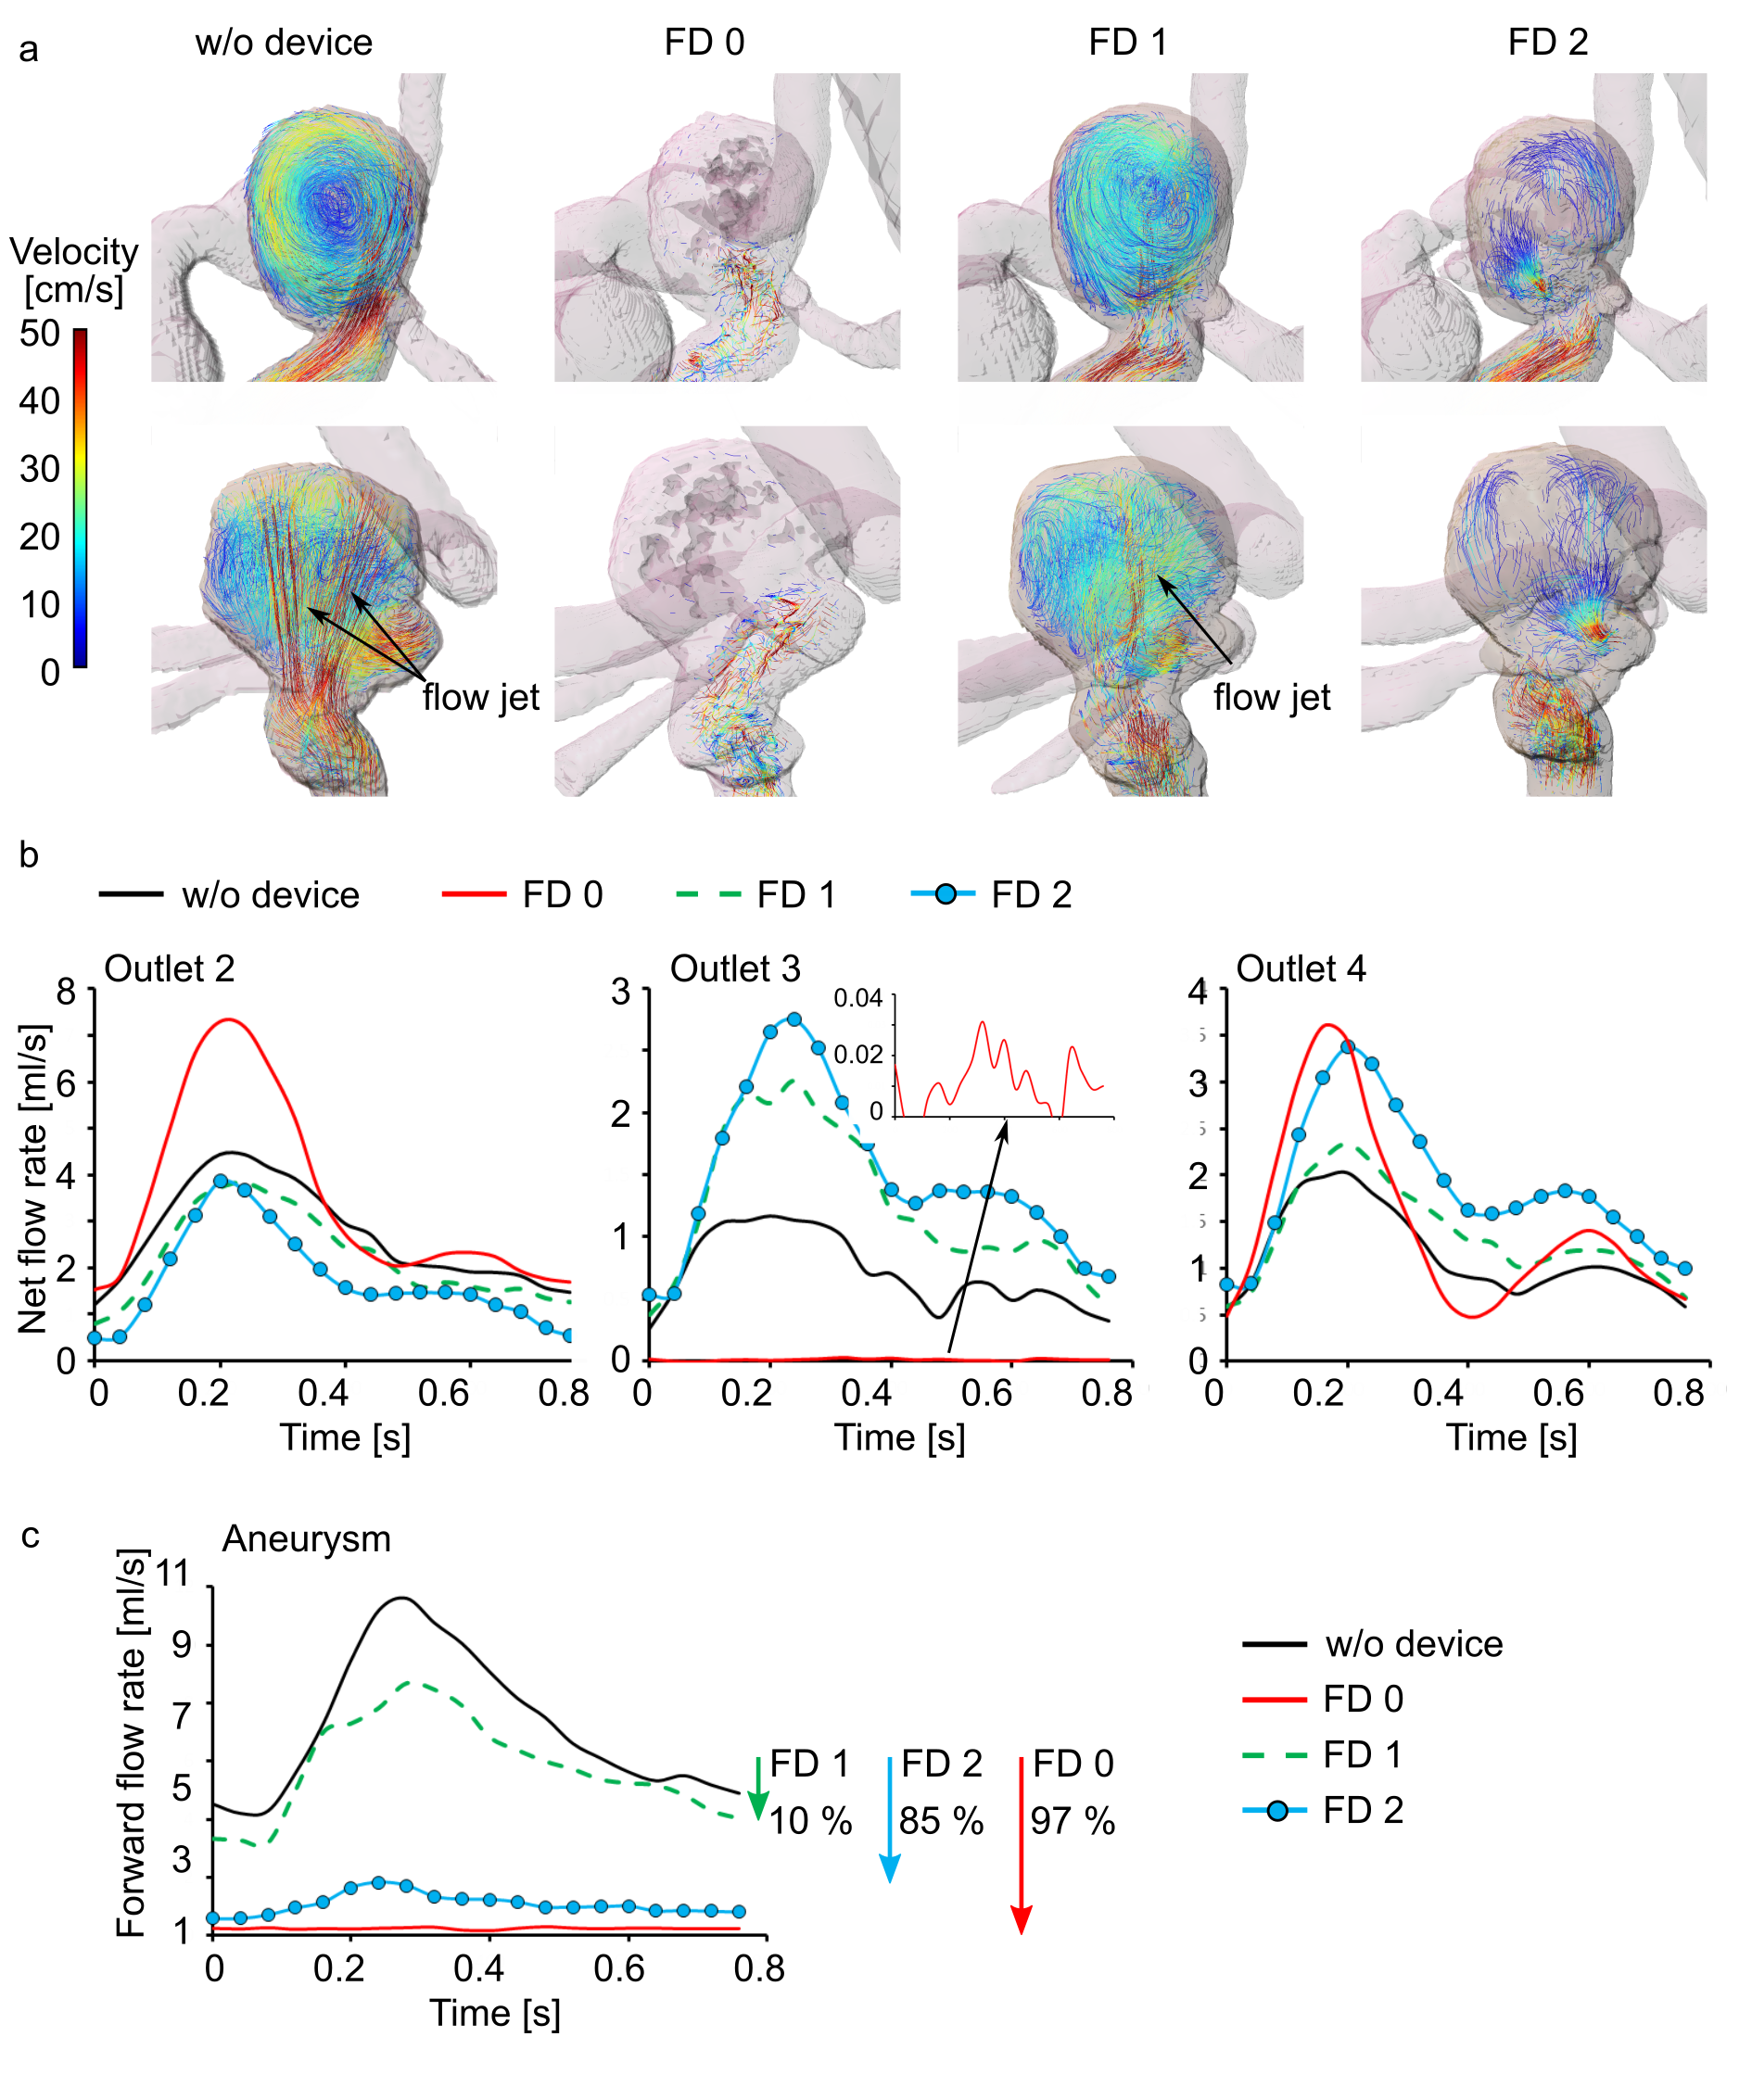
The proposed workflow was applied to design thin-film based FD 1 and FD 2.A strong vortex with a flow volume of 5.7 ml was observed without a stent, with two flow jets located near the aneurysm wall (Figure 3 a). The flow volume of 2.5, 0.6, and 0.9 ml was observed in outlets 2-4 (Figure 3 b).
The deployment of FD 0 resulted in a substantial aneurysm flow volume reduction – 0.2 ml. The flow volume was increased in the outlets 2 and 4 – 2.8 and 1.2 ml, respectively. However, the flow in outlet 3 was not observed at all.
Upon the placement of the FD 1, the flow into the aneurysm was reduced to 4.6 ml. Only one jet remained in the aneurysm sac. The flow volume was decreased in outlet 2 (1.8 ml) and increased in outlets 3 and 4 (1 and 1.1 ml).
At the second iteration of the design circle, the porosity was changed from 86% to 80%. This led to a dramatic reduction in flow volume – 0.9 ml within an aneurysm. The flow volume was decreased in outlet 2 further (1.4 ml) and increased in outlets 3 and 4 (1.2 and 1.5 ml).
The flow volume reduction ratio was 10, 85, and 97 % for FD 1, FD2, and FD 0 (Figure 3 c).
Discussion:
Virtual testing, fast prototyping, 3D printing, and 4D flow MRI allow rapid cycles and quick improvements in stent design. Quick experimental testing enabled the verification of deployment feasibility.Initial stent configuration was rejected as it was impossible to deploy them into the highly curved geometry.
Our results indicate that thin-film-based stents reduce the flow in an aneurysm sac. After the second iteration of the proposed design concept, the flow volume was reduced to 85 %, which is already promising but still less efficient than state-of-the-art – 97 %. Nevertheless, the commercial stent resulted in the blockage of outlet 3, likely due to the dense mesh. Outlet 3 represents an ophthalmic artery, blockage of which potentially can lead to optic nerve ischemic atrophy3.
The remaining shortcomings include strong metal artifacts and limited vessel wall adaption. These will be addressed in the following iterations.
MRI is useful for stent testing as it can be applied for the follow-up stent assessment in vivo, and it provides the 3D velocity distribution. However, it has limited sensitivity to the regions with a slow flow, which can be eliminated with suitable velocity encoding parameters. Besides, the flow cannot be analyzed in the stent's vicinity due to the metal artifacts and the branches whose diameter is less than the MRI acquisition resolution.
Conclusion:
Thin-film technologies, modern computational methods as well as additive manufacturing, and 4D flow MRI allow short cycles to improve the design of flow diverter stents.Acknowledgements
We are grateful for the financial and intellectual support by the Research Training Group "Materials4Brain" (GRK2154; P2). Furthermore, this study was partly funded by the Ministry of Economics, Science and Digitization of Saxony-Anhalt within the Forschungscampus STIMULATE (grant number I 117) and the German Research Foundation (grant number BE 6230/2-1).References
1. Lv, X., Yang, H., Liu, P. & Li, Y. Flow-diverter devices in the treatment of intracranial aneurysms: A meta-analysis and systematic review. Neuroradiol. J. 29, 66–71 (2016).
2. Miranda, R. L. de, Zamponi, C. & Quandt, E. Micropatterned Freestanding Superelastic TiNi Films. Adv. Eng. Mater. 15, 66–69 (2013).
3. Rouchaud, A. et al. Visual Outcomes with Flow-Diverter Stents Covering the Ophthalmic Artery for Treatment of Internal Carotid Artery Aneurysms. Am. J. Neuroradiol. 36, 330–336 (2015).
Figures