1645
Evaluation of optimized 4D ultrashort TE MR Angiography using Variable Inversion Time1Radiology, Department of Radiology, Graduate School of Medicine, University of Tokyo, Tokyo, Japan, 2Department of Radiology, Juntendo University Graduate School of Medicine, Tokyo, Japan, 3Department of Radiology, Toranomon Hospital, Tokyo, Japan, 4Department of Radiology, Juntendo University Hospital, Tokyo, Japan
Synopsis
We developed and refined a novel method, Variable TI, to improve the visibility of ASL based UTE 4D-MRA. From numerical simulations and the flow phantom studies we found the signal tendency and blood signal skipping phenomena. With refined parameters we got 50% of signal enhancement comparing to conventional method. We conduct volunteer study with the refined Variable TI UTE 4D-MRA and this novel method offered a higher signal intensity and improved visualization of arteries in late phase compared to the conventional method. The Variable TI technique can improve clinical usability of 4D-MRA.
INTRODUCTION
Arterial Spin Labeling (ASL) based 4D ultrashort TE (UTE) MR angiography (MRA) has been applied to visualize hemodynamic information with its high temporal and spatial resolution. However, conventional multi-phase ASL 4D UTE MRA sometimes provides insufficient signal intensity to visualize the hemodynamic flow characteristics of pathological cerebral veins. The signal from the blood is reduced due to the relaxation of the longitudinal magnetization to the equilibrium. The multi-phase acquisition method utilizes the combination of Look-Locker acquisitions and UTE readout, thus multiple UTE radio frequency (RF) pulses accelerate the T1 relaxation in readout process. To overcome this limitation, we implemented the Variable Inversion Time (VTI) method and reported in ISMRM2020 as an initial experimental study. In this study, we performed numerical simulations of blood signal intensity and flow phantom study to optimize the VTI method. We conducted a volunteer study with refined parameters, and higher blood signal intensity than the conventional method was achieved in late phases.METHOD
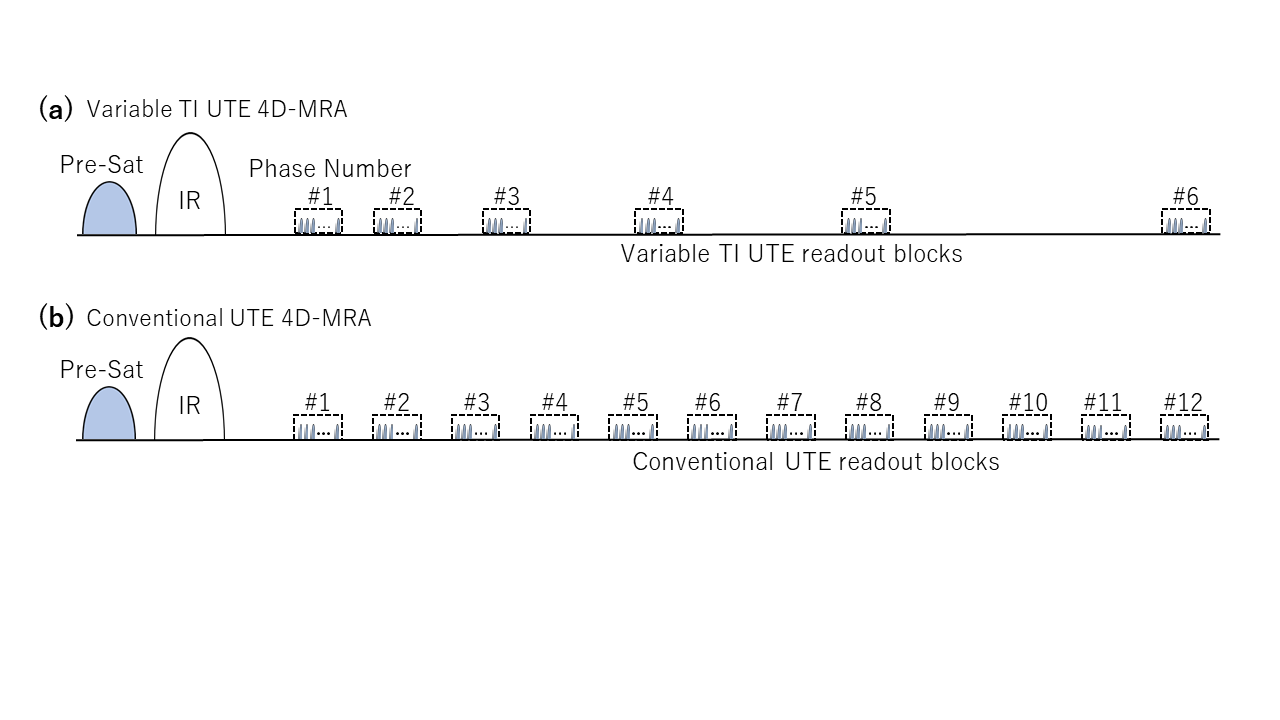
The numerical simulations for blood signal intensity were performed with MatLab (R2019b, MathWorks, Natick, MA). Conventional 4D UTE MRA utilized Look-Locker acquisition combined with UTE readout pulses with equally spaced TI intervals. The same condition was used for the VTI method, except the delay time between TI intervals, which increased with a manner of progression of difference. All subjects were scanned on a 3 Tesla MRI scanner (Vantage Galan 3T ZGO, Canon Medical Systems Corporation, Japan) using a 32-channel head coil for signal reception. The data acquisition was based on a 3D radial sampling, and ASL technique was used as a preparation pulse to visualize blood flow. The UTE readout consisted of a series of blocks. Data from each readout block were used to construct a single image, using half sinc pulses with a duration of about 30 μs and flip angles up to 6°. Imaging parameters were as follows: FOV = 224 x 224 mm2, number of slices = 200, resolution = 1 x 1 x 1 mm3, TR/TE = 3.7/0.1 ms, shot interval = 3600 ms, 7950 radial projections were acquired within 18 minutes. The signal intensity was evaluated using flow phantom 30 to 33 cm/s of flow velocity with pulsation of 60 beats per minutes whose T1 relaxation time was adjusted to 1850 ms with a gadolinium agent. All the TI steps started at 200ms and ended at 2400ms in both the conventional and VTI methods. The conventional method utilized equally spaced TI intervals. For the VTI method, intervals of TI steps increased with a manner of progression of difference, as shown in figure 3. All the acquisitions were performed using otherwise identical imaging parameters. Eight healthy volunteers (4 male, 4 female; mean age 41 years) without history of cerebrovascular diseases were scanned and evaluated for visibility of arteries. For comparison, volunteers were scanned with the conventional and VTI method using otherwise identical imaging parameters.RESULTS
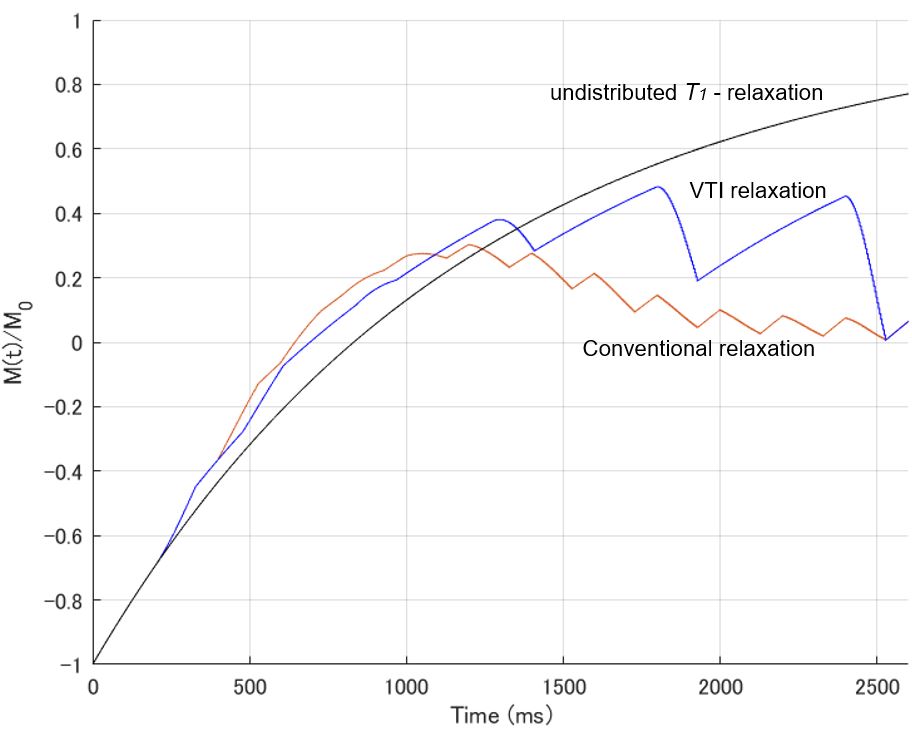
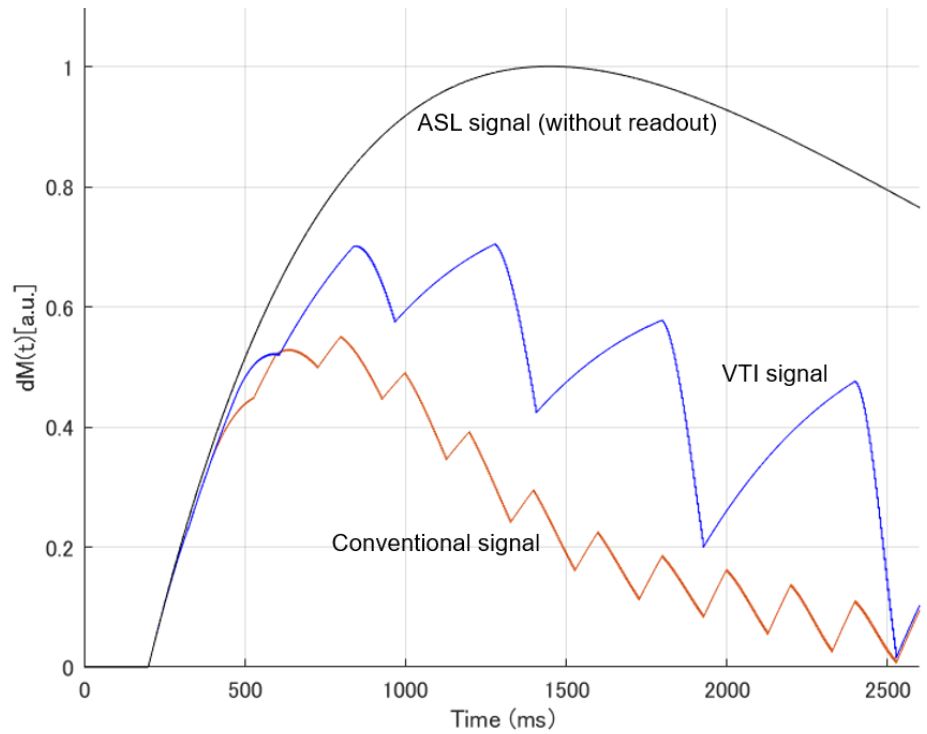
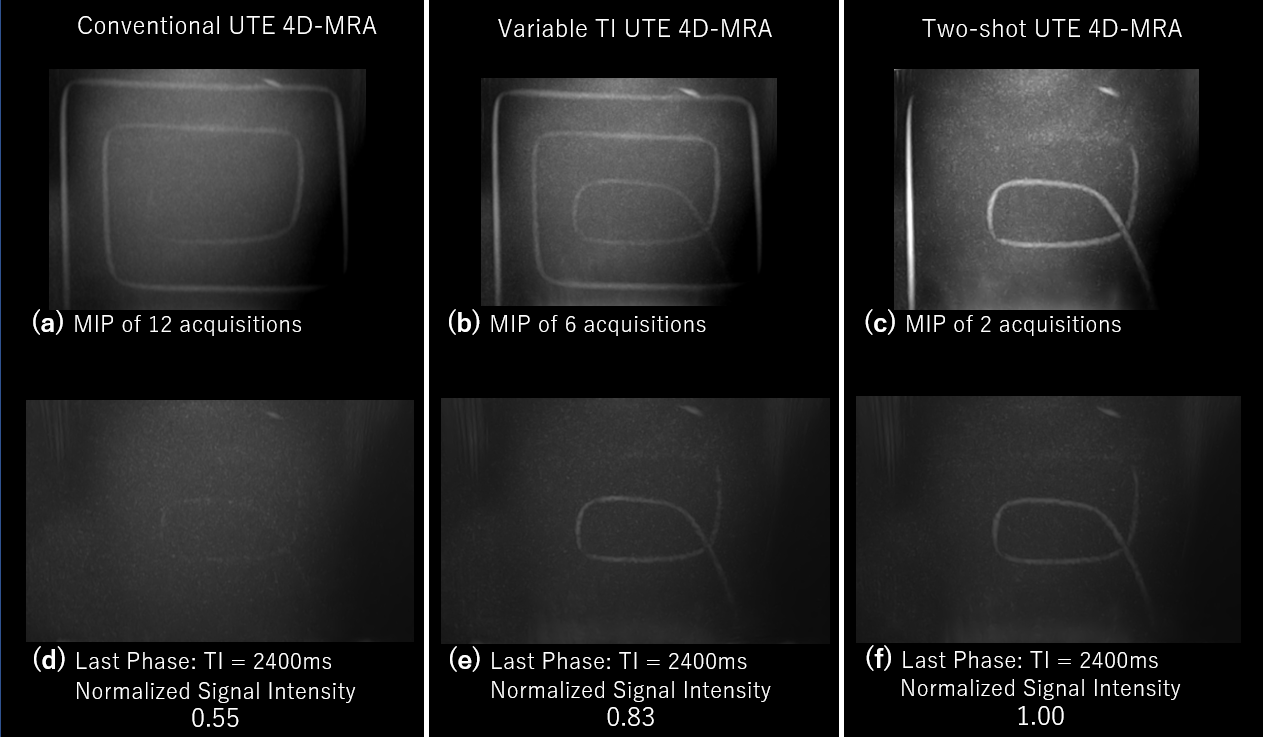
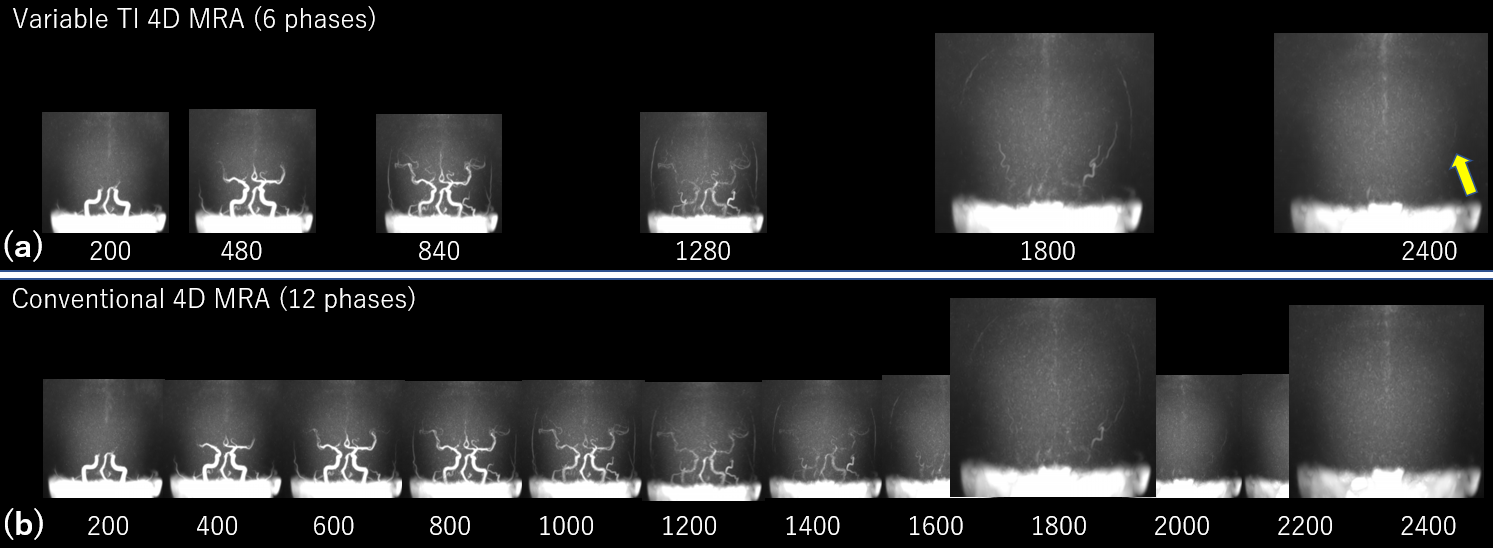
As shown in Figure 1, the conventional 4D UTE MRA drives the magnetization into a steady state. On the other hand, VTI 4D UTE MRA keeps longitudinal relaxation in late phase. The blood signal intensity of the conventional method decreased in later phases. On the contrary, the VTI method compensated for this signal loss (Figure 2). In the flow phantom study, the last phase (TI = 2400 ms) of the signal intensity acquired with VTI under the condition of 6 acquisitions was approximately 50% higher than that of the conventional method with 12 acquisitions (Figure. 4). The detail of optimization process in the phantom study is reported in SMRT2021. In the volunteer study, as indicated in figure. 5, VTI 4DUTE MRA allowed improved visualization of the arteries in later phases without lack of structural information.DISCUSSION
From the numerical simulations, the VTI 4D UTE MRA prevents the magnetization into a steady state and keeps longitudinal relaxation in late phases as shown in Figure 1. The acquired signal in the ASL method is proportional to the difference between labeled and control measurement. In the conventional method, the longitudinal magnetization could not fully recover, and the signal decreases in late phases. On the other hand, with the VTI method, adding delay time between TI intervals provides time to recover the longitudinal magnetization and prevents signal loss. Compared to the flow phantom study, there was less blood signal in the volunteer study. This would be due to the homogeneity and the dispersion of the blood from the vein to the brain tissue. The apparent blood T1 and T2 may be shorter than the true blood relaxation time, and also shorted by the influence of blood flow velocity and RF pulses. Utilizing wide bandwidth RF tips more of the short-T2 magnetization into the transverse plane, causing more T2 relaxation to occur. In this point of view, it is reasonable to reduce the number of acquisitions in late phases to prevent signal loss.CONCLUSION
we presented the higher ability of VTI UTE 4D-MRA to visualize hemodynamic flow characteristics of cerebral veins compared to the conventional method without reducing structural information. This new method can improve the assessment of many cerebrovascular diseases. The VTI method could have potential to be applied to other applications.Acknowledgements
No acknowledgement found.References
1. Tyler DJ, Robson MD, Henkelman RM, Young IR, Bydder GM. Magnetic resonance imaging with ultrashort TE (UTE) PULSE sequences: technical considerations. J Magn Reson Imaging 2007; 25: 279–289.
2. Gönner F, Heid O, Remonda L, et al. MR angiography with ultrashort echo time in cerebral aneurysms treated with Guglielmi detachable coils. AJNR Am J Neuroradiol 1998;19:1324–28 pmid:9726477
3. Nielsen HTC, Gold GE, Olcott EW, Pauly JM, Nishimura DG. Ultra-short echo-time 2D time-offlight MR angiography using a half-pulse excitation. Magn Reson Med 1999;41:591–599.
4. Larson PEZ, Conolly SM, Pauly JM, Nishimura DG. Using adiabatic inversion pulses for long-T2 suppression in ultrashort echo time (UTE) imaging. Magn Reson Med. 2007;58(5):952–961.
5. Takano N, Suzuki M, Irie R, et al. Usefulness of non-contrast-enhanced MR angiography using a silent scan for follow-up after Y-configuration stent-assisted coil embolization for basilar tip aneurysms. AJNR Am J Neuroradiol 2017;38:577–81.
Figures