1637
Improving iSNAP by using FOCI inversion RF pulse for simultaneous measurement of multiple intracranial vascular imaging contrasts1Vascular Imaging Lab and BioMolecular Imaging Center, Department of Radiology, University of Washington, Seattle, WA, United States, 2Center for Biomedical Imaging Research, Tsinghua University, Beijing, China
Synopsis
Multi-contrast images including hemodynamic information in one sequence have significant impact in evaluating intracranial vessels. In this work, we proposed to use FOCI inversion pulse combined with the multi-contrast sequence iSNAP to further improve image quality of dynamic and static MRA. Promising results were obtained from both phantom and in vivo data.
Introduction
Acquiring multi-contrast images of intracranial vessels is important for comprehensive neurovascular disease diagnosis. However, this is impeded by the long total scan time, since multiple MR sequences need to be performed. Previously, a highly time-efficient sequence named iSNAP was introduced that has the functionality for simultaneously obtaining whole brain dynamic and static MRA, intracranial vessel wall images and T1W structural images.1 The original dynamic MRA (dMRA) of iSNAP, based on FAIR-ASL, however, suffered from residual soft tissue signal at first time frame due to off-resonance effect and imperfect inversion slice profile from the standard hyperbolic secant (HS) inversion pulse after subtraction based FAIR-ASL type reconstruction. Previous studies showed that Frequency Offset Corrected Inversion (FOCI) RF pulse can minimize subtraction error in perfusion imaging due to its sharper transition band in slice profile.2,3,4 In this study, we proposed to use FOCI inversion pulse in iSNAP to improve the image quality. The advantages of FOCI pulse over HS pulse in iSNAP were demonstrated with both phantom and in vivo experiments.Methods
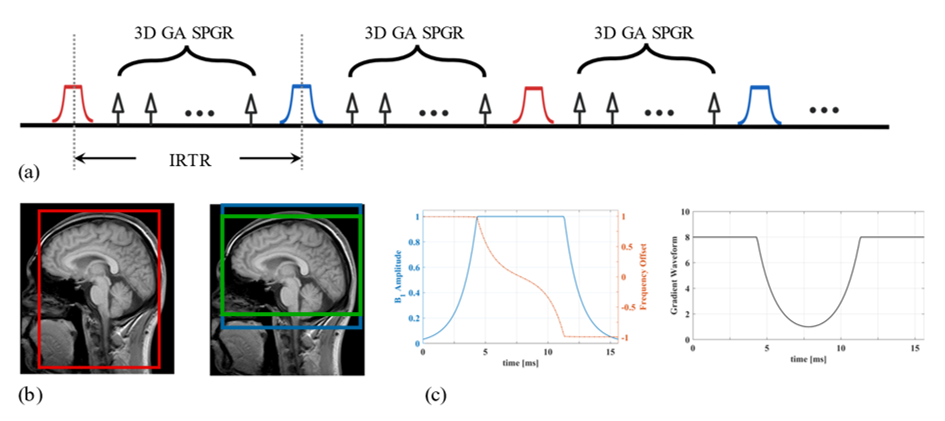
RF Pulse Design: We selected C-shape FOCI pulse since it has the sharpest transition band in simulation and experiment results.2,5 The waveform of FOCI is a product by multiplying the shape function on gradient amplitude, RF amplitude and resonance frequency offset separately. The envelope functions of FOCI pulse were designed as follows:$$B_1^{FOCI} = A(t) \times sech(\beta t), \\ \Delta \omega^{FOCI} = -A(t) \times \mu \beta \tanh{(\beta t)}, \\ G(t) = A(t) \times G,$$where $$$G$$$ is the constant gradient applied in standard HS pulse, $$$\beta$$$, $$$\mu$$$ are designed as 826s-1 and 6.2, pulse duration T= 15.3ms. Maximum value of $$$A(t)$$$, $$$A(t)^{max}=8$$$, was set according to our gradient amplifier and RF specifications. The waveforms of FOCI are shown in Figure 1 (c).
Data Acquisition: Sequence scheme and inversion manipulation of iSNAP is shown in Figure 1 (a), (b). Both the phantom experiment and in vivo experiment were performed on a Philips Ingenia 3T MR scanner (Philips Healthcare, Best, The Netherlands) using a 32-channel head coil. The shared imaging parameters in phantom and in vivo experiments were golden angle (GA) radial encoding, spoiled gradient echo (SPGR) readout, TR/TE=7.6/2.7ms, readout excitation thickness in slice direction 137.5mm, flip angle=6$$$^{\circ}$$$. For phantom scans, both HS-iSNAP and FOCI-iSNAP were acquired with voxel size 1.72mm isotropic, turbo factor 384, small/large inversion slab thickness 55/88mm, total scan time 1.5min. For in vivo scan, two healthy subjects (male, age 22, 29 years) were recruited to test the sequence with voxel size 0.8mm isotropic, turbo field factor 280, small/large inversion slab thickness 154/500, 137.5/500 or 110/500mm, total scan time 6.5min.
Image Reconstruction: Similar to the original iSNAP1, KWIC method with different data-sharing strategies6 in 3D golden angle kooshball trajectory was used to reconstruct the different image contrasts. Specifically, static MRA/dMRA were obtained by reconstructing images at a single/multiple inversion delay time and then performing subtraction between the acquisitions with small and large inversion. Vessel wall images were obtained by using the phase-sensitive inversion recovery method7 or reconstructing images at a TI near the zero-cross point of blood T1 relaxation curve, based on the data acquired with large inversion slab. T1W images were obtained by averaging the k-space data of the two ASL acquisitions before reconstruction with non-uniform FFT.
Results & Discussion
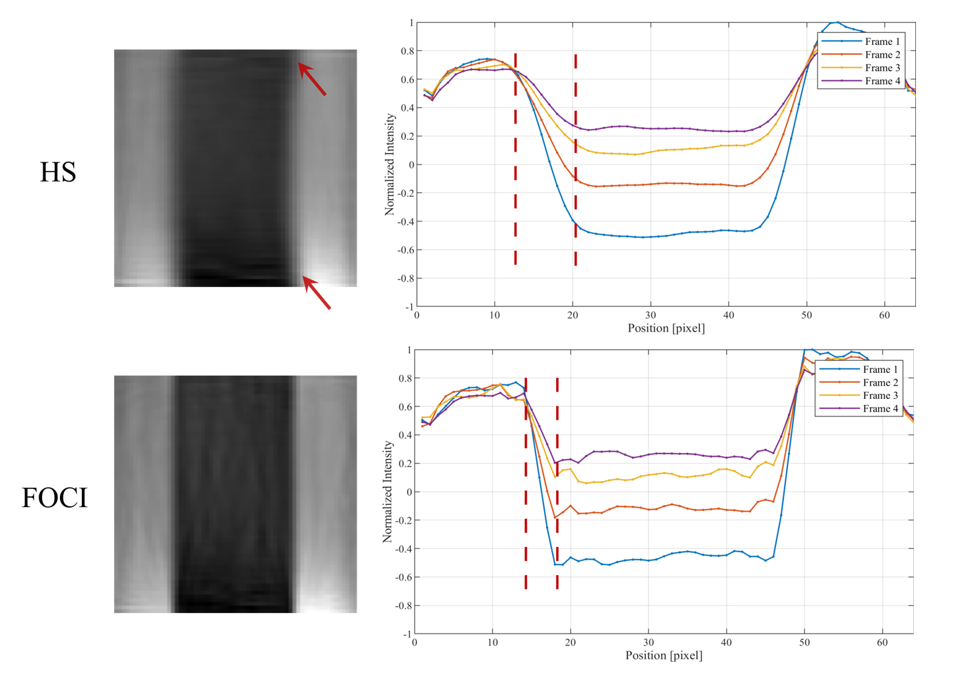
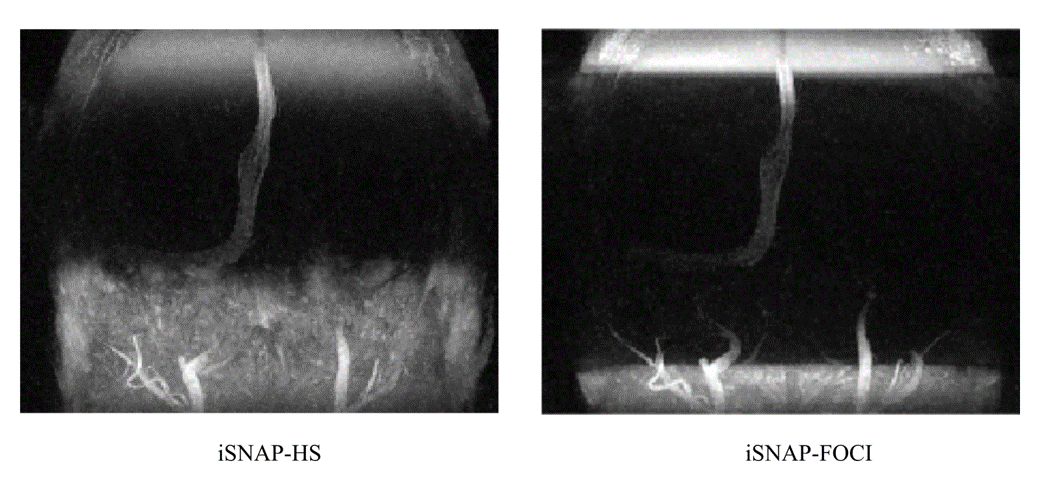
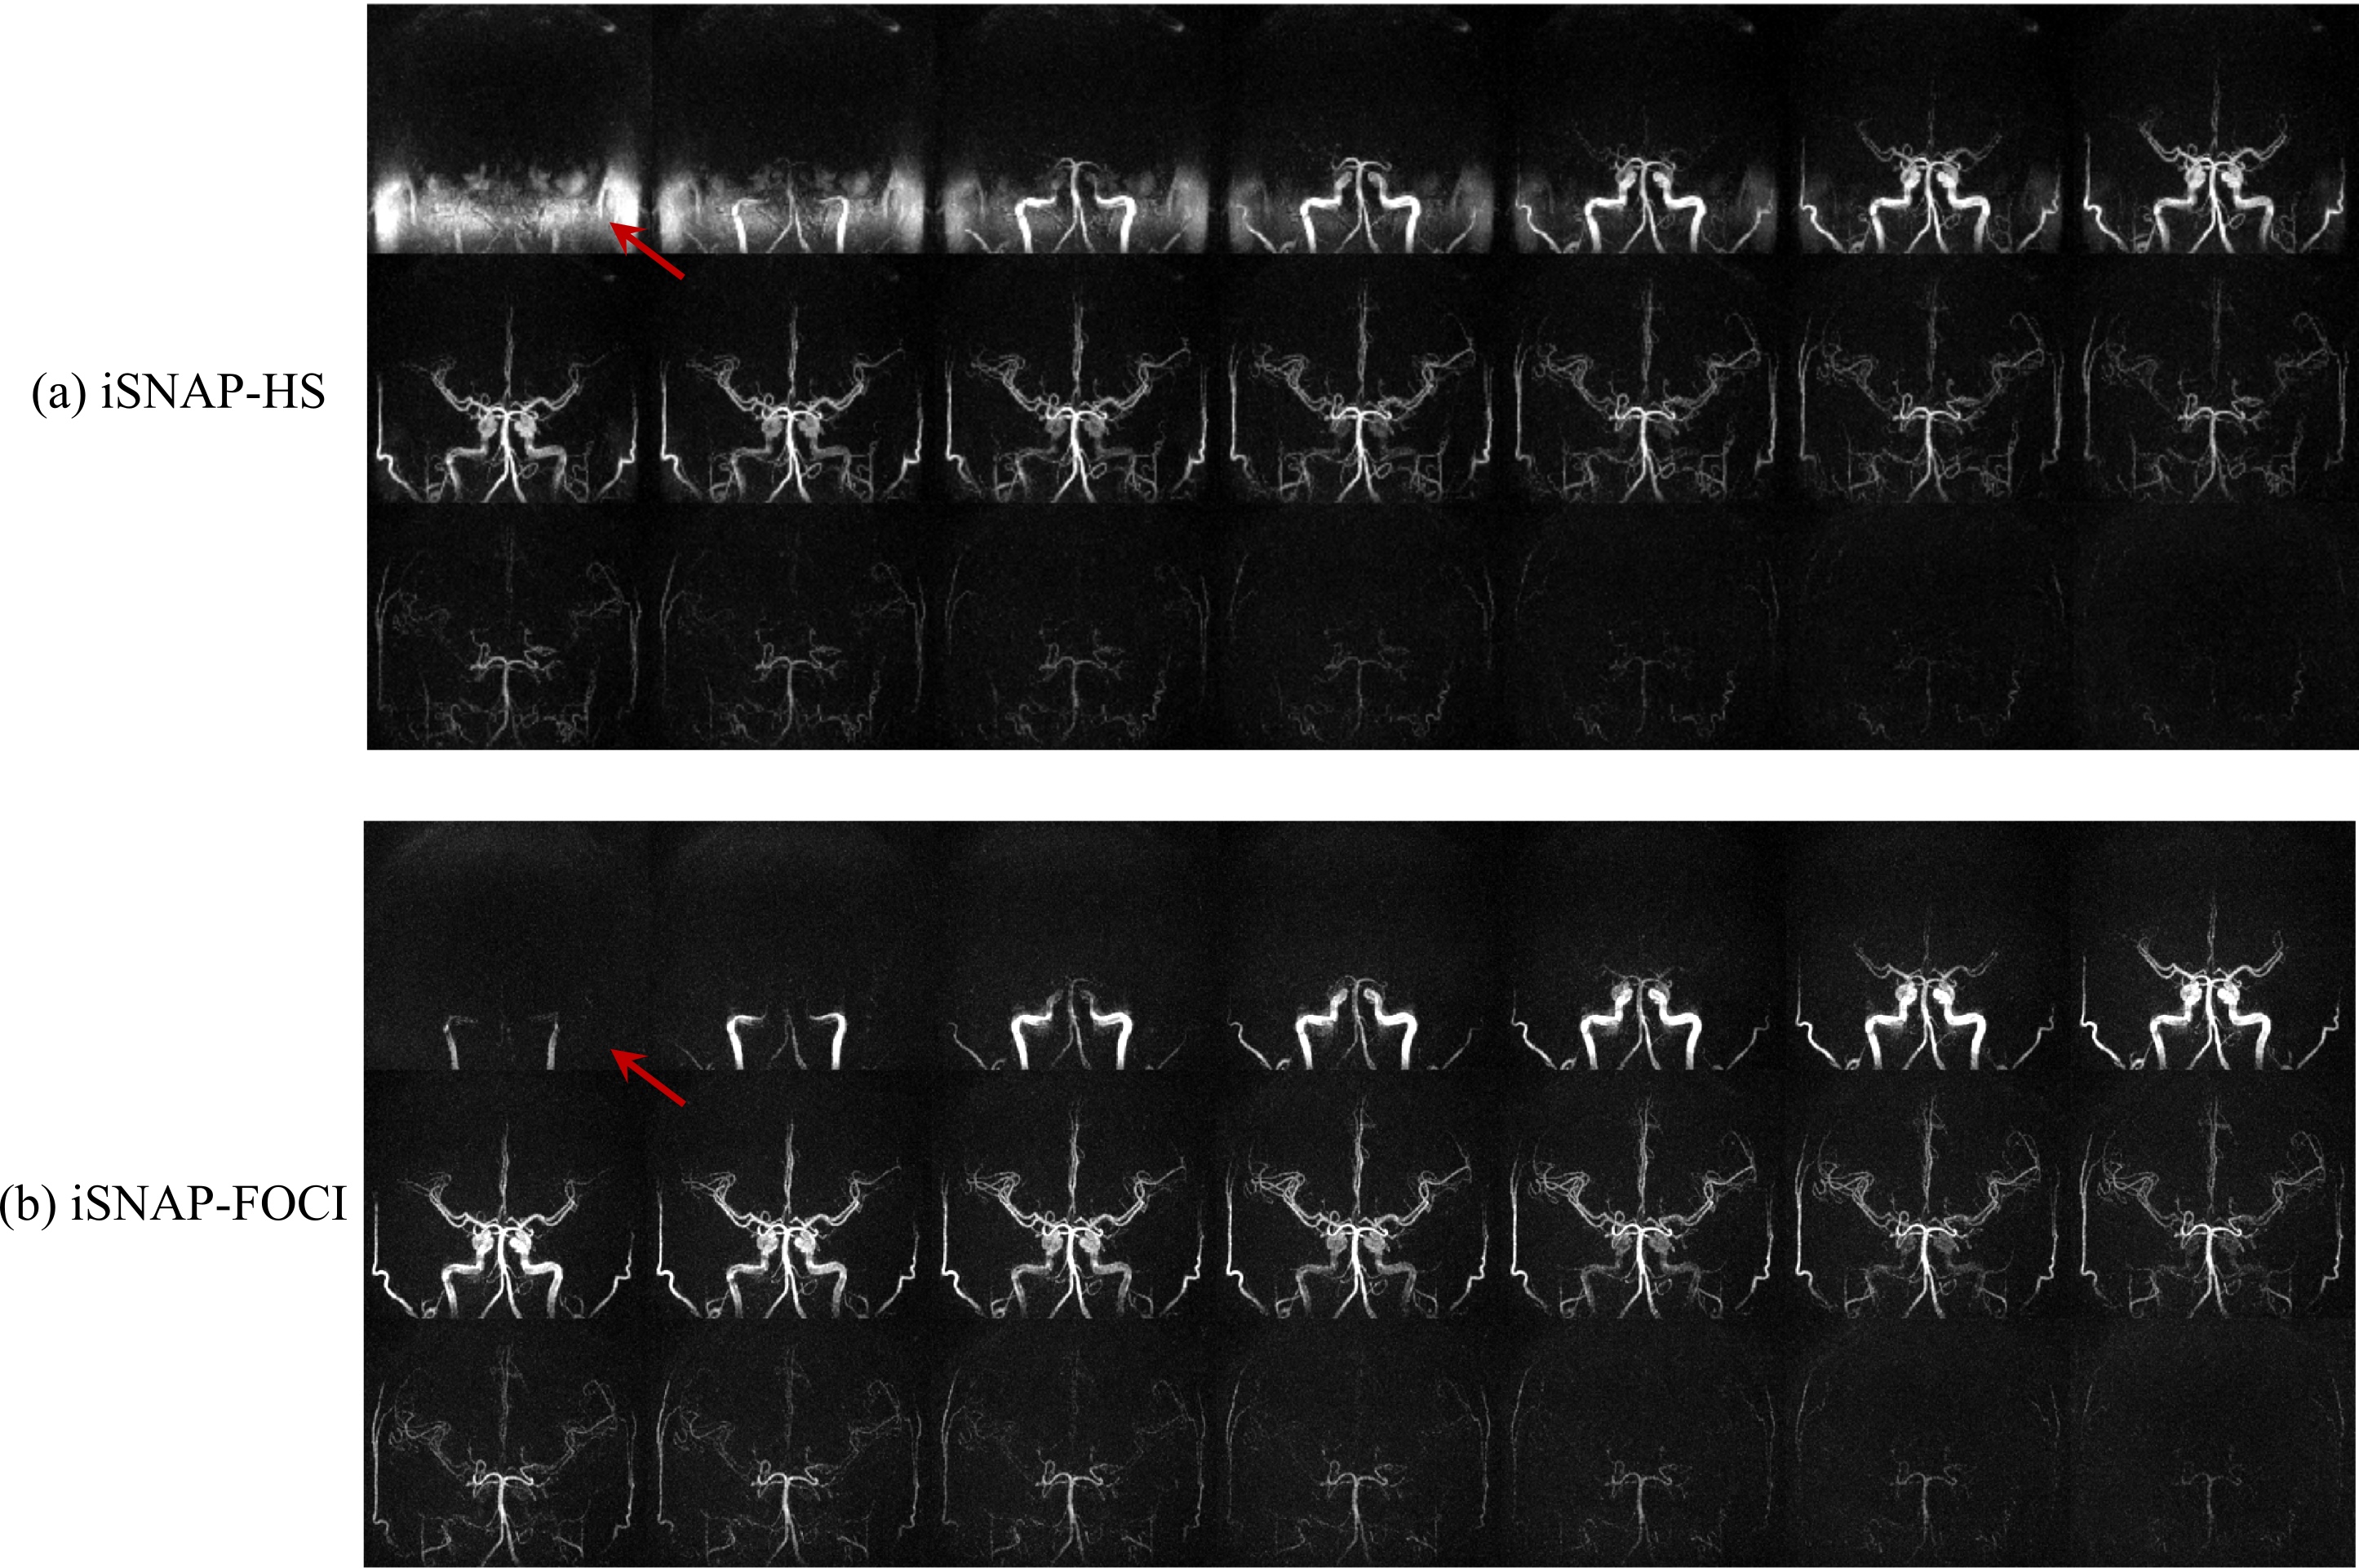
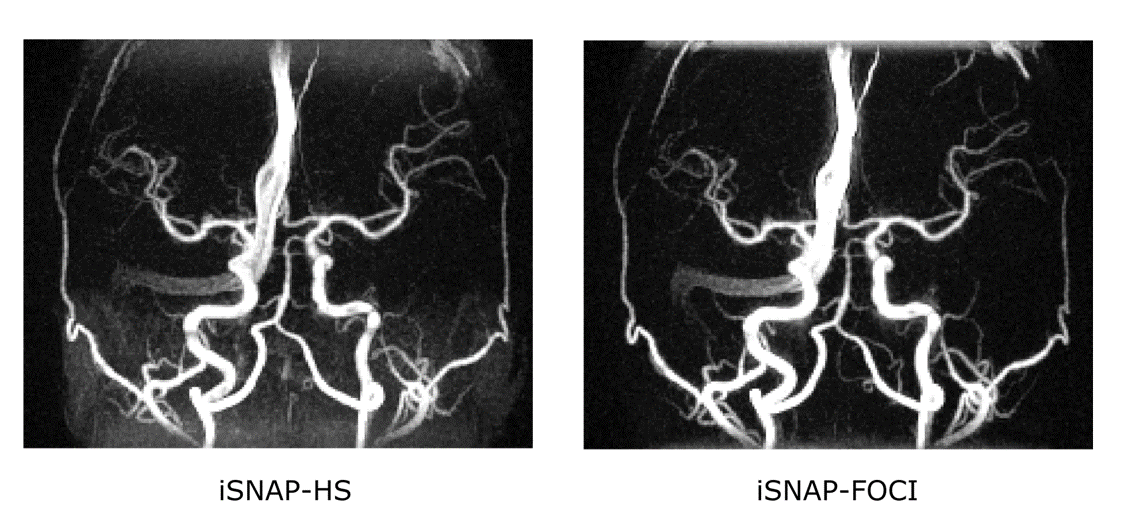
Figure 2 shows the inversion profile of the first four frames of iSNAP-dMRA obtained with the two different inversion pulses on phantom. Transition band in FOCI-iSNAP is much sharper on either side of the whole inverted region. However, the profile of FOCI in the inverted region seems to be slightly less smooth compared to HS. In Figure 3, we deliberately used a small slab inversion thickness smaller than the readout excitation thickness, in order to inspect the transition band on in vivo experiment. It perfectly demonstrated the two transition bands follow the same pattern as in the phantom experiment. Another example showing removal of background artifacts by using FOCI pulse is shown in Figure 4. For the FAIR-ASL based method, the results proved that a sharper inversion profile by FOCI leads to lower subtraction error in the background. In Figure 5, artifact-removed MRA can be further used in assessing whole brain vessels. T1-w, vessel wall images are not affected by this method.Conclusion
Previous dMRA in iSNAP using standard HS pulse suffers from fat-related subtraction error. To overcome this problem, we proposed adiabatic FOCI inversion pulse with iSNAP to acquire dMRA without artifacts. The significance of our study is to further facilitate the research of combining hemodynamic, especially acquired by pulsed ASL, and structural information in one sequence for studying neurovascular disease.Acknowledgements
This research is supported by grants from National Institutes of Health (R01 NS092207, R01 HL103609).References
1. Chen Z., et al. A novel sequence for simultaneous measurement of whole‐brain static and dynamic MRA, intracranial vessel wall image, and T1‐weighted structural brain MRI, Magn. Res. Med. 85(1), 316-325 (2020).
2. Ordidge R., et al. Frequency offset corrected inversion (FOCI) pulses for use in localized spectroscopy. Magn. Res. Med. 36(4), 562-566 (1996).
3. Yongbi M., et al. Perfusion imaging using FOCI RF pulses. Magn. Res. Med. 40(6), 938-943 (1998).
4. Yongbi M., et al. Multislice perfusion imaging in human brain using the C‐FOCI inversion pulse: comparison with hyperbolic secant. Magn. Res. Med. 42(6), 1098-1105 (1999).
5. Payne G., et al. Implementation and evaluation of frequency offset corrected inversion (FOCI) pulses on a clinical MR system. Magn. Res. Med. 38(5), 828-833 (1997).
6. Song H., et al. k-Space weighted image contrast (KWIC) for contrast manipulation in projection reconstruction MRI. Magn. Res. Med. 44, 825-832 (2000).
7. Kellman P., et al. Phase-sensitive inversion recovery for detecting myocardial infarction using gadolinium-delayed hyperenhancement. Magn. Res. Med. 47, 372-383 (2002).
Figures