1635
Using High Resolution MR microscopy to assess atherosclerosis in ApoE-KO mice fed diets of varying macronutrient content1Nutritional Sciences, The Pennsylvania State University, University Park, PA, United States, 2Huck Institute of the Life Science, The Pennsylvania State University, University Park, PA, United States, 3University of Lisbon, Lisbon, Portugal, 4Huck Institute of the Life Science, University Park, PA, United States, 5Biomedical Engineering, The Pennsylvania State University, University Park, PA, United States
Synopsis
A ketogenic, low carbohydrate and extremely high fat, diet has been shown to positively impact CVD risk factors. Nevertheless, its effect on atherosclerosis has not been measured. Here, we used 14T MR microscopy to assess atherosclerotic plaque volume, localization, and regional plaque burden in apoE-KO mice fed a ketogenic diet compared to those fed a high fat diet or a control diet. Results show that a ketogenic diet had a protective effect against atherosclerosis compared to a high fat diet as measured by total plaque volume and plaque burden, this effect was not specific to individual regions of the aorta.
Introduction
Cardiovascular disease (CVD) is the leading cause of death in the United States1. The main cause of CVD is atherosclerosis, an inflammatory condition in which arteries harden and narrow through the build-up of lipid rich plaques. Apolipoprotein E knockout (ApoE KO) mice are an established genetically modified model of atherosclerosis, which accumulate arterial plaques similarly to humans2. Dietary modification is an important tool in the prevention of CVD. A diet low in carbohydrate and extremely high in fat diet, also known as ketogenic diet has been shown to positively impact on CVD risk factors. Nevertheless, the effect of a ketogenic diet atherosclerosis has not been measured. In this study, we used 14T MR microscopy to assess atherosclerotic plaque volume, localization, and regional plaque burden in ApoE KO mice fed a ketogenic diet compared to those fed a high fat diet or a control diet.Methods
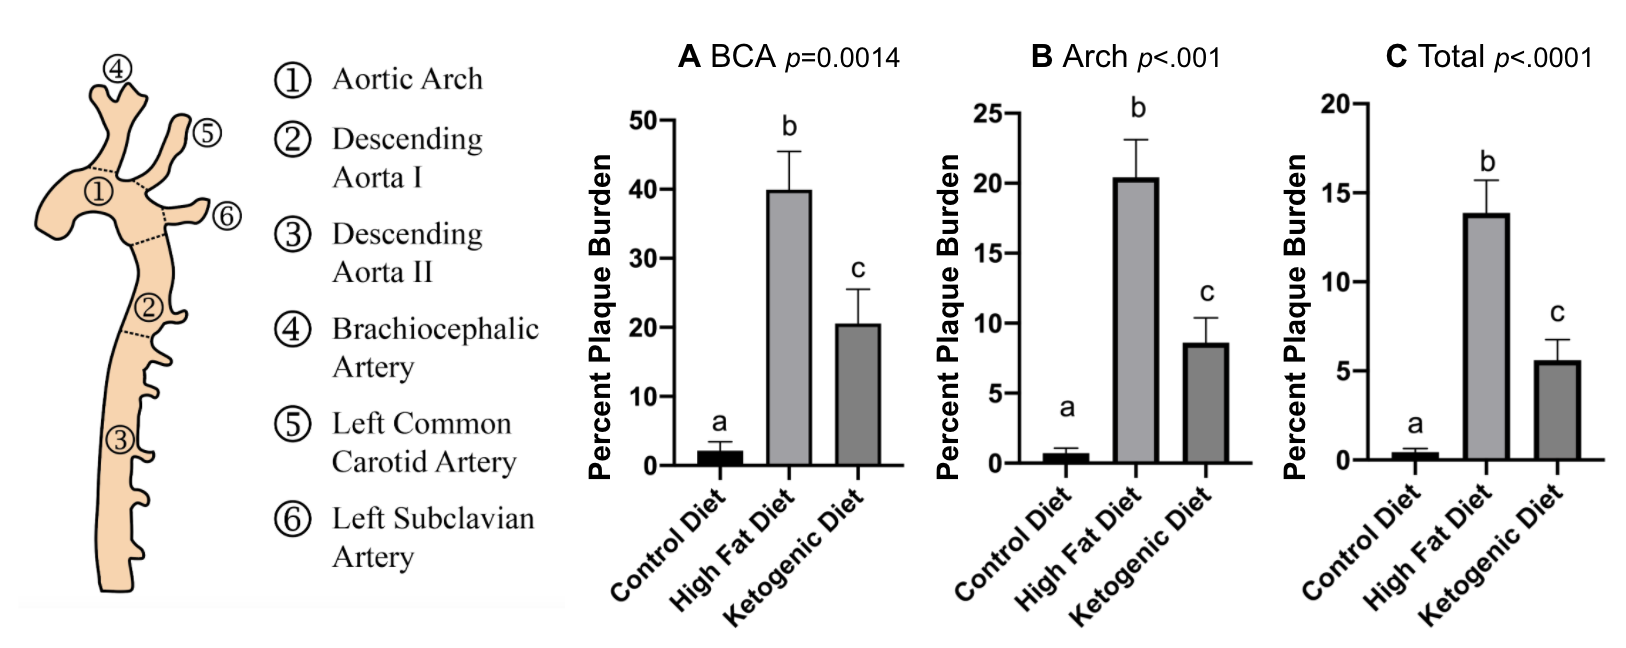
Seven-week-old male ApoE KO mice were fed ad libitum one of three diets: a Ketogenic diet (KD) (81-fat, 1-carbohydrate, 18-protein, Kcal%, n=8), a High Fat diet (HFD) (40-fat, 42-carbohydrate, 18-protein; Kcal%, n=5), or a Control diet (CD) (11-fat, 72-carbohydrate, 18-protein, Kcal%, n=4) for 12 weeks. At the endpoint, mice were euthanized, aortas were collected and perfused with 10% neutral buffered formalin (10% NBF), and fixed overnight in 10% NBF. After the removal of the surrounding tissue, aortas were washed in PBS, and transferred to a 4mm inner diameter glass tube containing PBS, 0.1% Magnevist (Bayer HealthCare, USA), and 0.25% sodium azide. The measured T1 and T2 times for the PBS solution were 369±18ms [NT1] and 260±17ms, respectively. All MRI experiments were conducted on an Agilent 14 tesla micro imaging system using a home-built saddle coil (inner diameter 7mm). Standard three-dimensional gradient echo imaging (imaging time 9h 48min) yielded an isotropic resolution of 20 microns. All data was reconstructed using Matlab (The Mathworks, Inc., Natick, MA). By zero filling the data by a factor of two a final isotropic pixel resolution of 10 microns was achieved. Data segmentation was performed using Avizo 9.5 (Thermo Fisher Scientific, USA) to quantify plaque, lumen, and wall volumes. In this way the total plaque volume and the plaque burden (plaque volume compared to total tissue volume) could be calculated. The brachiocephalic artery and the left subclavian artery were used as landmarks to identify different regions on the aorta. Statistical analyses were performed using GraphPad Prism 7 (GraphPad Software, La Jolla, CA, USA) and one-way ANOVA with multiple comparisons was used for post-hoc analysis, with statistical significance set to p< 0.05.Results
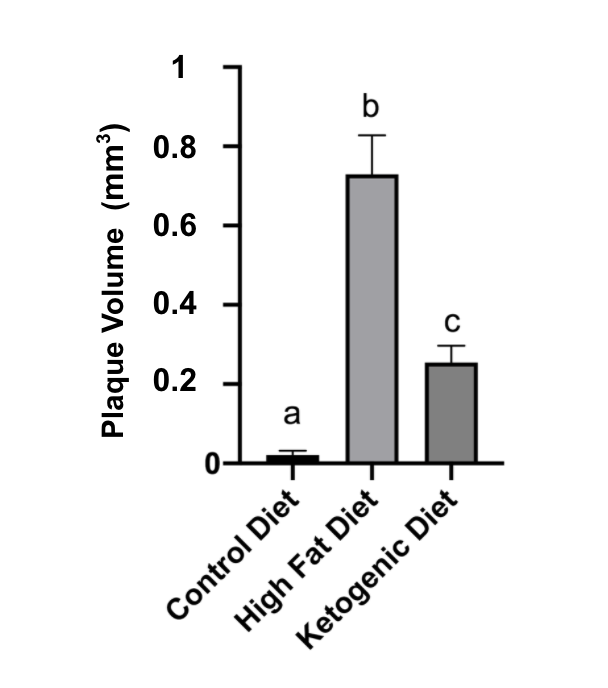
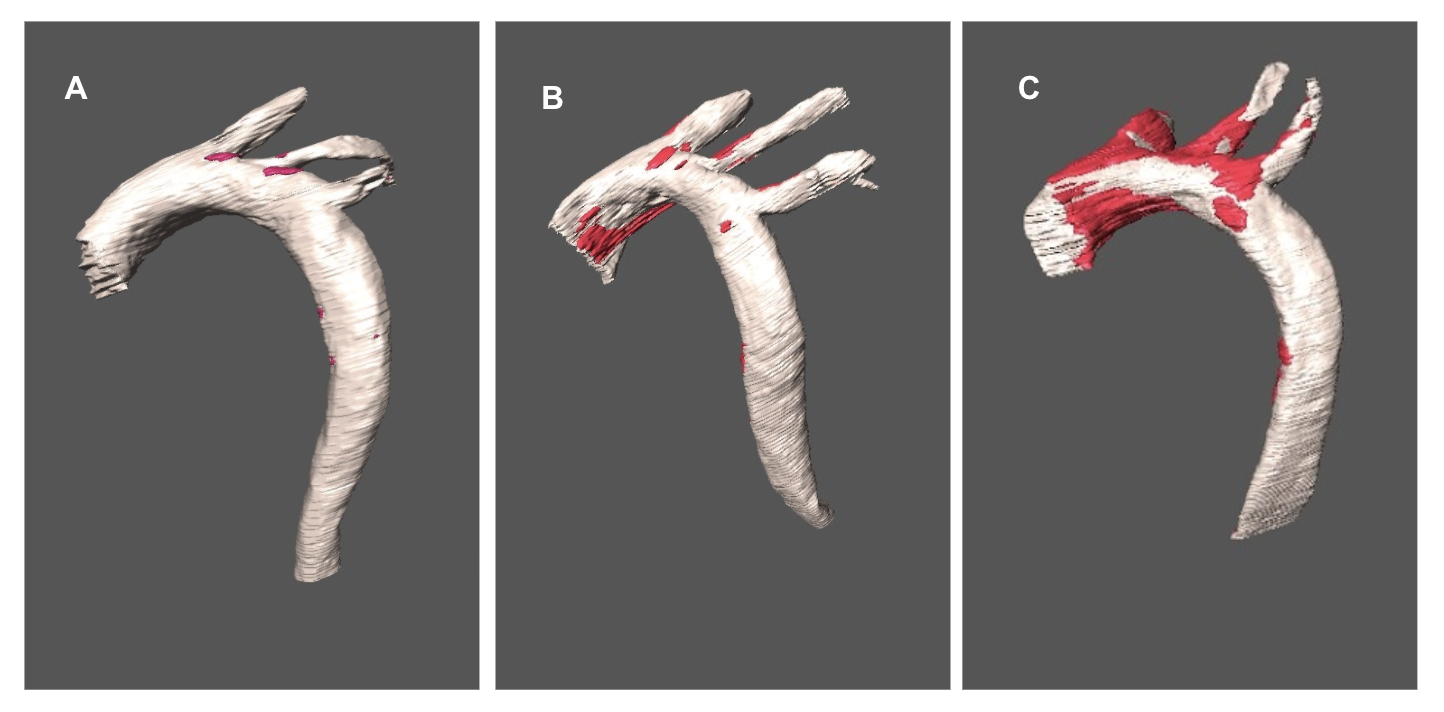
Each diet resulted in a significantly (p<0.0001) different volume of plaque accumulation; the values were (mm3) 0.02±0.02, 0.25±0.19, and 0.73 ±0.12 for animals fed CD, KD, or HFD, respectively (Figure 1). Plaque burden was calculated as a percentage of plaque volume compared to total vessel volume (wall, plaque, and lumen). Three regions of the aorta were investigated: the brachiocephalic artery (Figure 2A), the aortic arch (including the three branches (Figure 2B), and the total aorta (ascending aorta, the aortic arch including the three branches and, 400 slices of the descending aorta) (Figure 2C). Plaque burden was significantly different (p<0.01) for all aortic regions for all three diets. Mice fed the CD had the least plaque burden, followed by the KD, and the HFD (Figure 2). Reconstructions of the 3D MR microscopy data allows for observation on the effect of each diet on the volume of atherosclerotic plaque accumulated as well as on its typical localization along the aorta (Figure 3).Discussion
High resolution 3D MR microscopy is a valuable tool to analyze the extent of atherosclerosis in aortas of apoE mice fed different diets. A detailed analysis of aortic plaque volume, plaque localization, and plaque burden by region could be conducted. As shown in Figure 1, when compared to the HFD, the KD was protective against atherosclerotic plaque accumulation. Figure 2 illustrates the decrease in aortic plaque burden in mice fed the KD compared to the HFD, again demonstrating the protective vascular effect of the KD in different regions of the vessel. The representative reconstructions in Figure 3 visually demonstrate how the diet influences the volume and localization of the plaques. Mice fed the CD tend to accumulate most of their plaque in the brachiocephalic artery. In KD-fed mice plaque accumulation is most obvious in the ascending aortic arch, the brachiocephalic artery, and the left common carotid artery, with little plaque accumulation in the descending aorta. Lastly, mice fed the HFD present by far the highest amount of plaque that accumulates evenly along the ascending aortic arch, in the three arteries that exit the arch and in the descending aorta.Conclusion
High Resolution MR microscopy allowed the detailed assessment of atherosclerosis in ApoE KO mice fed with diets of varying macronutrient content. Interestingly, the KD, when compared to the HFD with a lower lipid content, was protective against atherosclerosis as measured by both total plaque volume and plaque burden. This protective effect was not specific to individual regions of the aorta.Acknowledgements
No acknowledgement found.References
1. Benjamin EJ et al. Heart Disease and Stroke Statistics-2019 Update: A Report from the American Heart Association. Circulation. 2019; 139:e56–e5282.
2.Getz GS, Reardon CA. ApoE knockout and knockin mice: the history of their contribution to the understanding of atherogenesis. J Lipid Res. 2016;57(5):758-66.
Figures