1632
Identification of Blood Flow Directions in the Circle of Willis using iSNAP dynamic MRA1Electrical and Computer Engineering, University of Washington, Seattle, WA, United States
Synopsis
Blood flow directions in vessels of the Circle of Willis (CoW) may have important implications for stroke risk. In this study, an algorithm is developed to identify the blood flow direction within vessel segments of the Circle of Willis (CoW) using the dynamic MRA component of the recently developed sequence iSNAP. The CoW of twenty-two patients were analyzed using the algorithm, and an ~85% accuracy was achieved with 3D Phase Contrast as the reference.
Introduction
The Circle of Willis (CoW) is a major component of brain collateral circulation. The variances of CoW are believed to be a potential cardiovascular risk factor and determinant of intracranial surgery outcome [1-3]. However, the current techniques to assess CoW focus on its morphological variants and lack assessment of the flow directions, which may have additional important clinical implications over the morphological features. Dynamic MRA (dMRA) makes monitoring the flowing of the contrast agent bolus within vessels possible. By tracking the bolus in dMRA, blood flow direction within vessels can be identified. In this study, an algorithm that uses signal tracking and pattern correlation was developed to estimate CoW flow directions from dMRA.Methods
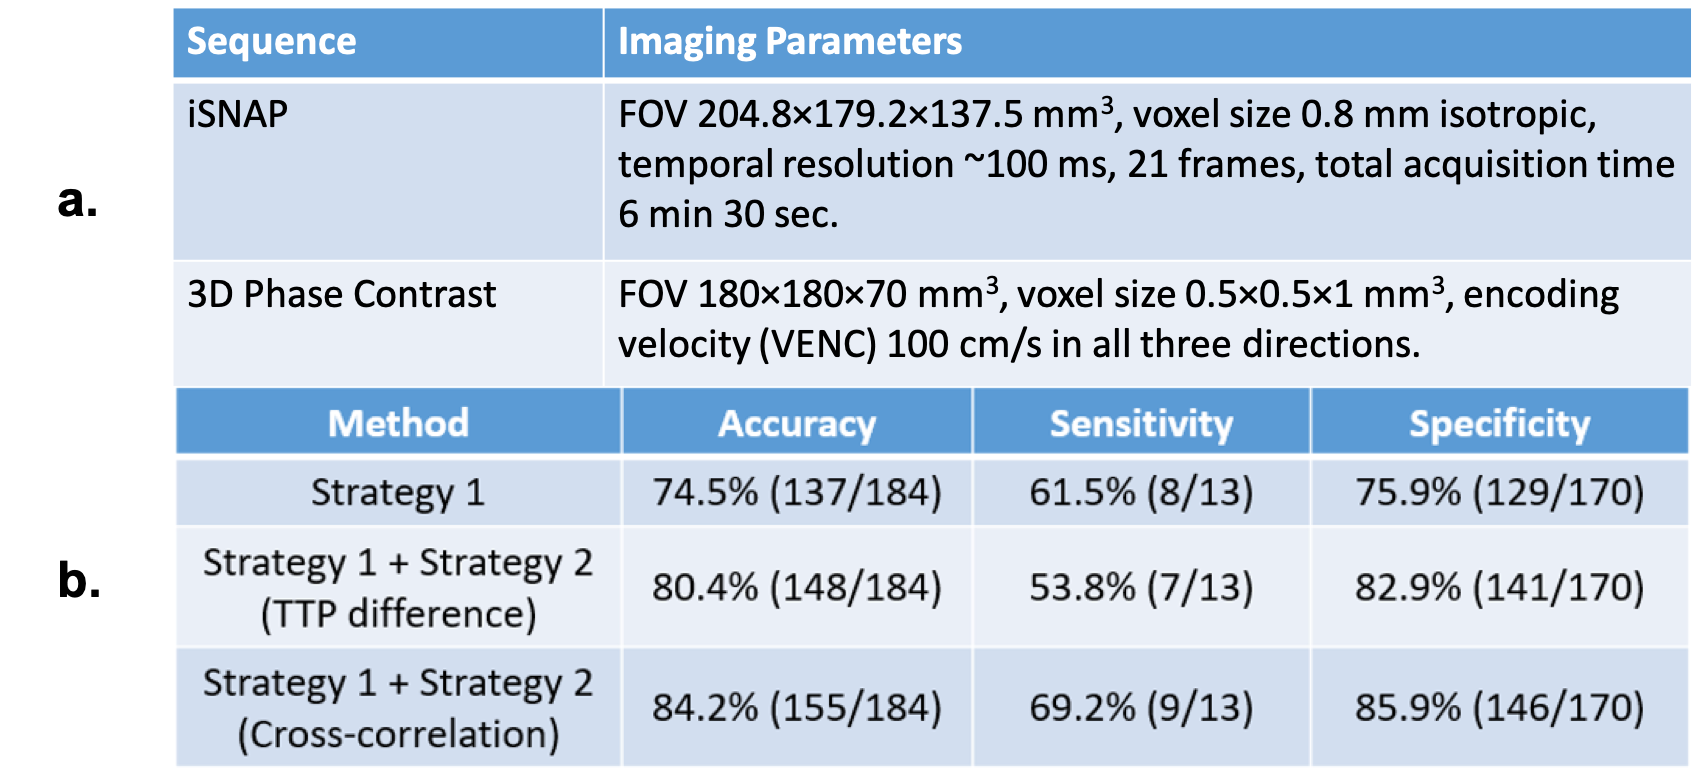
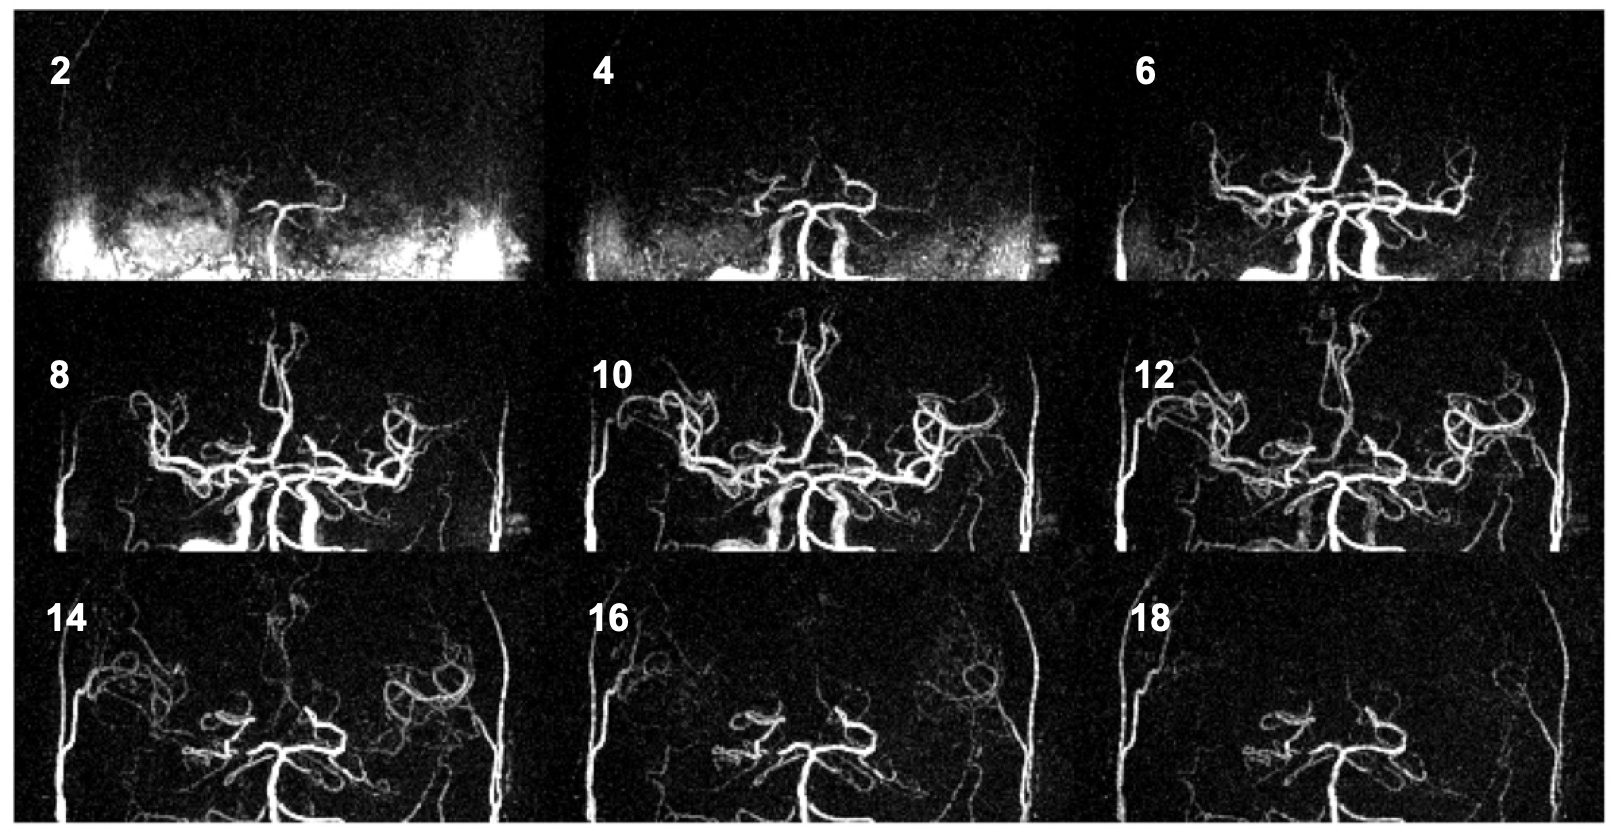
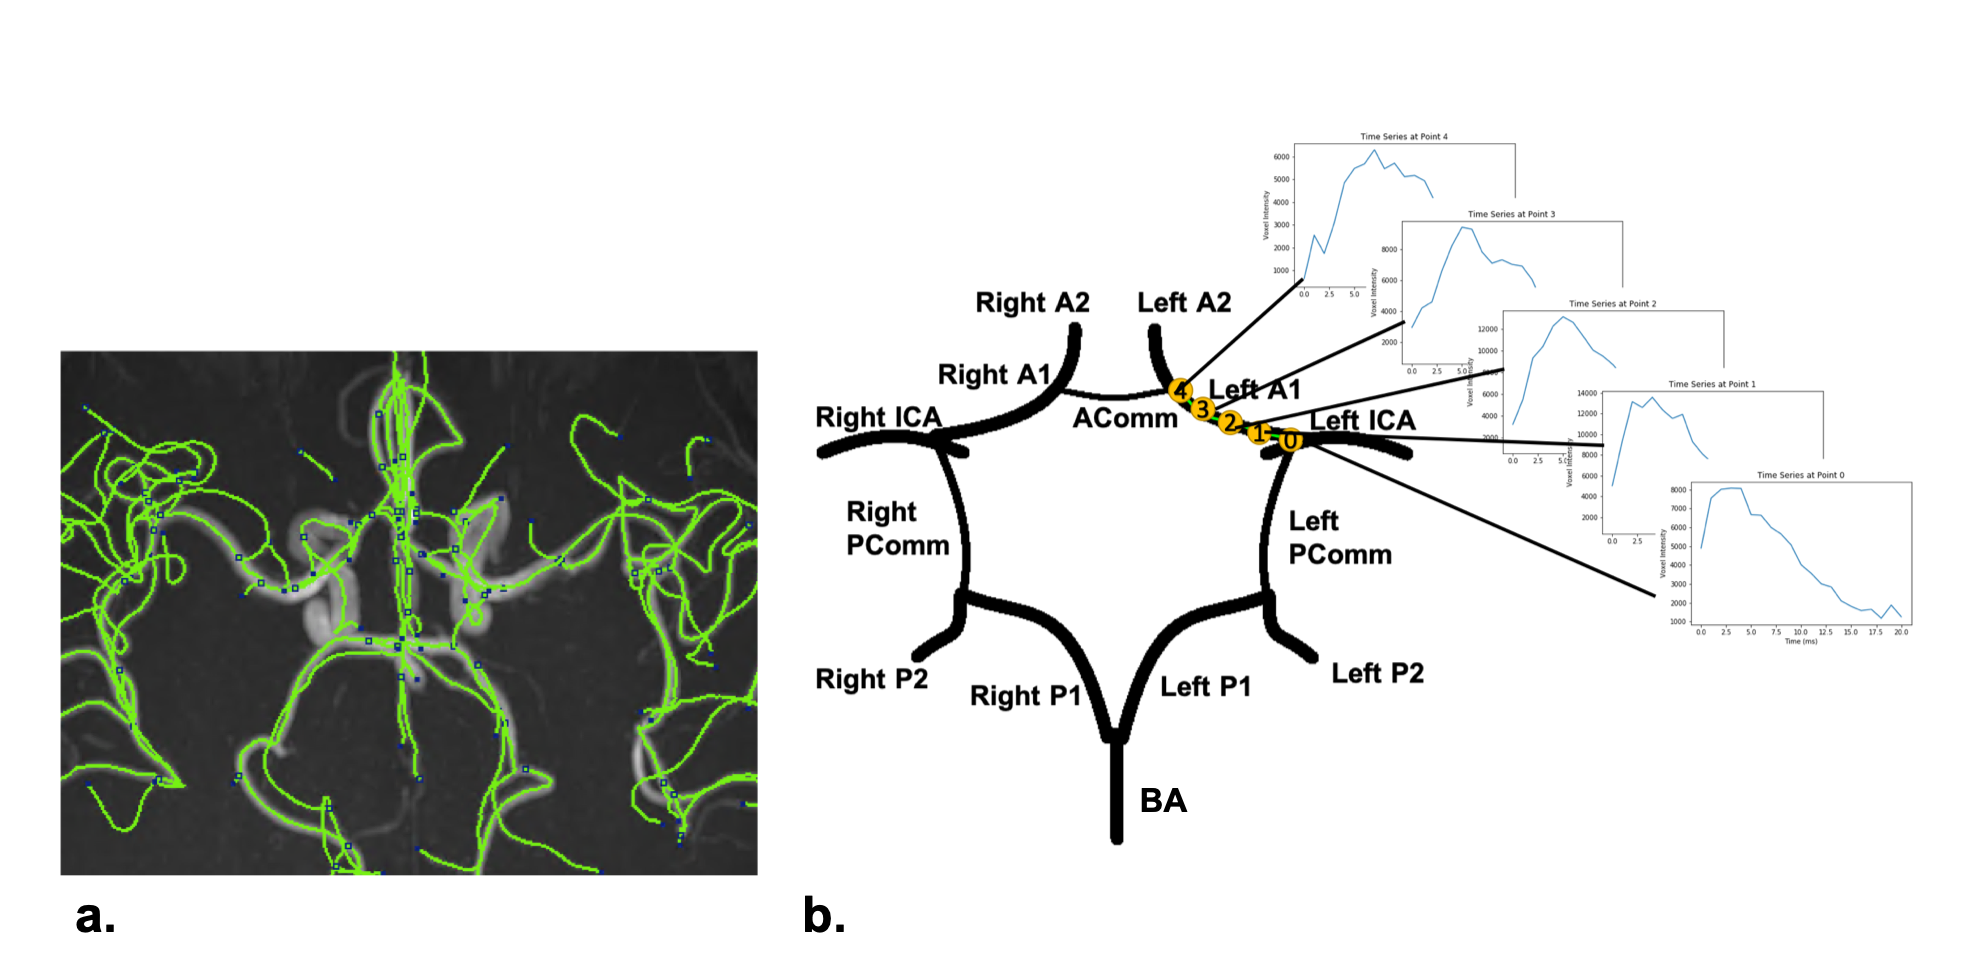
Data acquisition: After institutional review board approval and with the informed consent obtained, twenty-two patients with carotid atherosclerosis were scanned using a recently proposed sequence iSNAP [4]. iSNAP generates 4D dMRA (Figure 1) by combining arterial spin labeling (ASL) scheme and 3D golden angle radial acquisition on a Philips Ingenia CX 3T MR scanner (Philips Healthcare, Best, The Netherlands) with a 32-channel head coil. The quantitative MR flow imaging technique 3D phase contrast (PC) was performed to obtain the reference flow directions. See Table 1a for imaging parameters.Image processing: A 3D image volume (tMIP) was generated from the 4D dMRA by performing a maximum intensity projection along the temporal dimension. Next, tMIP was analyzed with a semiautomated vessel tracing software iCafe [5] to extract the centerlines of the intracranial arteries in CoW (Figure 2a). A time series of 21 samples at each location on the centerline was then extracted from dMRA (Figure 2b). Cross-sectional PC images were generated at the middle of each vessel. Vessel ROI was subsequently semi-automatically drawn, and the flow direction was determined by the average velocity vector within the ROI.
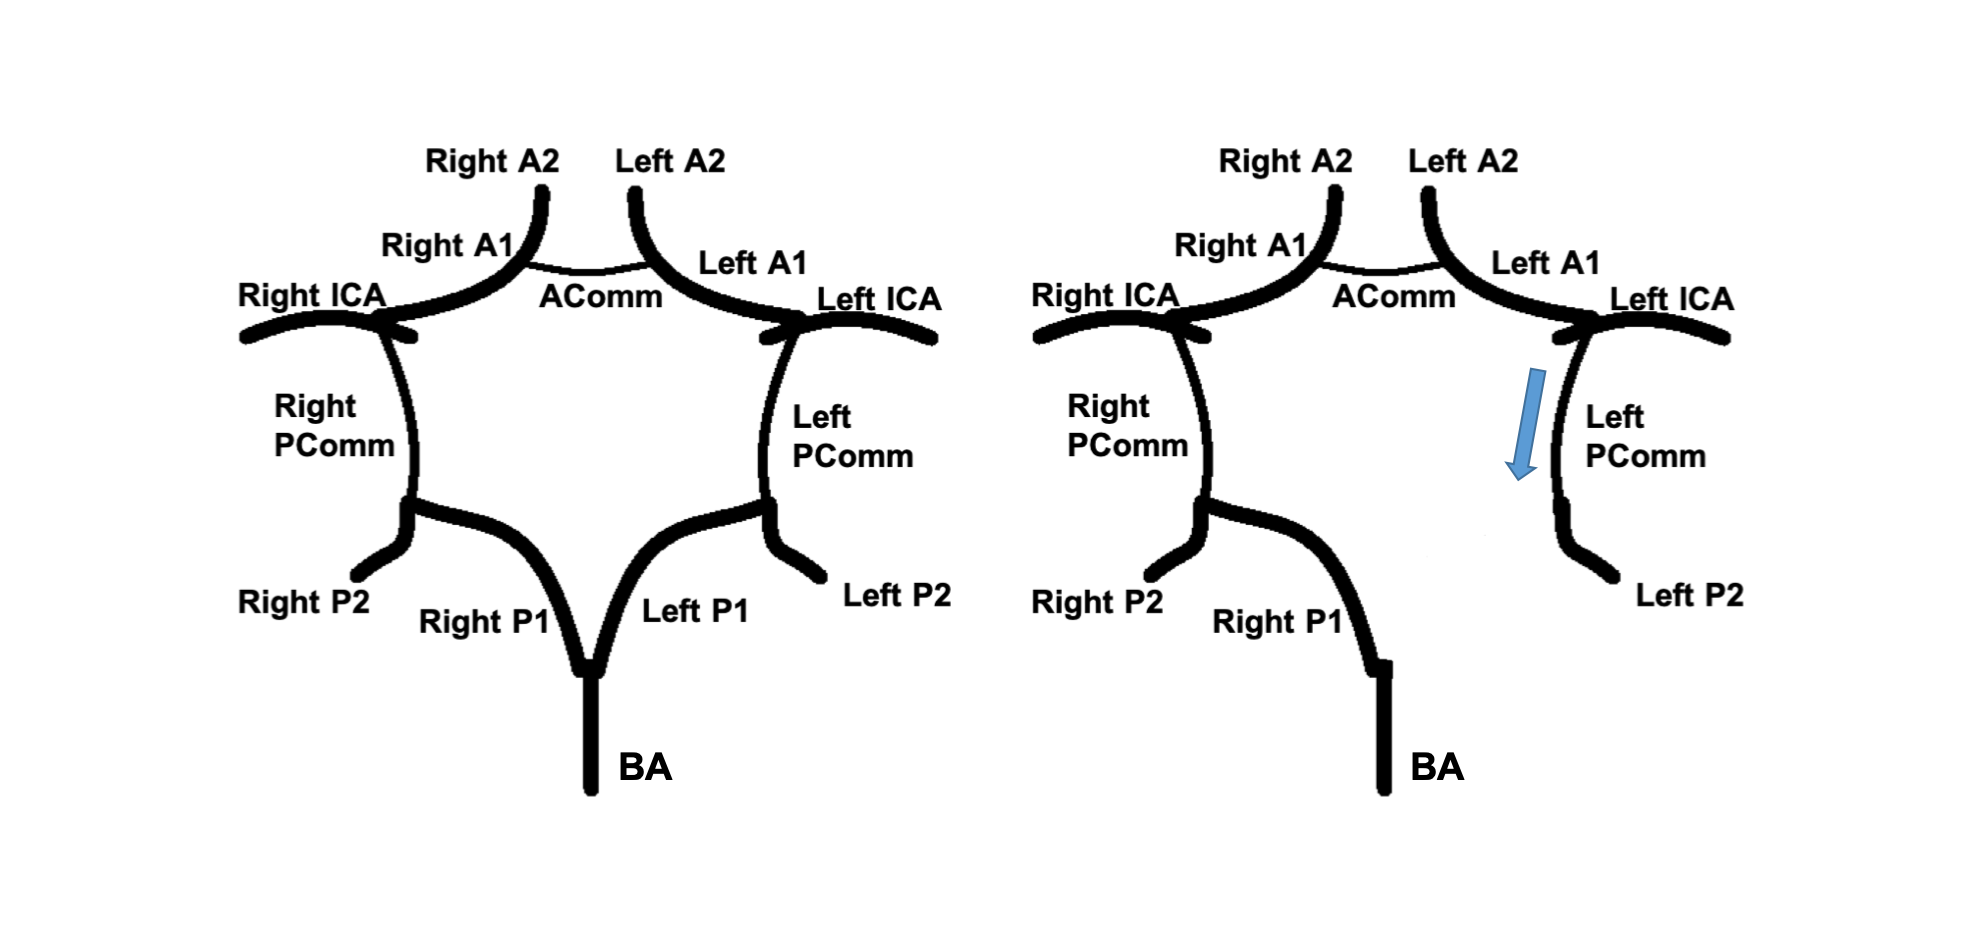
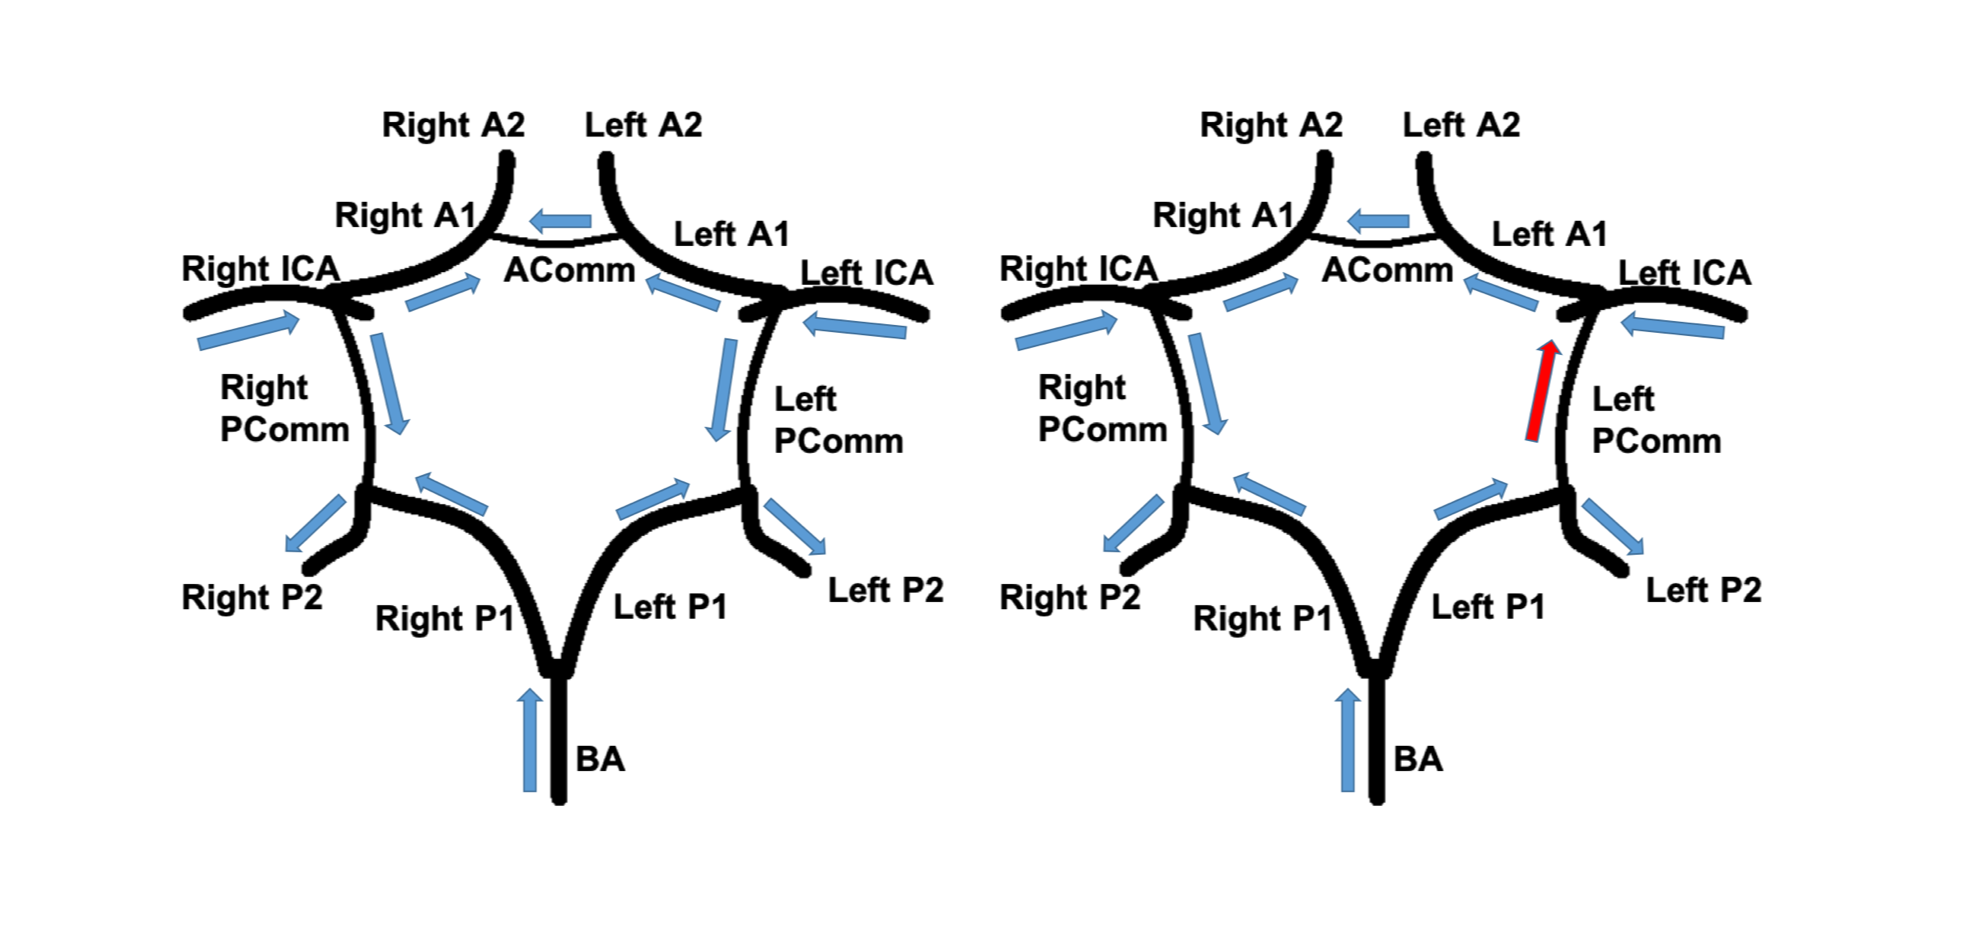
Flow direction estimation based on dMRA: Two strategies were used to determine flow direction in each vessel segment. Strategy 1 is based on information within individual vessel segments. The time-to-peak (TTP) of the time series at each centerline location is recorded. Then, correlation analysis between TTP and the location indices was performed for each individual vessel segment. The flow direction is determined by the sign of the calculated correlation coefficient. With Strategy 2, the relation between every two connected vessels was considered. The blood flow direction of certain vessel segments in the CoW can be logically determined based on CoW completeness (Figure 3), with the internal carotid arteries (ICA) and the basilar artery (BA) being the only three sources of blood into the CoW. Furthermore, arteries in the CoW, especially the communicating arteries, could have blood source from either end of those arteries. Signal similarities between the tested vessel and the two vessels connected at both ends were calculated. The connected vessel with a higher similarity was selected as the blood source for the tested vessel. To calculate the signal similarities, two features of the vessel signals were considered. First, for every tested vessel, the TTP differences between its mid-vessel signal and the mid-vessel signals of its two neighboring vessels were computed. The neighboring vessel with a smaller TTP difference has a higher signal similarity with the tested vessel. Second, for every tested signal, cross-correlation between its mid-vessel signal and the mid-vessel signals of its two neighboring vessels was performed. The vessel neighbor with a higher cross-correlation coefficient indicated a higher similarity. The final flow direction was determined by combining Strategy 1 and Strategy 2, and results from Strategy 2 were given a higher priority.
Statistics: By using the flow directions estimated from 3D PC as reference, we calculated the accuracy, sensitivity and specificity of the flow direction results generated by the proposed algorithm with iSNAP dMRA. Vessel blood flow directions opposite to predefined normal CoW flow directions were considered abnormal (Figure 4). In particular, the blood flow direction in posterior communicating arteries (PComm) is considered normal when blood goes from anterior circulation toward posterior circulation. Only ICA, BA, A1, P1, anterior communicating arteries and PComm of study subjects were included in the statistical analysis.
Results and Discussion
In total, 184 vessel segments of CoW from the 22 patients were analyzed. Three patients had complete CoW. Thirteen vessels were found to have abnormal flow directions (i.e. different from expected directions under a normal CoW condition). The accuracy, sensitivity, and specificity of the proposed algorithm are presented in Table 1b.Our preliminary results suggest that it is feasible to use iSNAP dMRA to estimate flow directions of blood vessels within CoW. The overall performance, especially the sensitivity, has room for development. A better algorithm performance can be achieved by enhancing the image quality (e.g. SNR) as well as the flow direction estimation strategies. Although conventional MR flow imaging, such as PC, can be used to assess flow directions in CoW, they are deemed time-inefficient and difficult to implement in clinical practices. The iSNAP sequence is highly time-efficient and can provide static and dynamic MRA, vessel wall imaging, and T1W structural MRI in a single scan [4]. The capability of iSNAP dMRA in flow direction estimation will further increase the functionality of iSNAP in a clinical setting.
Acknowledgements
This research is supported by grants from National Institutes of Health (R01 NS092207, R01 HL103609).References
[1] Pascalau, R., et al., The Geometry of the Circle of Willis Anatomical Variants as a Potential Cerebrovascular Risk Factor. Turk Neurosurg. 2019; 29(2):151-158.doi: 10.5137/1019-5149.JTN.21835-17.3.
[2] de Rooij, N. K., et al., Configuration of the circle of Willis, direction of flow, and shape of the aneurysm as risk factors for rupture of intracranial aneurysms. J Neurol. 2009 Jan; 256(1): 45-50. doi: 10.1007/s00415-009-0028-x.
[3] Santiago-Dieppa D. R., et al., The circle of Willis predicts the antihypertensive effects of carotid artery stenting. Neurosurg Focus. 2017 Apr; 42(4): E18.doi: 10.3171/2017.1.FOCUS16487.
[4] Chen Z., et al., A novel sequence for simultaneous measurement of whole-brain static and dynamic MRA, intracranial vessel wall image, and T1 -weighted structural brain MRI. Magn Reson Med. 2021 Jan; 85(1): 316-325. doi: 10.1002/mrm.28431.
[5] Chen L., et al., Development of a quantitative intracranial vascular features extraction tool on 3D MRA using semiautomated open-curve active contour vessel tracing. Magn Reson Med. 2018 Jun; 79(6):3229-3238. doi: 10.1002/mrm.26961.
Figures