1626
Predicting In Vivo Signal Intensity in Contrast Enhanced MRA Based on Blood Concentration of Gadolinium-Based Contrast Agents1Radiology, University of Colorado, Aurora, CO, United States, 2University Hospital of Saarland, Homburg, Germany, 3Bracco Imaging, Milan, Italy, 4University of Washington, Seattle, WA, United States
Synopsis
Recent insight into the behavior of blood R1 and R2* predicts the precise manner that signal intensity increases, plateaus, and ultimately diminishes with increasing gadolinium-based contrast agent concentration ([GBCA]). This has important implications for optimal GBCA utilization and administration in contrast enhanced MRA (CE-MRA). We validate these theoretical constructs in an in vivo pig model where time resolved CE-MRA and [GBCA] (via mass spectrometry) are acquired simultaneously, demonstrating that the theoretical relationship between [GBCA] and R1, R2* as applied to first pass CE-MRA allows for accurate predictions of CE-MRA signal intensity for any given blood concentration across three different GBCAs.
Purpose
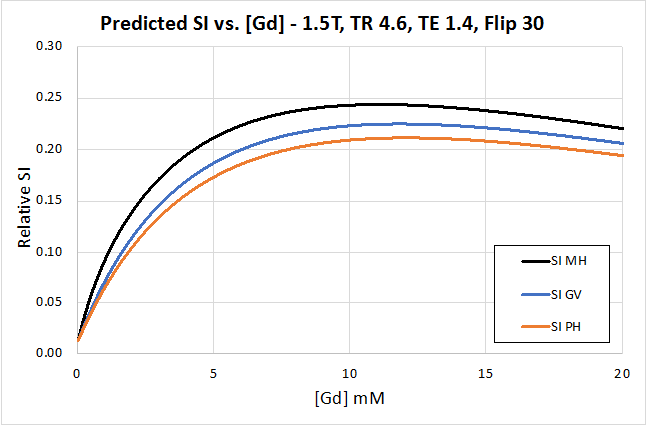
Recent in vitro work has demonstrated a sublinear relationship between gadolinium-based contrast agent blood concentration [GBCA] and R1, and a potentially impactful increase in R2* values at first-pass arterial concentrations.1,2 This is due to water exchange across the red blood cell (RBC) membrane and the effects of excluding gadolinium from ellipsoid RBCs. Thus, as [GBCA] increases, arterial signal intensity (SI) for a gradient echo sequence is expected to rise, plateau, and then diminish (Figure 1). This suggests that for contrast enhanced MR angiography (CE-MRA), increasing [GBCA] by injecting more quickly will not necessarily increase SI, but instead the faster injection rate will shorten bolus duration with resultant image blurring and degradation.3 While theoretically sound, there does not exist a validated model using these constructs whereby CE-MRA signal intensity can be accurately predicted based on in vivo [GBCA].1,2 We seek to establish such a model based on the in vivo behavior of multiple GBCAs in pigs.Methods
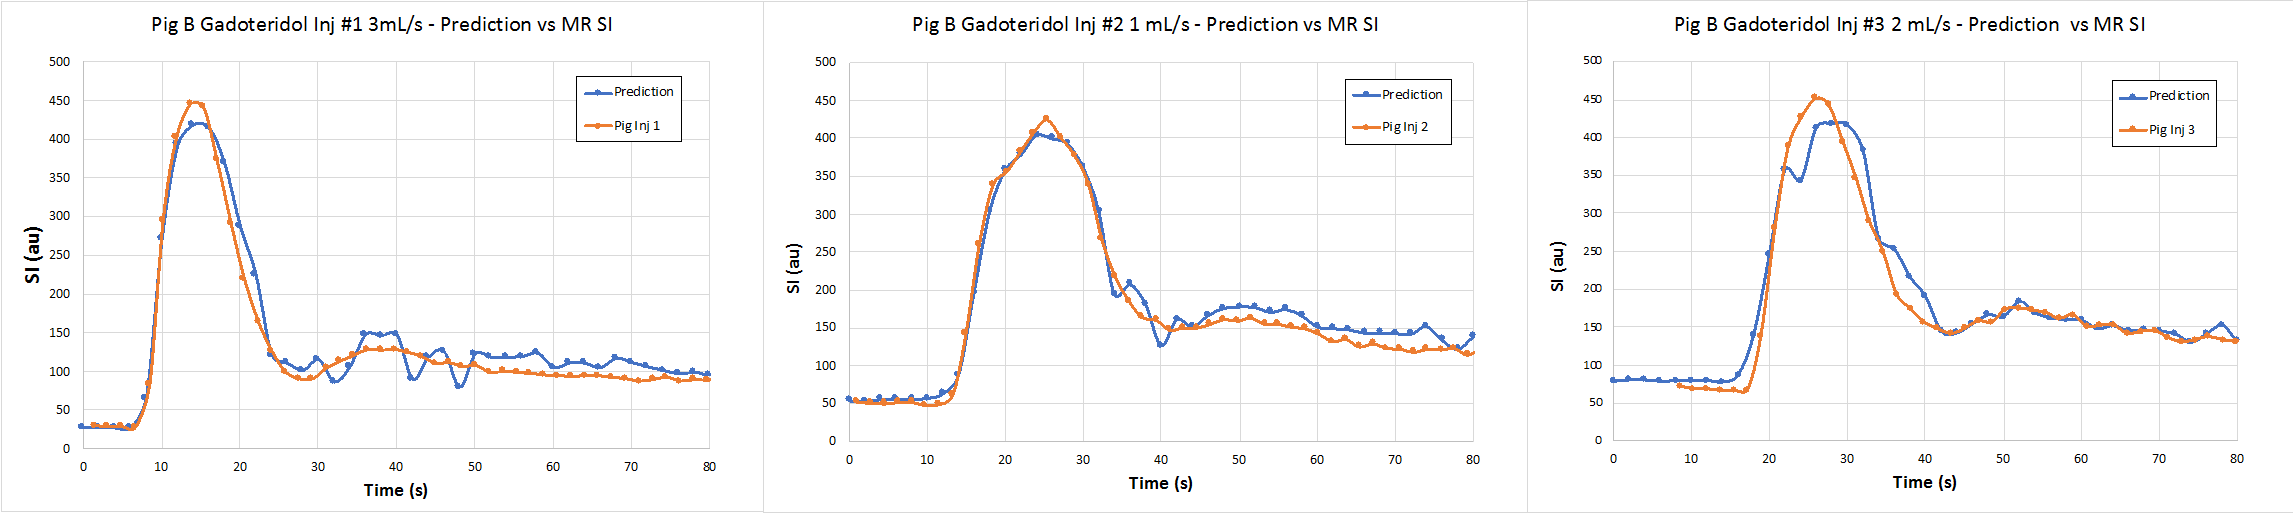
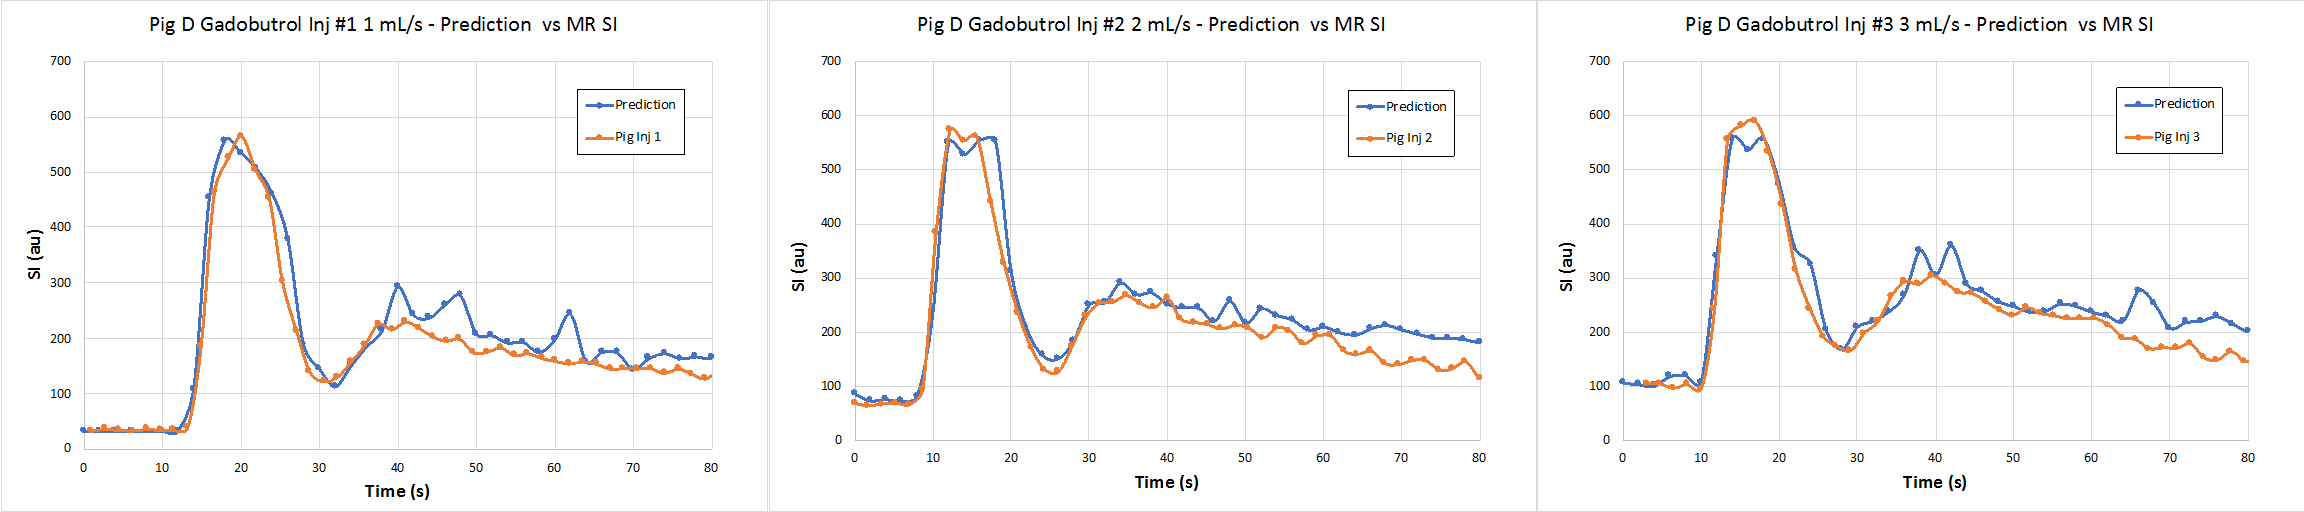
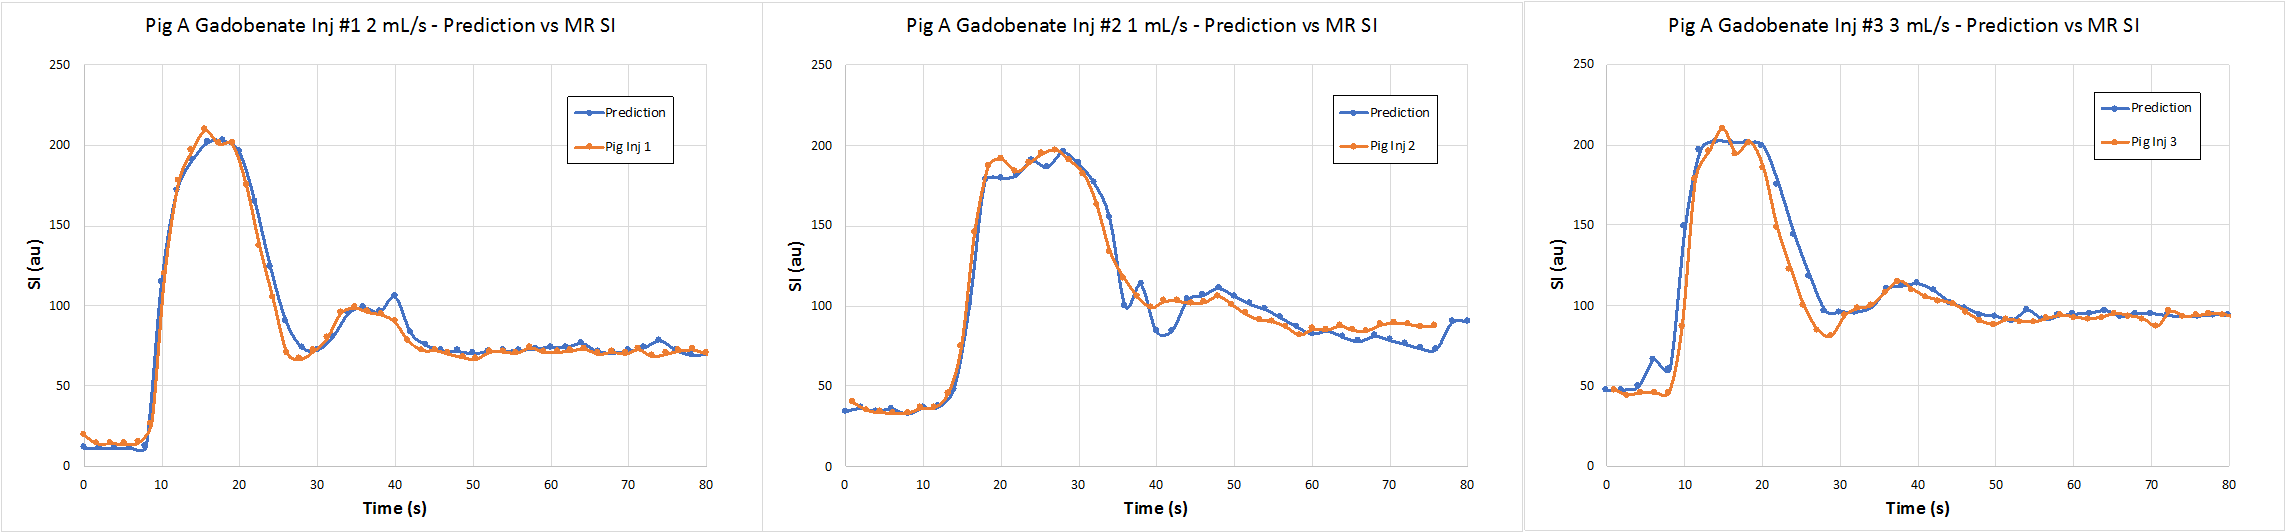
We investigated six juvenile German swine (53-63 kg). Under general anesthesia, two animals each were administered three separate 0.1 mmol/kg doses of one of three GBCAs: gadoteridol (ProHance, Bracco), gadobenate (MultiHance, Bracco), gadobutrol (Gadavist, Bayer). All injections were performed in randomized-order at varying rates (1, 2, or 3 mL/s) during time-resolved 3D SPGR imaging of the aorta (1.5T Siemens Aera, TR/TE 4.6/1.4 ms, α=30o, temp res 1.7 s). Concurrently, 0.5 mL aliquots of arterial blood were sampled every 2 seconds x 40 by aortic catheter and sent for mass spectrometry to determine [GBCA]. These data were used to predict blood SI using the SI equation for SPGR imaging:$$$\space\space\space\space\space\space\space\space$$$ [1] $$$\space\space\space\space\space\space\space\space$$$ $$$\space\space\space\space\space\space\space\space$$$ $$$SI_{SPGR}\space\alpha\frac{1-e^{-TR·R_{1}}}{1-\cos(\alpha·e^{-TR·R_{1}})}\sin(\alpha)·e^{-TE·R_{2}^{*}}$$$
where R1 is the GBCA dependent T1 relaxation rate in blood (i.e. R1blood), which can be calculated per 1 as:
$$$\space\space\space\space\space\space\space\space$$$ [2] $$$\space\space\space\space\space\space\space\space$$$ $$$\space\space\space\space\space\space\space\space$$$ $$$R_{1blood}=\frac{1}{2}[R_{1i}+R_{1p}+\frac{1}{\tau_{i}}+\frac{1}{\tau_{o}}]$$$ $$$-\frac{1}{2}\{[(R_{1i}-R_{1p})+(\frac{1}{\tau_{i}}-\frac{1}{\tau_{o}})]^{2}$$$ $$$+\frac{4}{\tau_{i}\tau_{o}}$$$ $$$\}^{\frac{1}{2}}$$$
where R1i is the fixed T1 relaxation rate inside the RBC (assumed 0.8/s at 1.5T), τ1i and τ1o represent average water residence times inside and outside the RBC, with τ1i established 5 ms, and by mass conservation $$$\tau_{1o}=\tau_{1i}(\frac{1-Hct}{Hct})$$$. R1p is the GBCA dependent T1 relaxation rate in plasma:
$$$\space\space\space\space\space\space\space\space$$$ [3] $$$\space\space\space\space\space\space\space\space$$$ $$$\space\space\space\space\space\space\space\space$$$ $$$R_{1p}=R_{1o}+r_{1f}[CR]+r_{1b}[CRM]$$$
where R1o is the T1 relaxation rate outside the RBC without GBCA (0.8/s at 1.5T), [CR] = concentration unbound GBCA and [CRM] = concentration of bound Macromolecule-GBCA. [CR] (for gadobenate) can be determined from the protein binding coefficient Kb.1 r1f and r1b are the plasma relaxivities of free and bound GBCA respectively. R2*blood is the GBCA dependent T2* relaxation rate in blood2:
$$$\space\space\space\space\space\space\space\space$$$ [4] $$$\space\space\space\space\space\space\space\space$$$ $$$\space\space\space\space\space\space\space\space$$$ $$$R_{2}$$$*$$$_{blood}=R_{2}$$$*$$$_{o}+r_{2}$$$*$$$[CR_{T}]$$$
R2*o represents the fixed T2* relaxation rate outside the RBC in the absence of GBCA (5 ms at 1.5T) and r2* is the T2* relaxivity of GBCA in blood.2 Total GBCA [CRT] = [CRM] + [CR].
Hematocrit and [albumin] were measured per pig. Relaxivities r1f, r1b, r2* and protein binding constant Kb were calculated per Wilson et al.1,2 Using these data in conjunction with [1-4], predictive modeling of SI vs. time was made for each of the 18 injections for which [GBCA] vs. time was known. Modeling was also performed neglecting R1 effects (i.e. assuming R1 behaves as if in plasma), and neglecting R1 and R2* effects (i.e. additional assumption R2* effects unimportant). Relative gain between MRA and predictive data was adjusted to each animal’s first injection baseline and held constant for the subsequent two injections. Predicted and observed SI were compared using mean absolute error (MAE), mean square error (MSE), and visual analysis.
Results
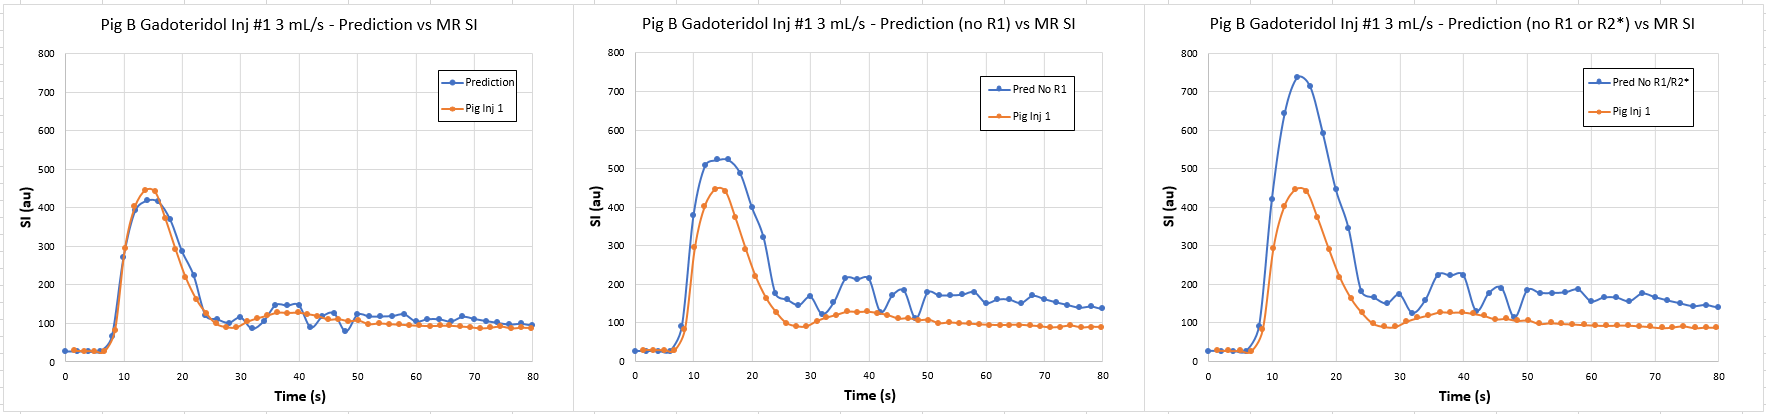
The r1f and r2* values for all agents, as well as protein binding coefficient Kb for gadobenate, were near identical to human values (gadoteridol 3.8 s-1/mM, 22 s-1/mM, n/a; gadobutrol 4.3 s-1/mM, 21 s-1/mM, n/a; gadobenate 5.1 s-1/mM, 20 s-1/mM, 1.5 mM-1 respectively). The measured r1b value for gadobenate was lower in pigs than humans (9.1 vs. 18.1 s-1/mM).Figure 1 illustrates the expected rise, plateau, and decrease in expected SI vs. [GBCA] for all three agents based on [1-4] above. Comparing predicted vs. measured SI for each across three consecutive injections for three agents revealed high correlation when fully accounting for blood R1 and R2* effects (Figures 2-4), average MAE 7.6, MSE 40. Each subsequent baseline over the three consecutive GBCA injections was well predicted with a single gain constant per animal. The models neglecting blood R1, or both R1 and R2* effects show decreased accuracy (Figure 5), with MAE and MSE increasing to average 560 and 12,765 respectively.
Discussion
The sublinear behavior of R1 and the high first-pass R2* values in blood as described by Wilson et al. are supported in an animal model, thus validating this work in vivo. If these effects are neglected, the predictive model of SI decreases in accuracy relative to the observed SI. By characterizing and understanding the effects of R1 and R2* as applied to first-pass CE-MRA, we present a method of more accurately predicting actual signal intensity for any given blood [GBCA], a critical factor to understand and optimize the relationship between blood [GBCA] and achieved signal intensity. This model can be used to improve image quality, as well as potentially reduce contrast usage and cost.Acknowledgements
No acknowledgement found.References
1. Wilson GJ, Woods M, Springer CS et al. Magn Reson Med 2014;72:1746–54.
2. Wilson GJ, Springer CS Jr, Bastawrous S, Maki JH. Magn Reson Med 2016;77:2015–27.
3. Clark TJ, Wilson GJ, Maki JH. Magn Reson Med 2016;78:357–69.
Figures