1624
Clinical Ultra-High Field Protocol for Visualization and Quantification of Lesion Components in Peripheral Artery Disease1DeBakey Heart & Vascular Center, Houston Methodist Hospital, Houston, TX, United States, 2Translational Imaging Center, Houston Methodist Research Institute, Houston, TX, United States
Synopsis
Peripheral arterial disease (PAD) has been estimated to reduce quality of life in approximately 2 million symptomatic Americans, with millions more expected to suffer PAD-associated impairment. Anatomic characteristics of PAD lesions influence clinical outcomes, including the success and durability of endovascular treatments. Current clinical imaging modalities CTA, fluoroscopy and ultrasound do not depict plaque characterization to the extent of MRI. In this abstract we show how clinical ultra-high field protocol can be used for visualization and quantification of lesion components in peripheral artery disease.
Peripheral arterial disease (PAD) is a prevalent condition in the elderly and is associated with high morbidity and mortality. PAD is also one of the most challenging vascular conditions to treat2. Anatomic characteristics of PAD lesions influence clinical outcomes, including the success and durability of endovascular treatments3. Current clinical imaging modalities are limited to CTA, fluoroscopy, and ultrasound and are limited in their scope of understanding the lesions and their composition. 3-4 MRI offers many advantages for PAD imaging. It is non-invasive, does not require exogenous contrast agents, and has no associated radiation. Until now, the poor calcium sensitivity of MRI has been a major barrier to the clinical adoption of MRI for PAD applications. However, with recent advances in ultrashort echo time (UTE) MRI, calcium can now be characterized by high diagnostic accuracy5-8. This technique may even have better accuracy in heavily calcified vessels in comparison to conventional imaging modalities including duplex ultrasound (which suffers from acoustic shadowing), or CTA (which may suffer from calcium blooming). In addition, we have shown that high-resolution ex-vivo UTE imaging can also identify PAD lesions with hard collagen1,5. These lesions required higher guidewire puncture forces and are at higher risk of endovascular failure. Identifying these lesions in-vivo pre-operatively may help with patient selection and planning endovascular procedures. The goal of this study was to develop a clinically feasible MRI method to help physicians plan endovascular peripheral arterial procedures. Our previous work on PAD lesion characterization techniques showed excellent correlation with histology, microCT and guidewire puncture force testing. 1 However, these scans were performed on ex-vivo specimens using a 7T MRI scanner, and specimens were scanned with very long acquisition times at high resolution. In this study, we sought to determine the feasibility of translating these ex-vivo MRI techniques into in-vivo methods on a clinical 7T MRI. We hypothesized that clinical 7T MRI scanners using T1-weighted, T2 weighted and Ultrashort Echo time could characterize popliteal and tibial PAD lesions in vivo.
Methods
Seven patients and one cadaver with CLI underwent amputation, (1 below-knee amputation and 6 above the knee amputations). Proof-of-concept images in a healthy volunteer were acquired as well using the same MRI protocol as for the amputated limbs. All images were acquired at the FDA-approved clinical 7T MAGNETOM Terra MRI scanner (Siemens Healthineers, Erlangen, Germany) with the 1Tx28Rx clinical knee coil. The duration of MRI examination was less than one hour which is considered tolerable in a clinical setting. The MRI protocol consisted of the following sequences: UTE (FOV: 150 mm, phase FOV 100 %, in-plane resolution 0.2x0.2 mm, slice thickness: 0.22 mm, TR 10 ms, TE 0.07 ms, FA 4, fat saturation, matrix 688x688x688, radial views 60,000, advanced shimming), T1-weighted (flash, FOV 160 mm, phase FOV 87.6 %, in-plane resolution 0.2x0.2 mm, slice thickness 0.2 mm, TR 9.5 ms, TE 4.09 ms, FA 7, GRAPPA 2, phase encode direction A>>P, 512 slices, water excitation), and T2-weighted (dess, FOV 160 mm, phase FOV 87.5 %, slice thickness 0.2 mm, TR 12.57 ms, TE 6 ms, FA 25, water excitation, 512 slices, GRAPPA 3). Lesions were harvested (popliteal artery in 4 patients, peroneal in 1, and the trifurcation and TP trunk in the remaining subject) and were segmented into 1 cm samples stored in formalin. MicroMRI (9.4 T Bruker Advance 400, UTE 3D, 70 um isotropic ) and micro CT (40um) images were acquired to identify calcified lesion components and for direct comparison with the near in-vivo 7T images. To illustrate the power of the 7T to differentiate lesion components, a pseudo-color composite (red: T1-weighted, green: T2-weighted, and blue: UTE) was created using ImageJ after images were registered to each other with the 3D Slicer software.
Results
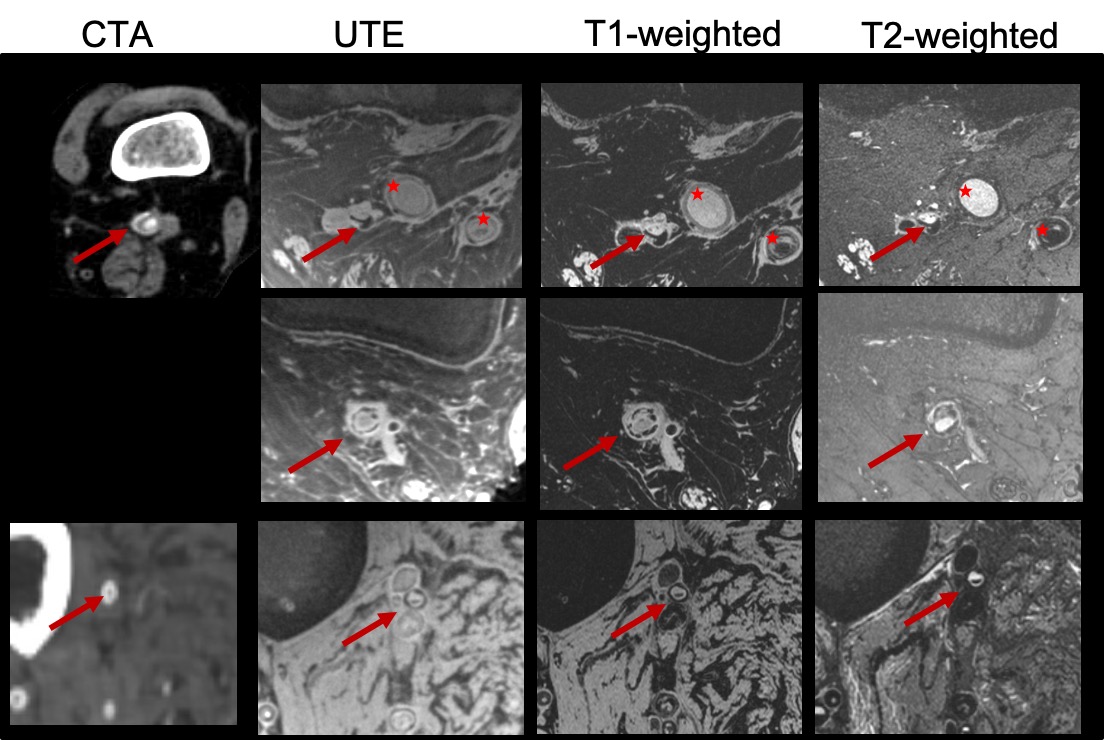
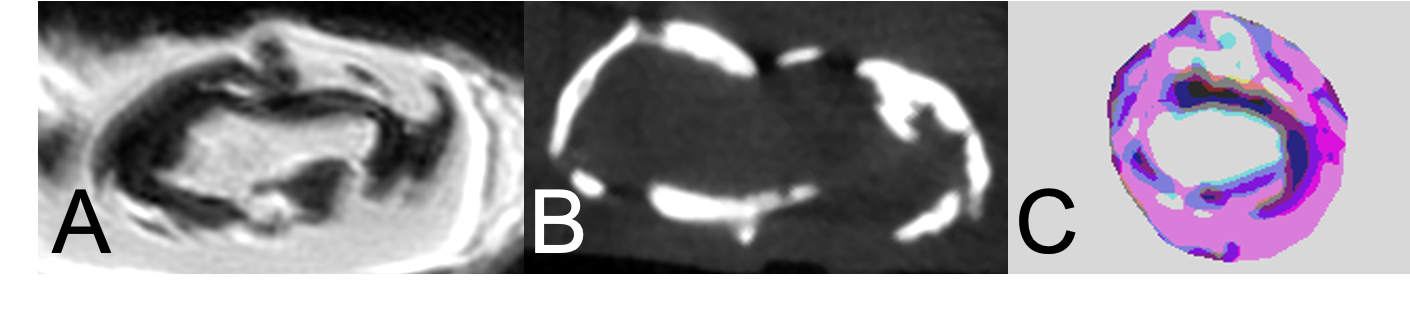
In all subjects, 7T MRI yielded artifact-free, high-resolution images of superior contrast of the PAD lesions of interest with much-improved differentiation power the corresponding CTA (figure 1). Calcified components could readily be appreciated in the UTE images as confirmed by microCT (figure 2). Comparison with the T1-weighted images allowed identifying collagen-rich regions compared to solid calcification. While of higher spatial resolution, micro MRI images yielded marginal improvement compared to the near-in-vivo acquired images (figure 2). The pseudo-color images created an enhanced contrast between lesion components towards the development of a quantification method.
Discussion
A clinical MRI protocol was established on the ultra-high-field clinical 7T scanner for visualization and quantification of PAD lesion components. Ex-vivo imaging (micro MRI and microCT) supported findings and the initial impression of the 7T images.
Conclusion
Clinical 7T MRI using T1W, T2W, and UTE imaging can be used to characterize popliteal and tibial peripheral artery lesions. Future work will determine if this method can be used to predict success in peripheral endovascular interventions.
Acknowledgements
No acknowledgement found.References
1. Roy T, Liu G, Shaikh N, Dueck AD, Wright GA. Puncturing Plaques. J Endovasc Ther. 2017 Feb;24(1):35-46. doi: 10.1177/1526602816671135. Epub 2016 Sep 25. PMID: 27659155.
2. Jessica P S, Schanzer A. Lower Extremity Arterial Disease: Decision Making and Medical Treatment. In: Cronenwett JL, Johnston KW, eds. Rutherford’s Vascular Surgery. 8th ed. Elsevier; 2014:1675-1700. doi:10.1016/B978-1-4160-5223-4.00104-9.
3. Stoner MC, Calligaro KD, Chaer RA, et al. Reporting standards of the Society for Vascular Surgery for endovascular treatment of chronic lower extremity peripheral artery disease. J Vasc Surg. 2016;64(1):e1-e21. doi:10.1016/j.jvs.2016.03.420.
4. Roy T, Dueck AD, Wright GA. Peripheral Endovascular Interventions in the Era of Precision Medicine : Tying Wire , Drug , and Device Selection to Plaque Morphology. 2016. doi:10.1177/1526602816653221.
5. Gerhard-herman MD, Member WC, Gornik HL, et al. 2016 AHA/ACC Guideline on the Management of Patients With Lower Extremity Peripheral Artery Disease. J Am Coll Cardiol. 2016. doi:10.1016/j.jacc.2016.11.007.
6. Roy T, Liu G, Shaikh N, Dueck AD, Wright GA. Puncturing Plaques : Relating MRI Characteristics of Peripheral Artery Lesions to Guidewire Puncture Forces. J Endovasc Ther. doi:10.1177/1526602816671135.
7. Karolyi M, Seifarth H, Liew G, et al. Classification of coronary atherosclerotic plaques ex vivo with T1, T2, and ultrashort echo time CMR. JACC Cardiovasc Imaging. 2013;6(4):466-474. doi:10.1016/j.jcmg.2012.09.015.
8. Edelman RR, Flanagan O, Grodzki D, Giri S, Gupta N, Koktzoglou I. Projection MR imaging of peripheral arterial calcifications. Magn Reson Med. 2015;73(5):1939-1945. doi:10.1002/mrm.25320.
Figures