1598
Signal-to-noise of thermal versus hyperpolarized MRI as a function of field strength and receive coil temperature1University and ETH Zurich, Institute for Biomedical Engineering, Zurich, Switzerland
Synopsis
In this work SNR of thermal and hyperpolarized MRI is simulated based on first principles. It is demonstrated that detection of hyperpolarized nuclei is more favourable at lower field strengths (e.g. 0.75T) where prolonged T2* values and reduced readout bandwidth lead to higher SNR compared to standard clinical field strengths. Moreover, SNR benefits of receive coil cooling are experimentally studied on a clinical 3T Philips Achieva scanner that has been ramped down to a field strength of 0.75T.
Introduction
For simulation purposes, signal-to-noise ratio (SNR) as a function field strength and temperature is calculated according to 1$$SNR = \frac{\omega_0 [M_0\eta V_s][(B_1)_{xy}]}{\sqrt{4k_B (T_{coil} R_{coil} + T_{sample} R_{sample}) BW}}$$
where $$$M_0$$$ denotes net magnetization, $$$V_s$$$ sample volumes, $$$\eta$$$ filling factor, $$$(B_1)_{xy}$$$ RF field component perpendicular to the static field, $$$BW$$$ bandwidth, $$$T$$$ temperature and $$$R$$$ resistance.
Methods
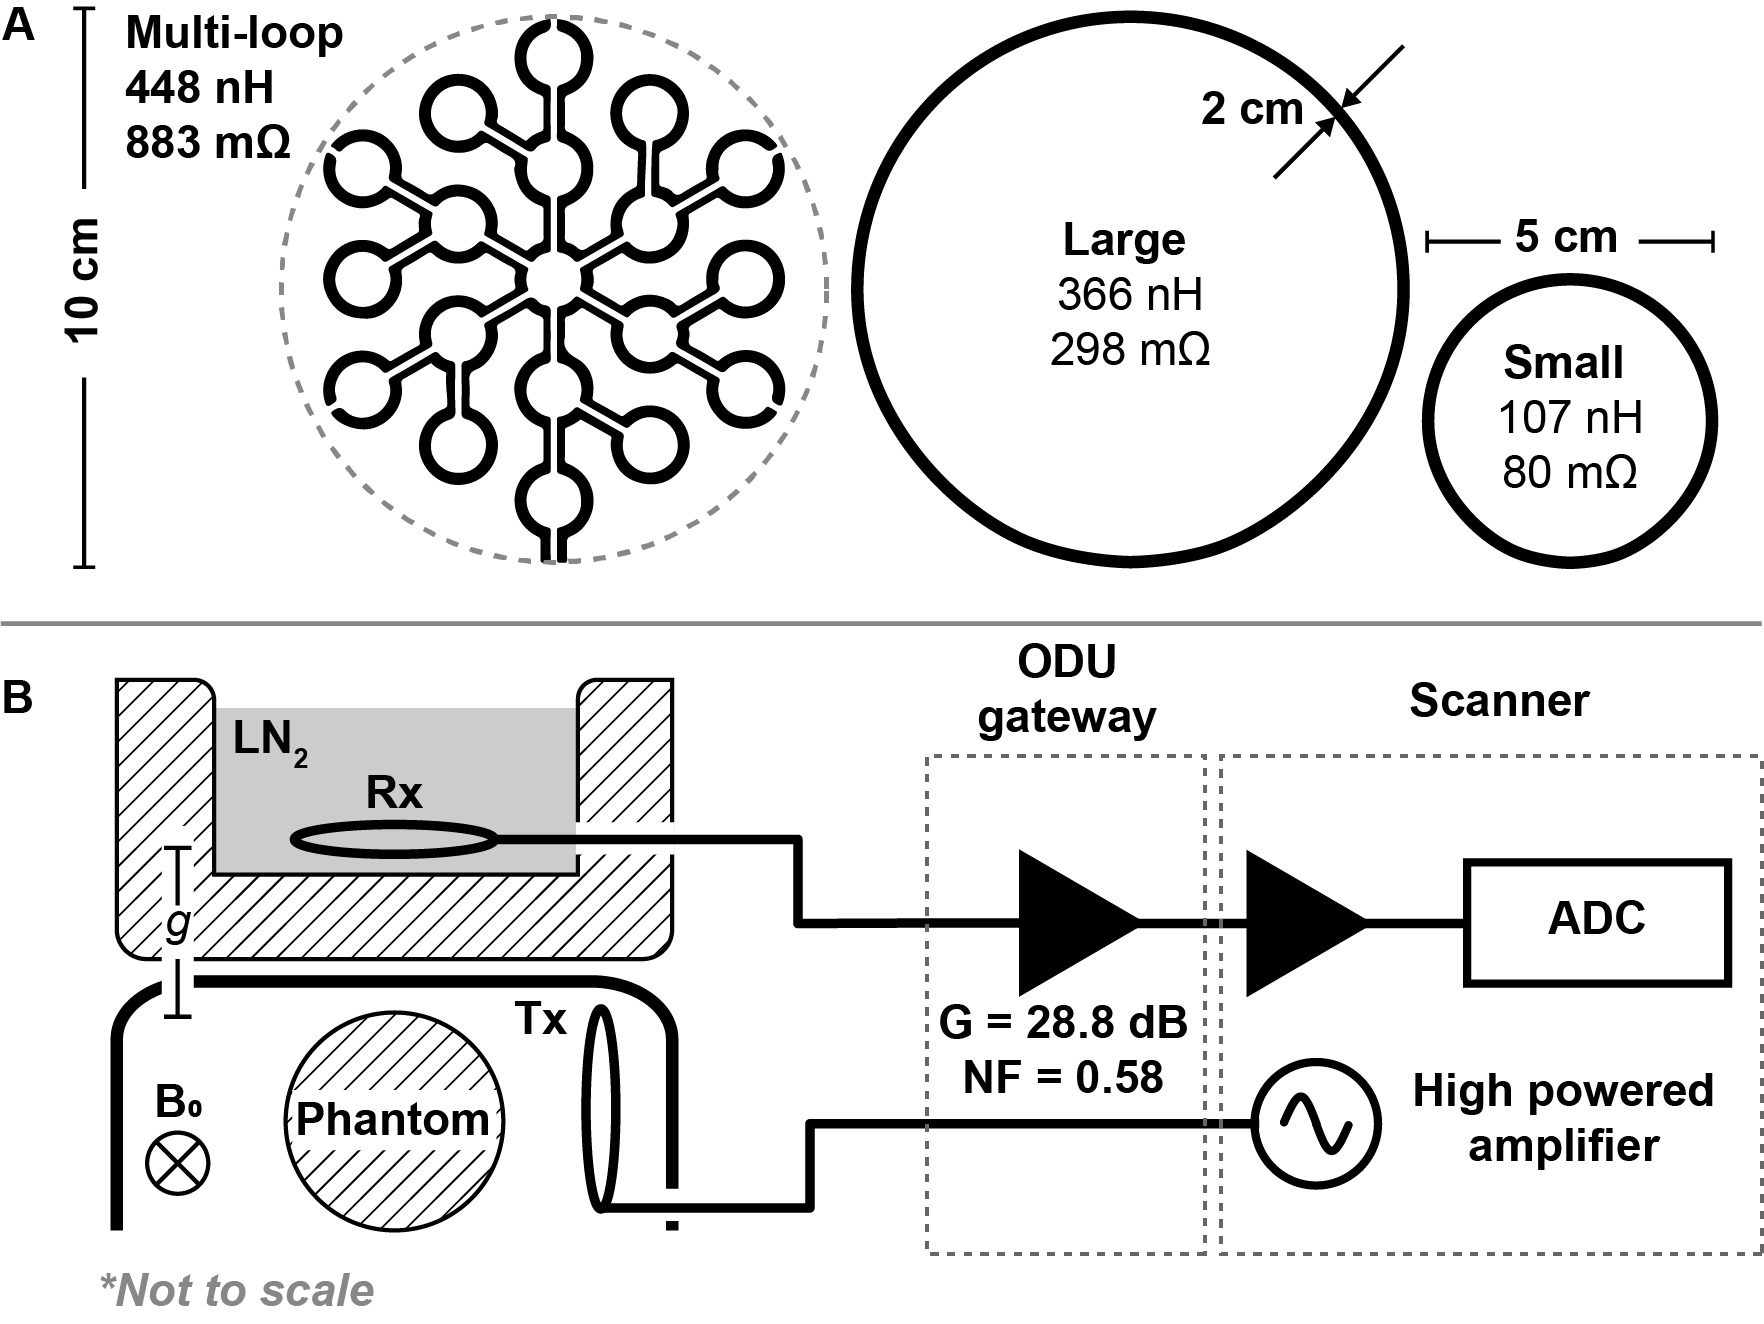
The investigation consists of two parts - a numerical simulation, followed by experimental verification. The simulation approximates all 'signal' and 'noise' contributing terms based on first principles while accommodating user-defined coil geometries and read-out bandwidths. The simulation computes SNR as a function of static magnetic field (0.1 to 9.4 T) for thermal and hyperpolarized MRI using a $$$\oslash$$$10 cm loop coil ($$$\oslash$$$ 2 mm wire thickness). Furthermore, potential SNR gains from coil cooling are investigated for both coil and sample dominant noise regimes. Sample properties are taken from 2 (muscle tissue selected for simulation purposes). Sample resistance is calculated following the definition from 3,4, which assumes an infinite homogeneous half space. Incorporated are $$$T_1$$$ values fitted from 5, while $$$T_2$$$ values are fit linearly. $$$T_2^*$$$ is calculated as $$T_2^*=\frac{1}{\frac{1}{T_2}+\frac{\gamma}{2\pi}\delta{}B_0}$$where $$$\delta B_0$$$ is static field inhomogeneity. For experimental verification, two receive loop coils were constructed with diameters of 5 and 10 cm, respectively. For excitation, a $$$\oslash$$$ 5 cm transmit coil was prepared. All coils were made from 2 mm copper tubing and tuned to 32 MHz 6 using high-Q ceramic capacitors. A printed multi-loop receive coil 7 with an overall diameter of 10 cm was fabricated to compare with the loop coil of similar size. Both coils have comparable B1 sensitivities but considerably different impedances. Proton MR spectroscopy was performed on a clinical 3T MRI scanner (Achieva, Philips Healthcare) ramped down to 0.75 T. Figure 1 illustrates the experimental setup in further detail. Two 1L cylindrical phantoms were filled with mineral oil and CuSO4 solution. The acquisition bandwidth was set to 131 kHz to ensure greater dynamic range utilisation in the receiver quantitizer. Proton signal was recorded upon small-flip angle excitation ($$$<1^\circ$$$). Thereafter 'noise' signal was acquired. All experiments were conducted once with the receiving coil at 293 K and again at 77 K by way of LN2 cooling.Results and Discussion
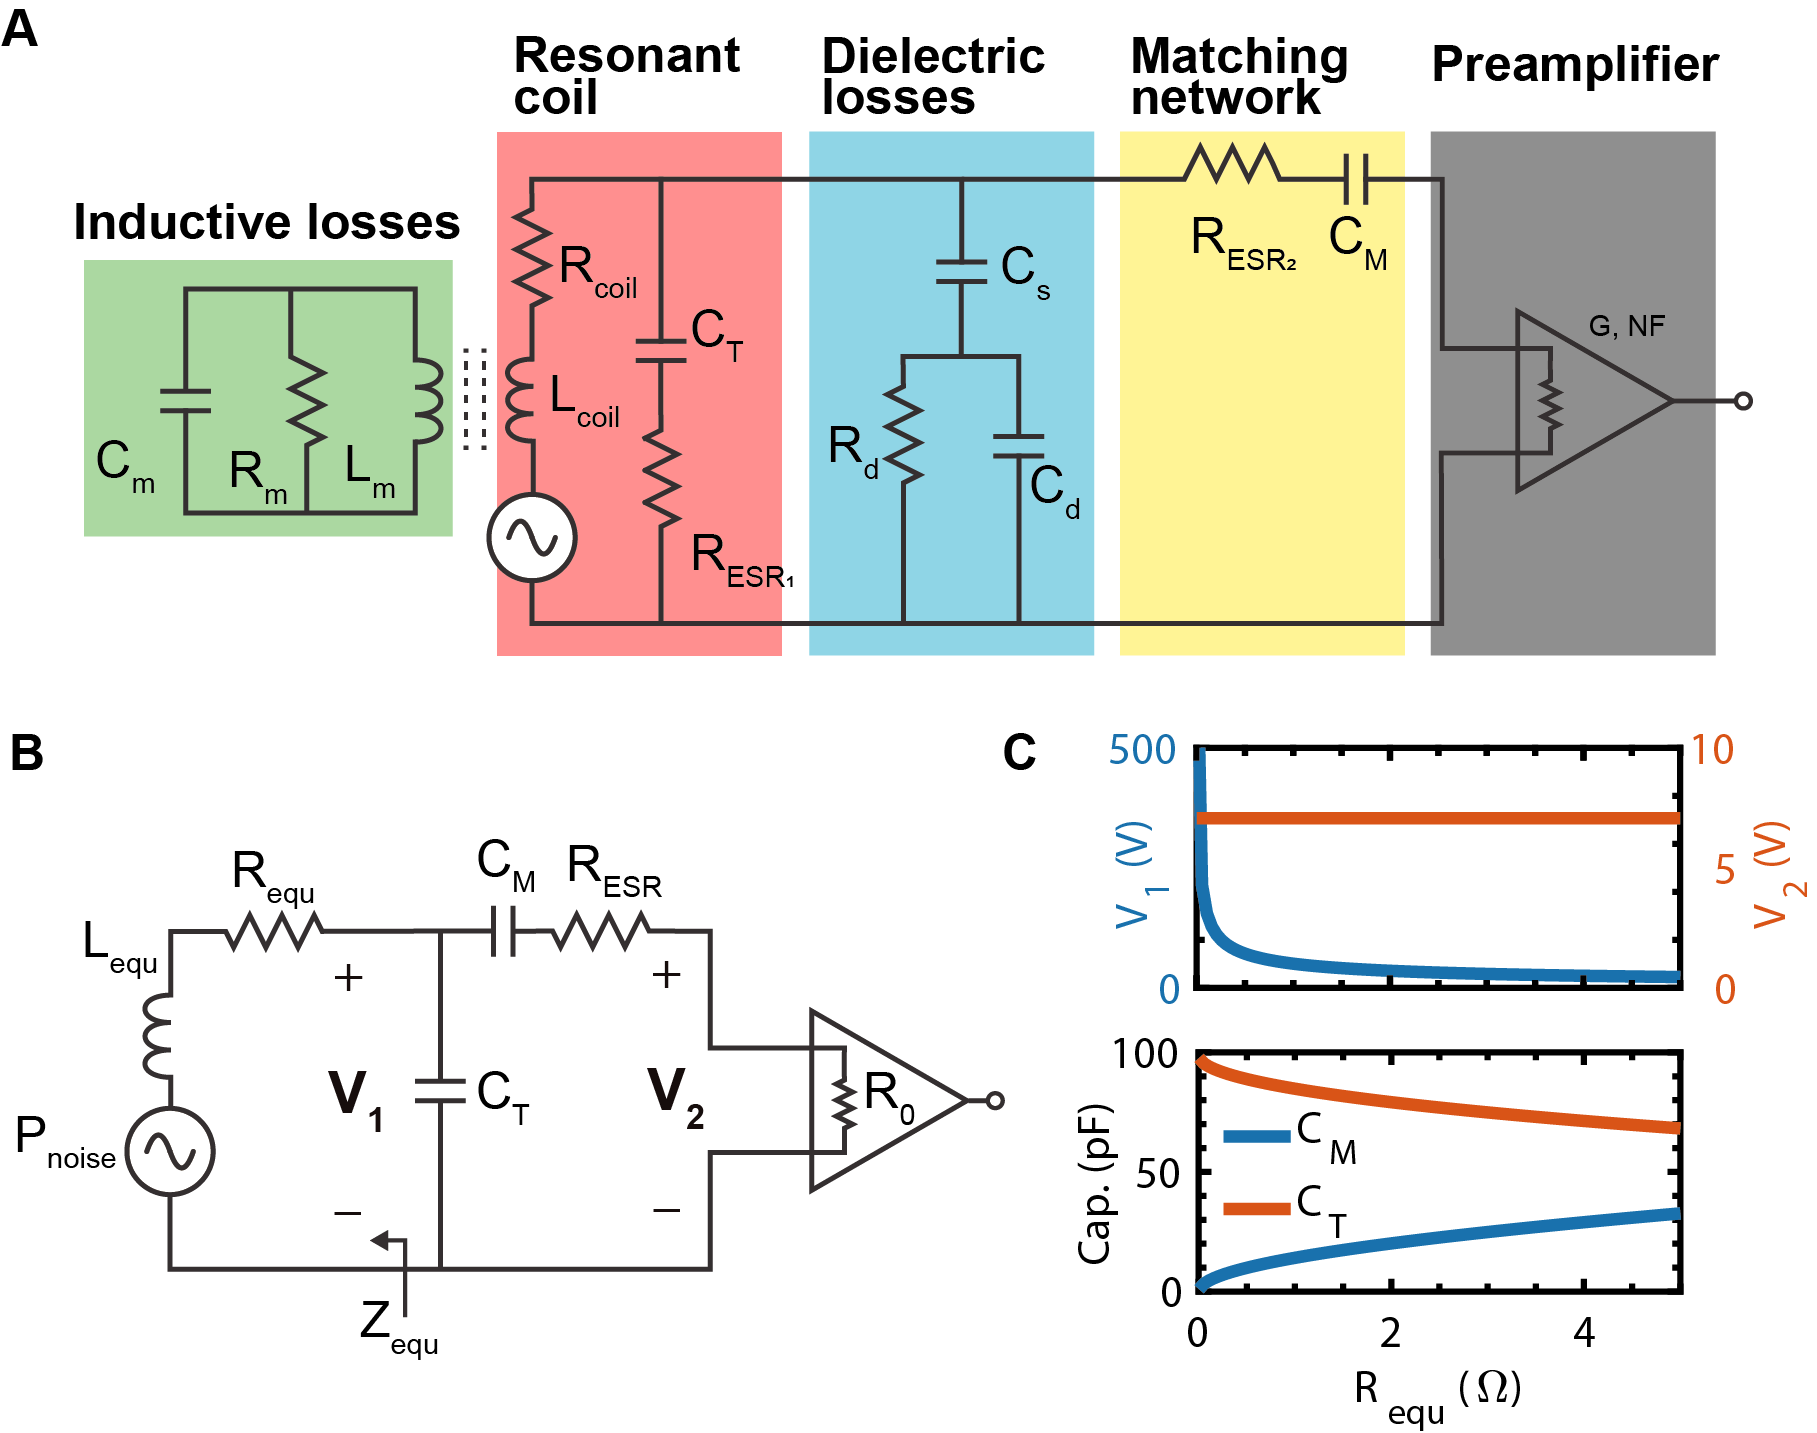
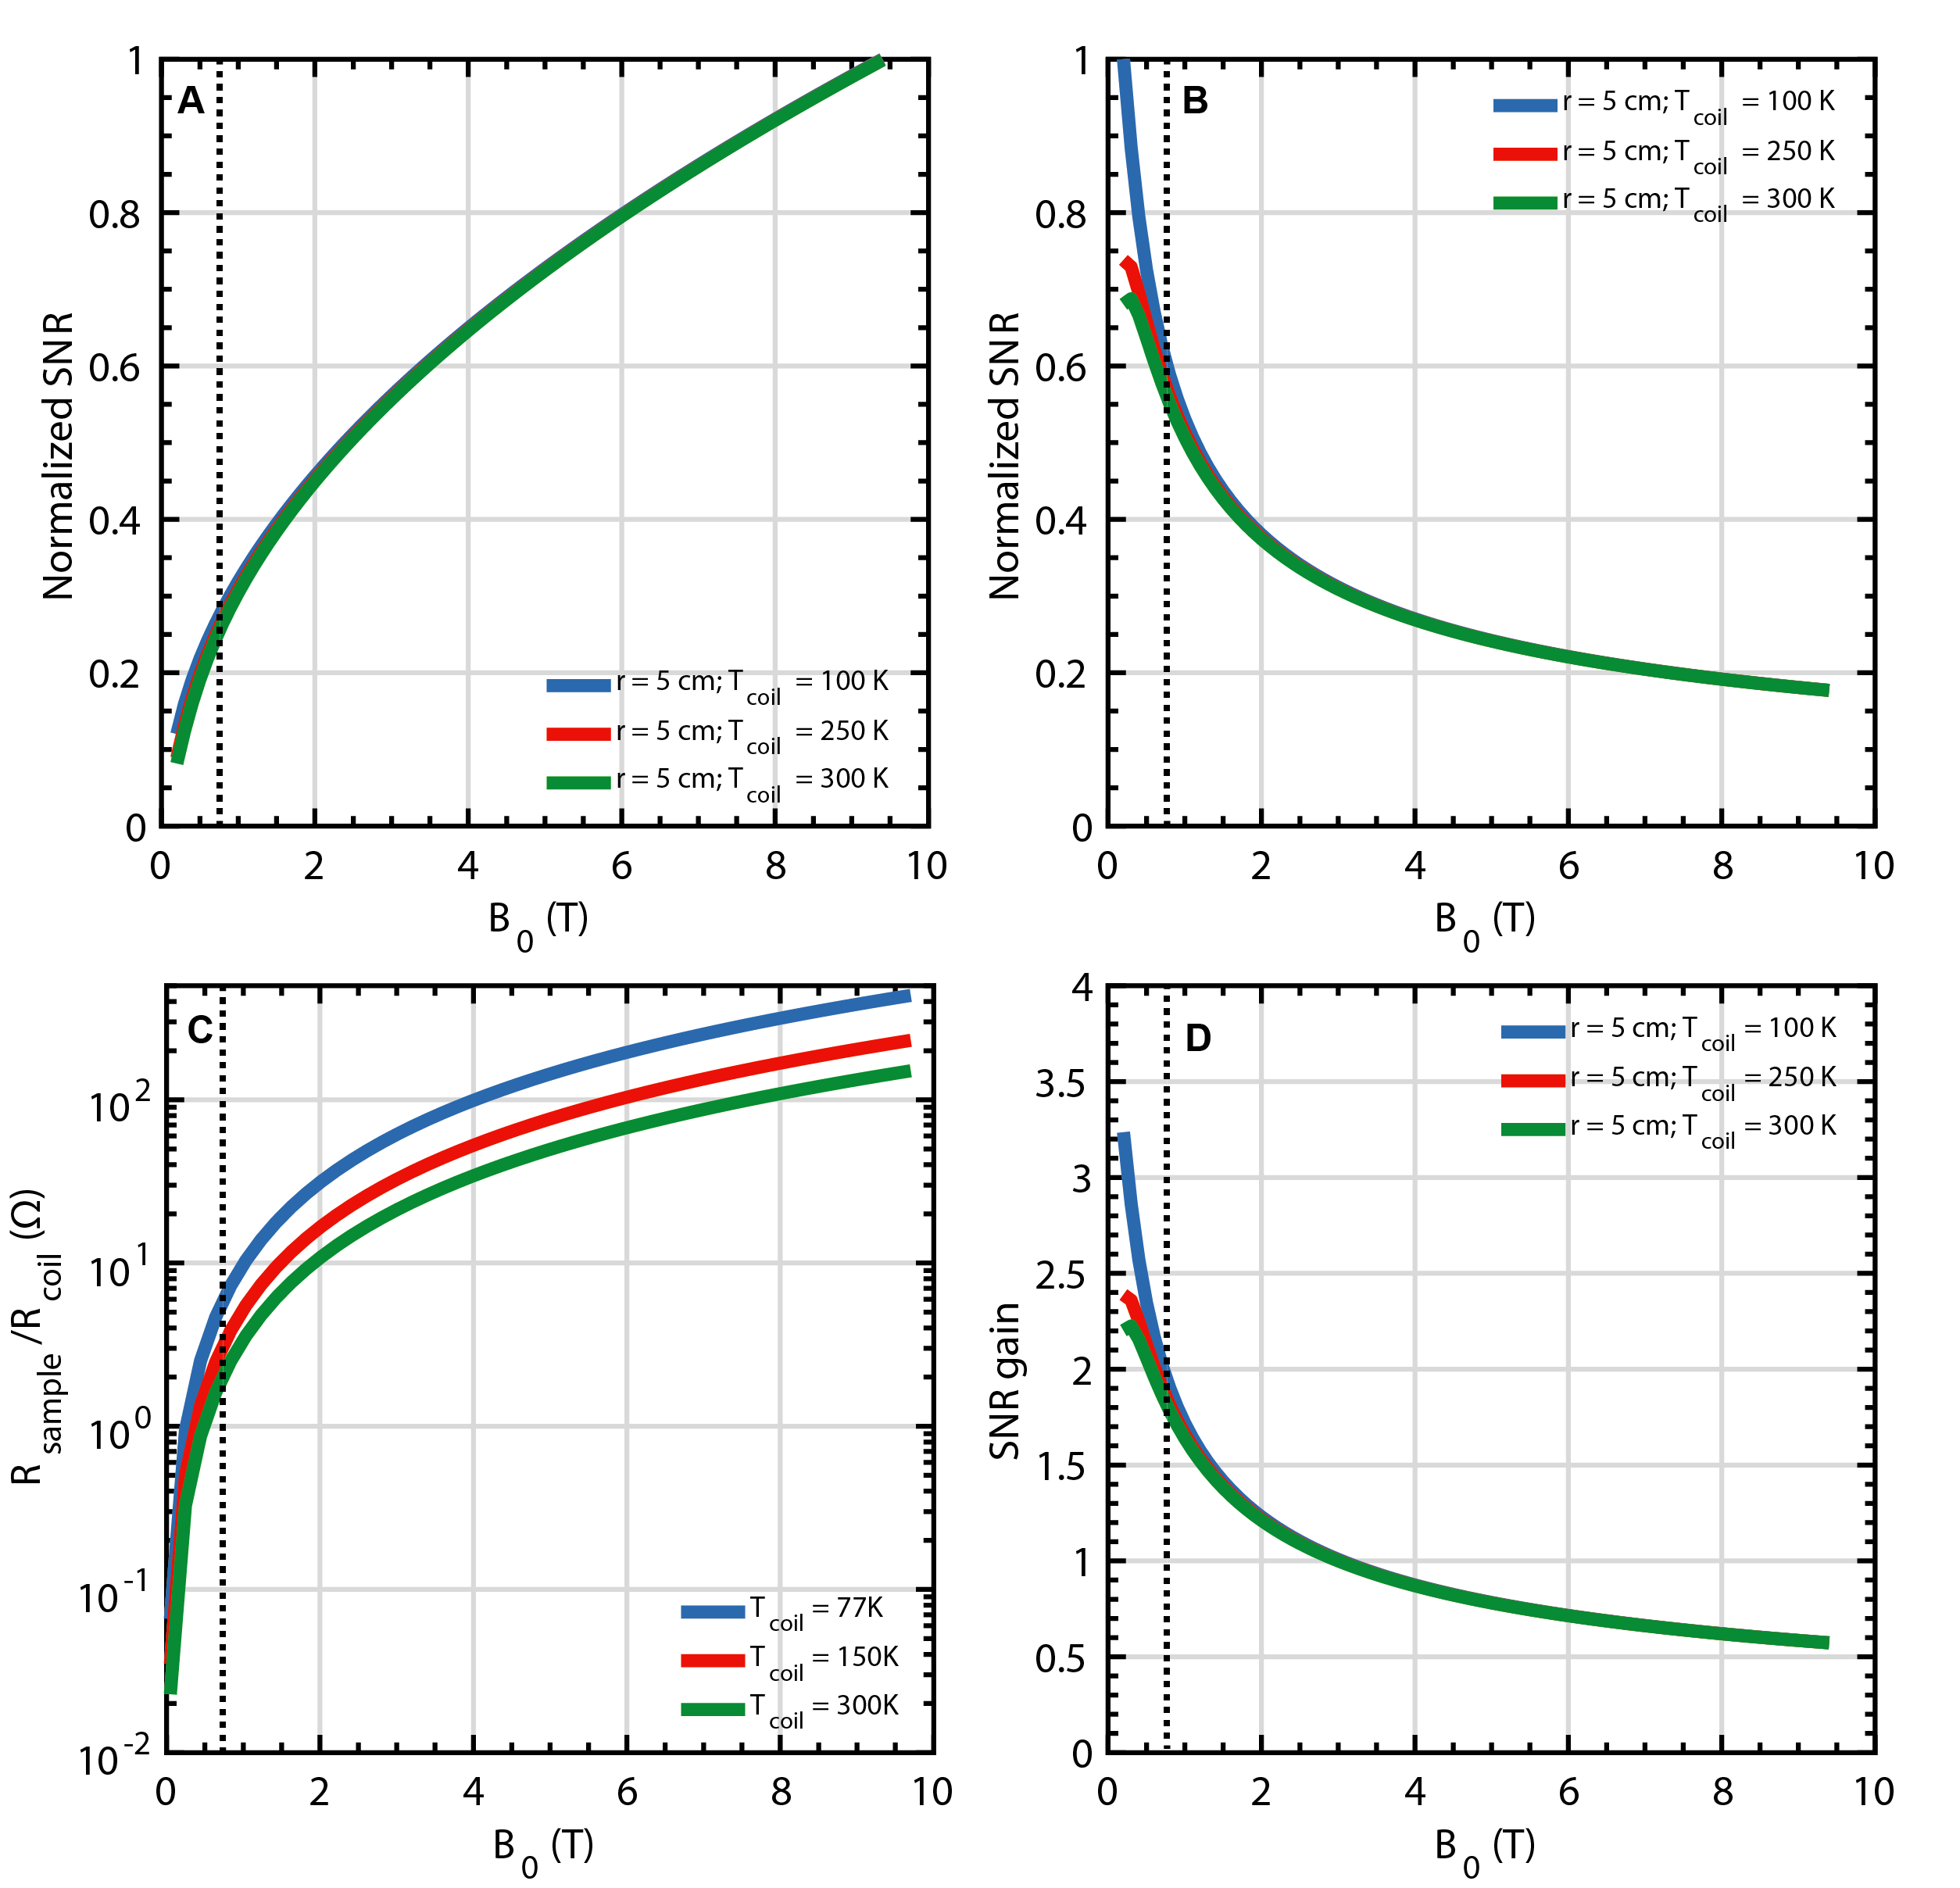
Higher $$$B_0$$$ field strengths generally offer greater SNR when observing thermal proton signal (Figure 2A). In contrast, when considering hyperpolarized spins (Figure 2B) the optimum detection field strength lies below 1.0T due to longer $$$T^*_2$$$ values, which permit longer acquisition times and hence lower readout bandwidths. Due to the coil noise dominance at lower fields (Figure 2C), cooling becomes more effective resulting in higher SNR improvement (Figure 2D) for receiving coils of nominal size and typical sample conductivity. Cooling improved the small coil SNR by a factor of 1.4 for both mineral oil and CuSO4 phantoms (Figure 3). The multi-loop coil yielded a 1.2 and 1.1 factor increase for mineral oil and CuSO4 phantoms, respectively. An SNR decrease is seen when cooling down the large coil, in contrast to the expected 1.2-1.3 factor increase. This is attributed to damage in the tuning element while cooling. Thermal noise measurements show comparable results for all coils and samples. Several notable noise contributors found in the experimental setup are illustrated in Figure 4A and simplified in Figure 4B. The measured results are confirmed via circuit analysis (Figure 4C). For a lossless, perfectly tuned and matched load (Zequ), the induced RMS noise voltage at the preamplifier input remains constant due to voltage transformation by the tuning and matching network.Conclusion
It has been demonstrated, through first principles simulation, that lower magnetic field strengths (sub 1.0T) promote higher SNR gains when detecting hyperpolarized nuclei. Such field strengths adopt a coil noise dominant regime rendering cooling more beneficial to SNR. More so, $$$T_2^*$$$ values are prolonged allowing for reduced readout bandwidth thus yielding higher SNR when compared to clinical field strengths.Acknowledgements
The work was funded in parts by EU Horizon 2020 FETFLAG MetaboliQsReferences
1. J. Parra-Robles, A.R. Cross, G.E. Santyr, Theoretical signal-to-noise ratio and spatial resolution dependence on the magnetic field strength for hyperpolarized noble gas magnetic resonance imaging of human lungs, Med. Phys. 32 (2005) 221–229.
2.ITIS Foundation.ITIS Tissue Property Database. data retrieved from https://itis.swiss/virtual-population/tissue-properties/database. 2020.
3. B.H. Suits, A.N. Garroway, J.B. Miller, Surface and Gradiometer Coils near a Conducting Body: The Lift-off Effect, J. Magn. Reson. 135 (1998) 373–379
4. L. Darrasse and J. C. Ginefri. “Perspectives with cryogenic RF probes in biomedical MRI”. In:Biochimie85.9 (2003), pp. 915–937.
5. Bottomley, P. A., Foster, T. H., Argersinger, R. E., \& Pfeifer, L. M. (1984). A review of normal tissue hydrogen NMR relaxation times and relaxation mechanisms from 1-100 MHz: Dependence on tissue type, NMR frequency, temperature, species, excision, and age. Medical Physics, 11(4).
6. J.D. Sanchez-Heredia, E.S. Szocska Hansen, C. Laustsen, V. Zhurbenko, J.H. Ardenkjaer-Larsen, Low-Noise Active Decoupling Circuit and its Application to 13 C Cryogenic RF Coils at 3 T, Tomography. 3 (2017) 60–66.
7. R. Frass-Kriegl, S. Hosseinnezhadian, M. Poirier-Quinot, E. Laistler, J.C. Ginefri, Multi-Loop Radio Frequency Coil Elements for Magnetic Resonance Imaging: Theory, Simulation, and Experimental Investigation, Front. Phys. 7 (2020).
Figures
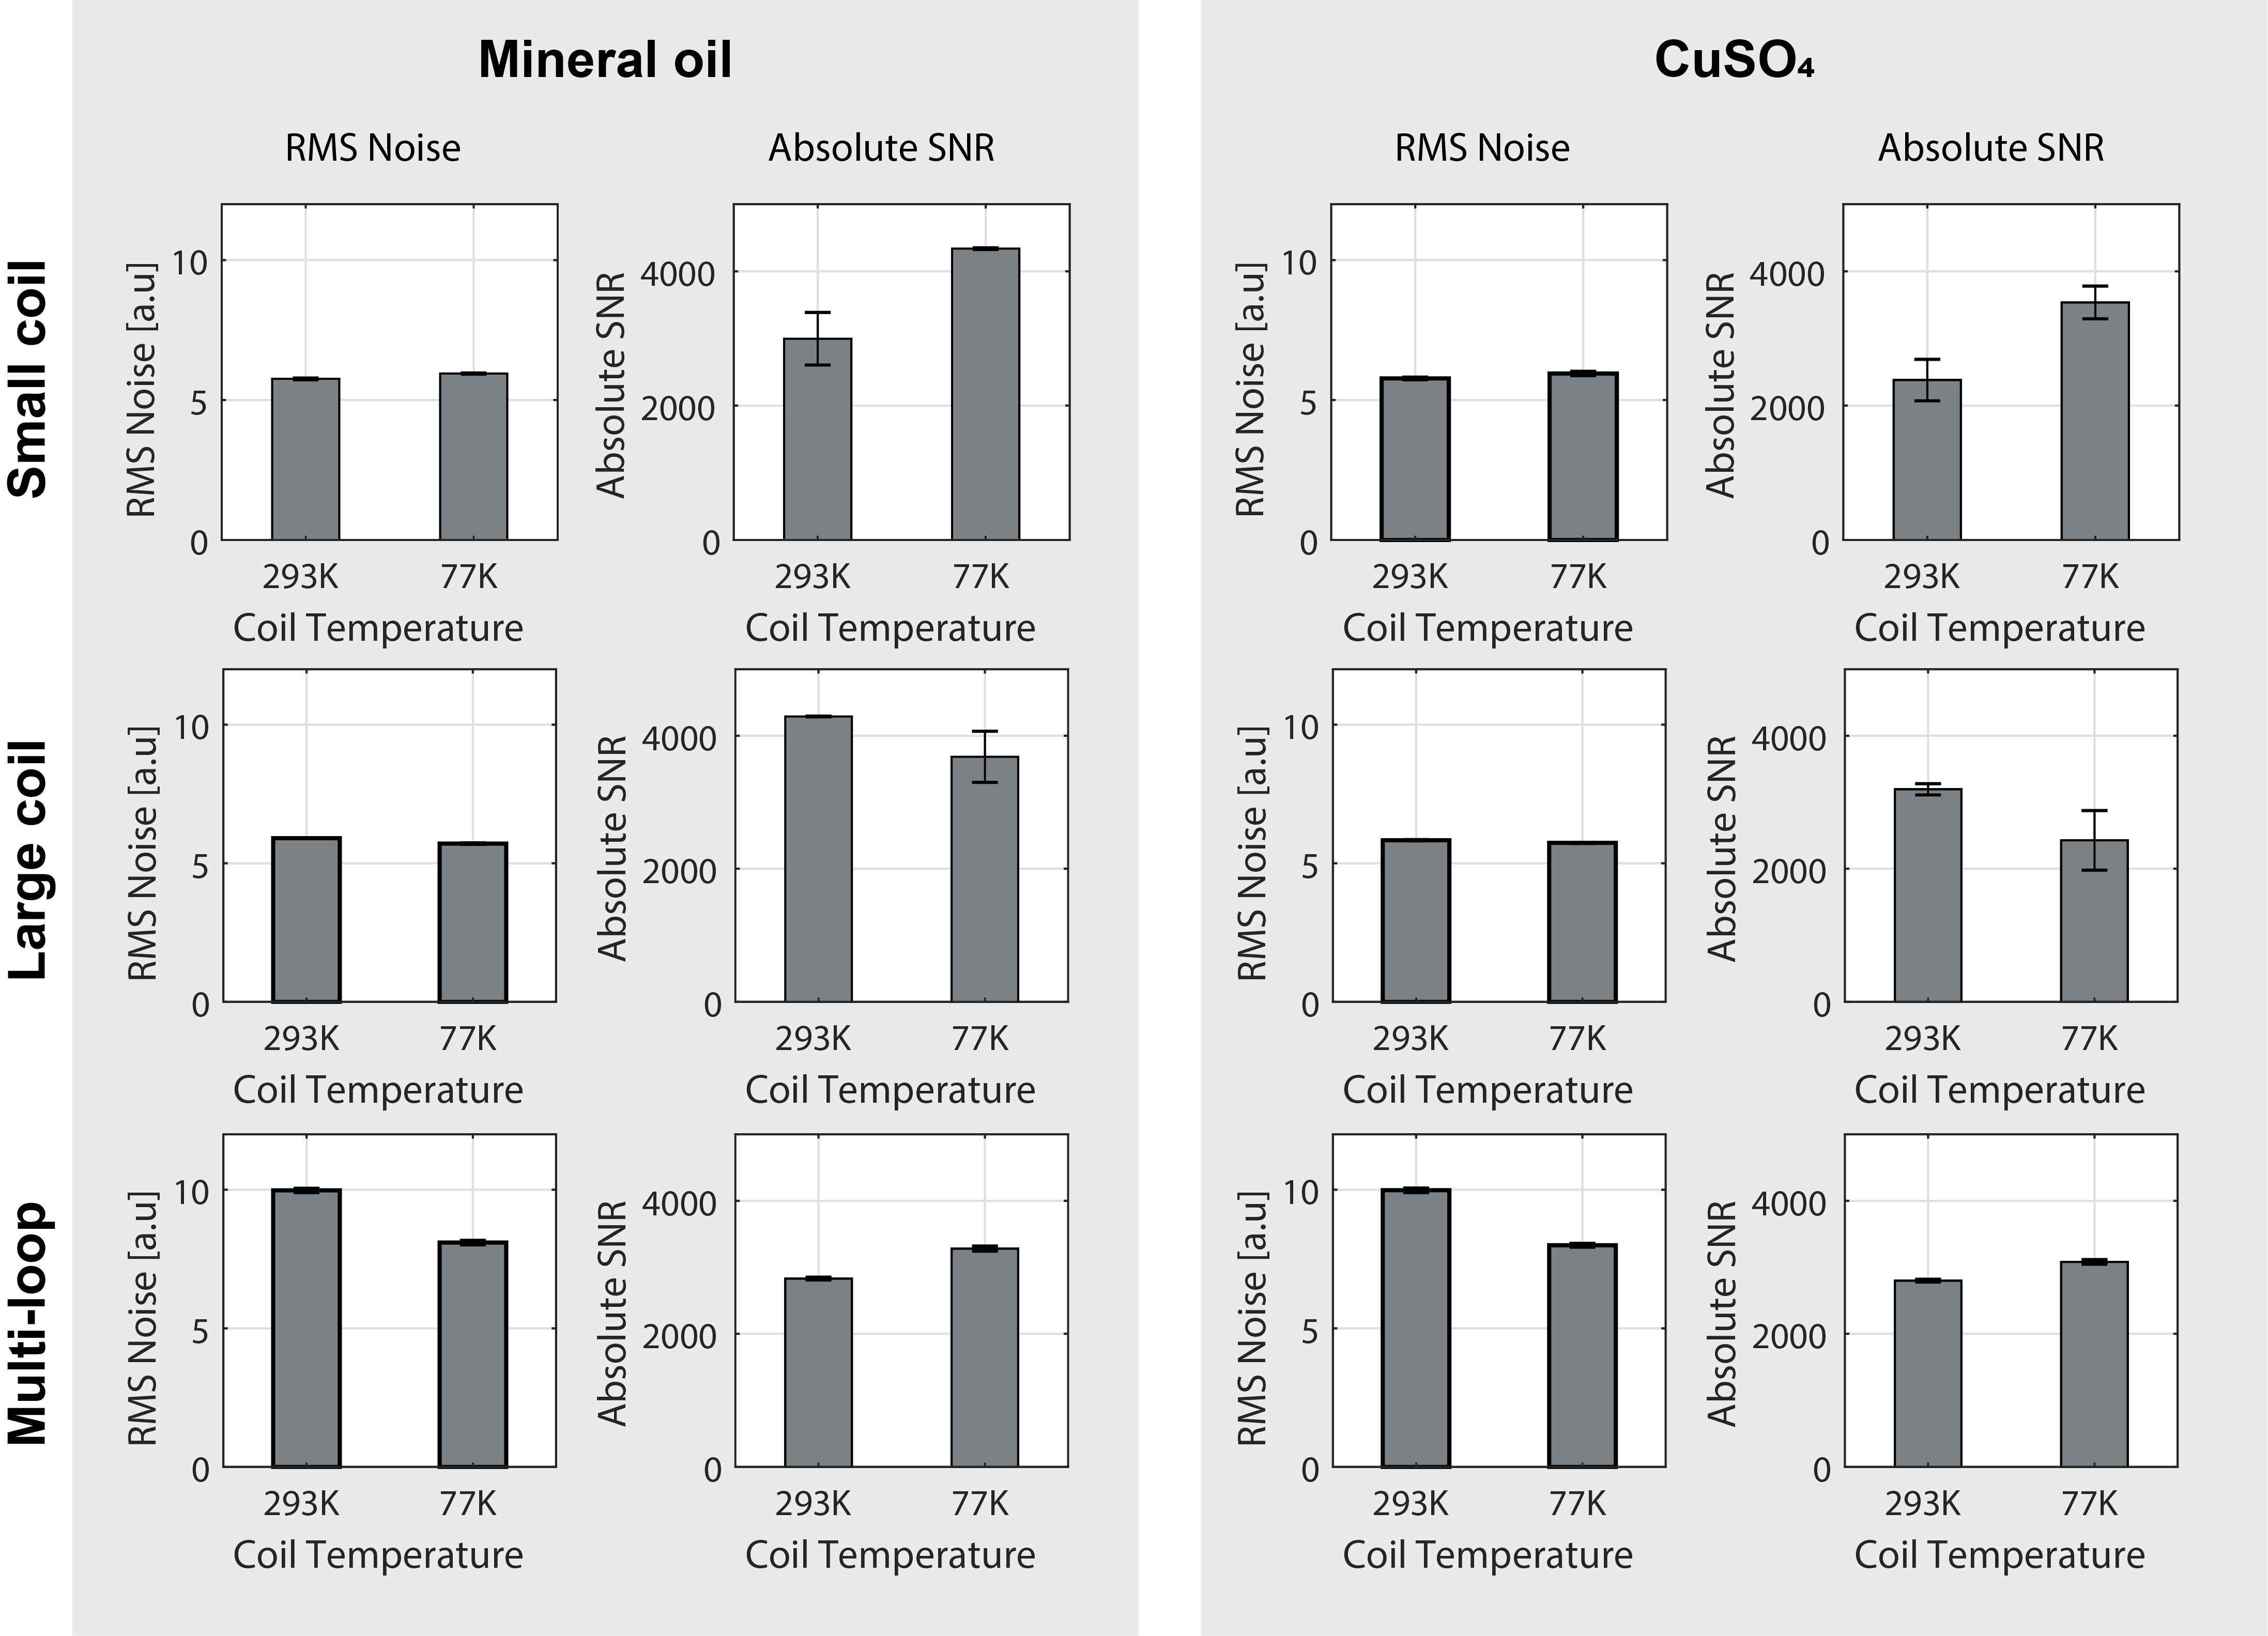
Measured RMS noise voltage and absolute SNR at 0.75T for receive coils at 293 K and 77 K. Three coils measured: small coil (top row), large coil (middle row) and multi-loop coil (bottom row), using phantoms containing mineral oil (left block) or CuSO4 solution.