1595
A novel multi-turn histology RF coil design for micro-histological slide imaging1Department of Biomedical Engineering, Sungkyunkwan University, Suwon, Korea, Republic of, 2Department of Intelligent Precision Healthcare Convergence, Sungkyunkwan University, Suwon, Korea, Republic of, 3Department of Biomedical Engineering, Gachon University, Incheon, Korea, Republic of, 4Department of Physics, Sungkyunkwan University, Suwon, Korea, Republic of, 5IBS Center for Neuroscience Imaging Research, Suwon, Korea, Republic of
Synopsis
MR microscopy can provide high-resolution measurement of MR properties of biological and artificial tissues that can be compared with optical imaging. In such experiments, low signal-to-noise ratios (SNR) of a common clinical RF coil with a low filling factor will be a challenge. So, we propose a novel, multi-turn histology coil for imaging microscopic tissue histology slices with substantially higher SNR in clinical MRI scanner compared to the previous design for microscopy tissue imaging.
1.INTRODUCTION
MR microscopy can provide high-resolution measurement of MR properties of biological and artificial tissues that can be compared with optical imaging [1]. In most cases, microscopic tissue imaging is carried out in a preclinical scanner with a small bore and fast gradients. On the other hand, the large bore of a clinical scanner facilitates mechanical manipulation (e.g. rotation) of the tissue and the RF coil which can be important for measurement of certain MR properties such as relaxation anisotropy. In addition, it facilitates use of physical laboratory equipment such as heaters, thermometers, and nutrition circulation lines for engineered or live tissue during the imaging process. In such experiments, low signal-to-noise ratios (SNR) of a common clinical RF coil with a low filling factor will be a challenge. For this reason, it is desirable to adopt a new RF coil design, such as a flat, histology coil proposed in [2]. In this abstract, we propose a novel, multi-turn histology coil for imaging microscopic tissue histology slices with substantially higher SNR compared to the original design of [2].2. METHOD
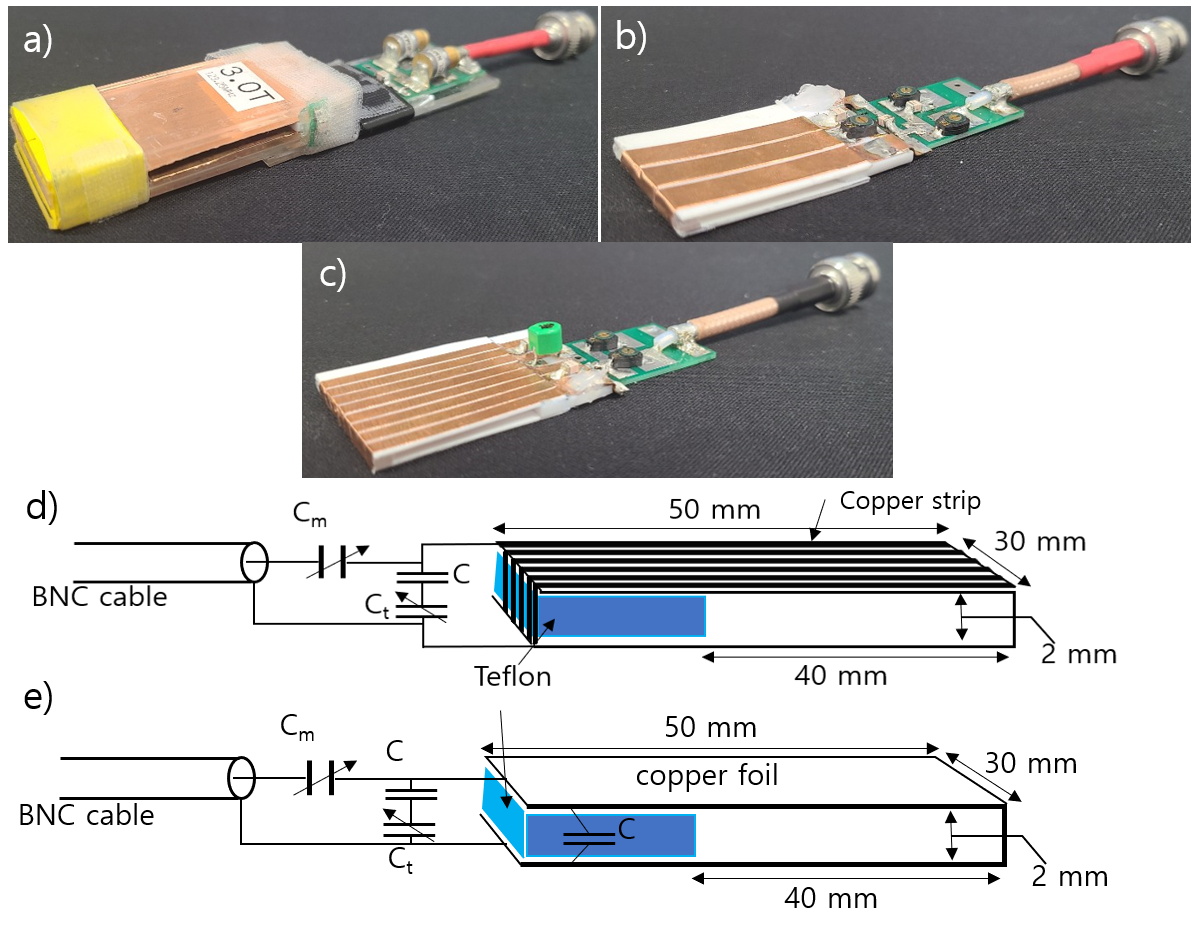
Previous MR histology studies have proposed a U-shaped coil design for a homogeneous B1 [2]. We introduce a multi-turn, flat solenoid-type design to maintain the homogeneous B1 while increasing signal sensitivity. The Q-factor, which is closely related to the signal sensitivity of an RF coil, is theoretically proportional to the coil's inductance and inversely proportional to its resistance [3]. As the number of turns of the solenoid increases, the Q-factor will increase due to the increase in inductance, but will decrease because of the increases in the resistance. Therefore, it is desirable to find the optimum number of turns. In order to investigate the SNR change with the increase of turns, the SNR of a U-shaped coil, a 3-turn solenoid coil and an 8-turn solenoid coil was measured and compared. Each coil was made of the same material, and the internal volume of the coil was kept unchanged. Each coil had a separate matching circuit for resonant frequency tuning and impedance matching. Figure 1 shows the pictures and the schematics of coils. All experiments were conducted in a clinical 3T scanner [Magnetom Prisma, Siemens Healthineers, Erlangen, Germany], using the histology coils for both RF transmission (Tx) and reception. B1 field homogeneity for each coil was measured on a gelatin phantom with the scanner’s standard B1 mapping sequence. SNR comparison was performed on a 40 μm-thick rat brain slice with a fast spoiled gradient-echo (FLASH) sequence. The Tx reference voltage was manually determined for Ernst-angle spin flip on each coil. scan parameters were: TR= 500 ms, TE=5.3 ms, averages = 32, FOV =30*40mm2, pixel size =0.25*0.25mm2, matrix size =120*160, bandwidth =210Hz/pixel, for an imaging time of 32 minutes.3. RESULT
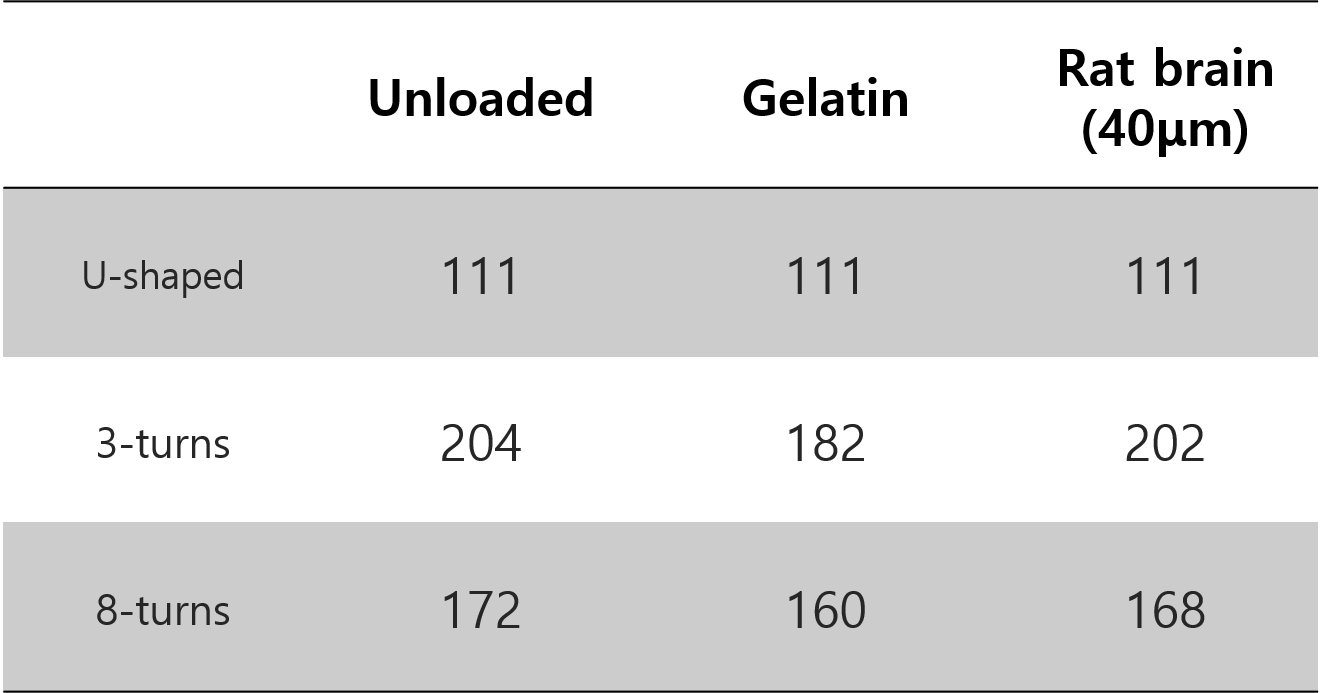
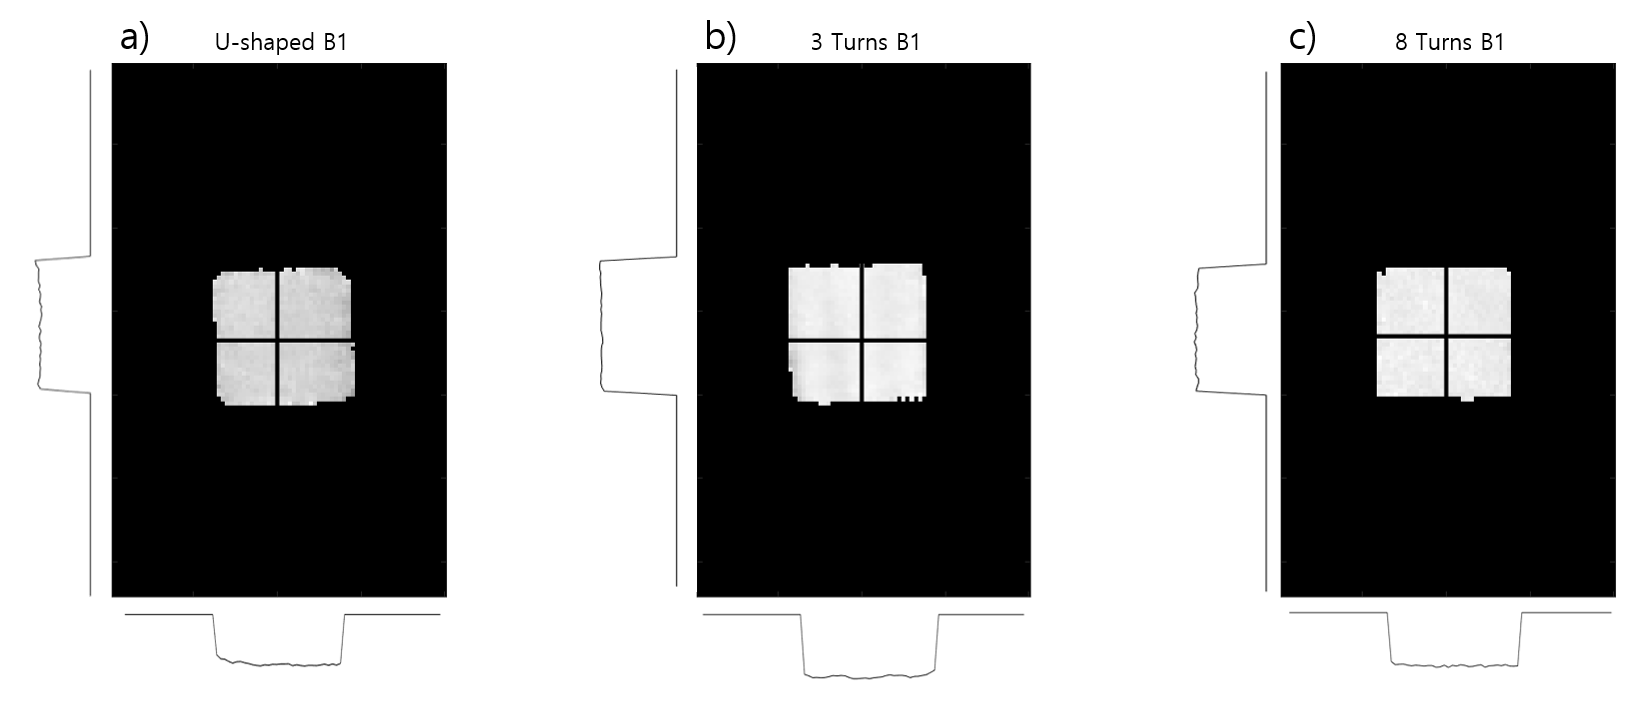
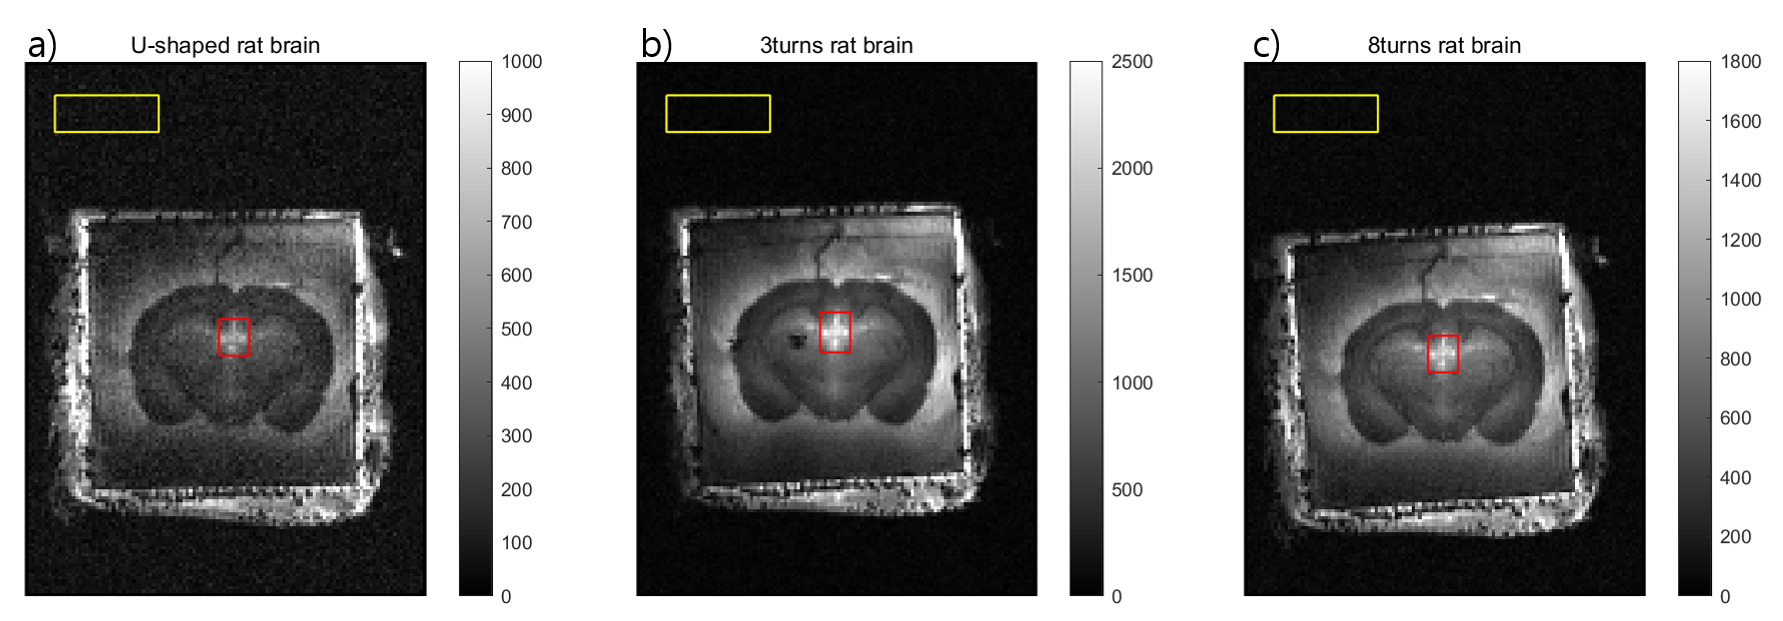
Figure 2 shows the table of each coil’s Q-factors. The solenoid coils’ Q-factors were generally higher than the U-shaped coil, with the 3-turn coil having the highest Q. Figure 3 shows the B1 field map of each coil. All coils generated highly homogeneous (within about 2%) B1 field. Figure 4 shows the rat brain slice images. The SNR for each coil was the following: U-shaped coil, 6.42; 3-turn solenoid coil, 22.48; and 8-turn solenoid coil, 15.90. This shows that the multi-turn variant of the histology coil as proposed here performs better than the original U-shaped histology coil in terms of SNR (improved by a factor of 2.5~3.5).4.DISCUSSION
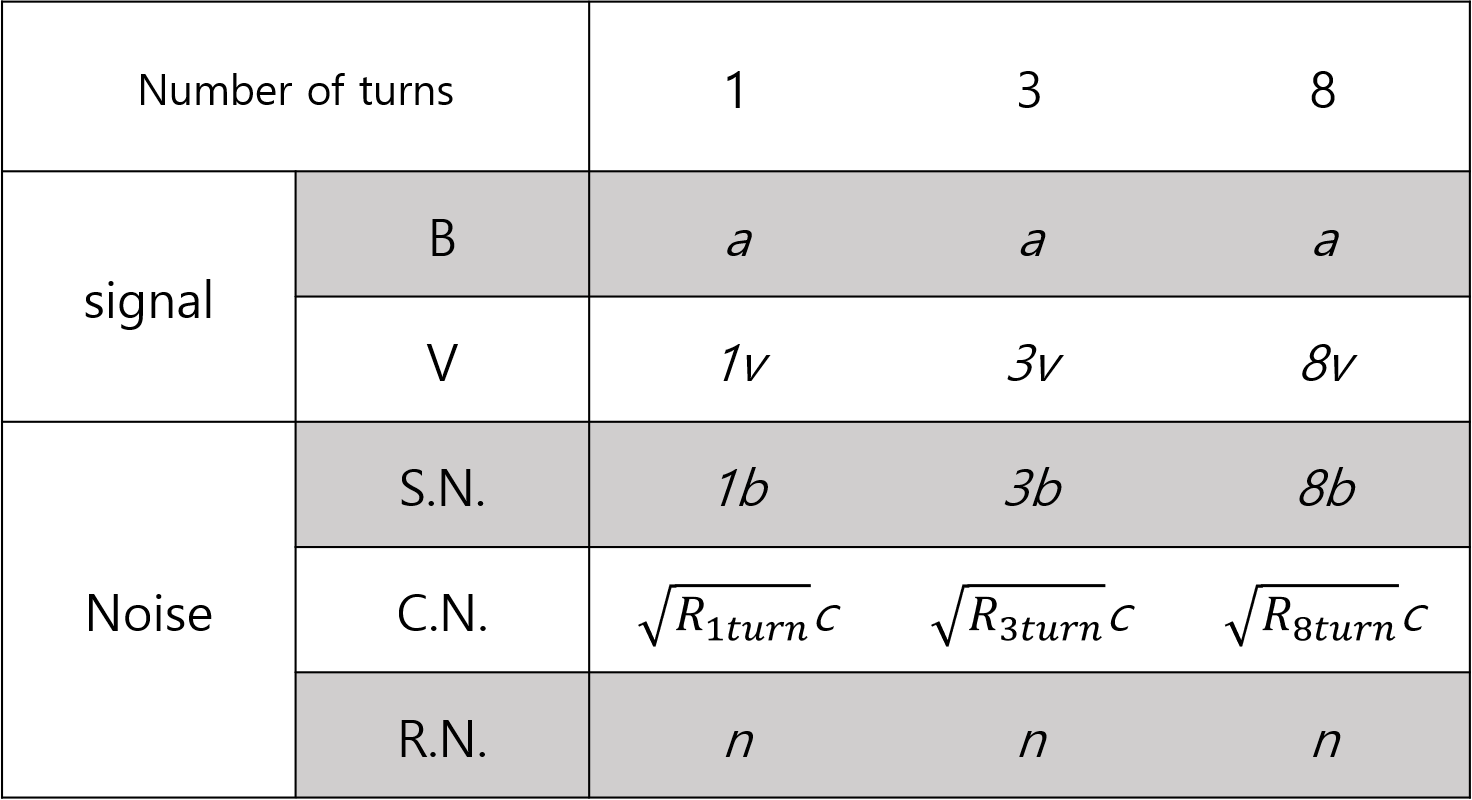
We proposed a novel RF coil design that achieved high SNR for imaging microscopic tissue samples in a clinical scanner and proved through experiments that it had more than 2.5 times the SNR of a previous design. This will shorten the measurement time and increase the resolution in the measurement of microscopic tissue MR properties. We found that the increase of SNR did not follow the increase in the number of turns. This can be due to the noise contributed by the RF interface device and the scanner’s receive chain. The table in Fig. 5 shows the estimated composition of the signal and noise for coils with different number of turns. From the table, we can expect that large turn numbers will be particularly beneficial if the scanner’s receive chain noise n is large. Based on our experiment, we estimate the n value to be around 2.2 to 2.7. As a future study, we are planning to explore a method to measure the MR properties of several tissue samples at once by stacking solenoid coils with optimal turns, in order to increase the measurement throughput.Acknowledgements
This work was supported by the Institute for Basic Science under grant number IBS-R015-D1, and by the National Research Foundation of Korea (NRF) grant funded by the Korean government (MSIT) (No. 2019R1A2C1006448). The authors thank Ms. Hye-Sook Lee for help with histology samples.References
[1] S.P. Lee, et al., Visualization of beta-Amyloid Plaques in a Transgenic Mouse Model of Alzheimer's disease using MR microscopy without contrast reagents. Magn Reson Med, 2004, 52(3): p. 538-544.
[2] M.D. Meadowcroft, et al., Direct Magnetic Resonance Imaging of Histological Tissue Samples at 3.0T., Magn Reson Med, 2007. 57(5): p. 835-841.
[3] J. Mispelter, M. Lupu, and A. Briguet, NMR Probeheads for Biophysical and Biomedical Experiments : Theoretical Principles & Practical Guidelines. 2006, London: Imperial College Press xiv,
[4] B.P. Song et al., Inductively Coupled RF Coil for Imaging a 40 μm-Thick Histology Sample in a Clinical MRI Scanner. JKPS, 2020. 77(1): p. 87-93.
Figures