1576
A dipole antenna array with “flipped” high dielectric constant (HDC) material for improved SNR at 10.5 Tesla1Center for Magnetic Resonance Research, Minneapolis, MN, United States, 2Penn state University, Centre County, PA, United States, 3Radiology at NYU Grossman School of Medicine, New York University, New York, NY, United States
Synopsis
In the previous work, we evaluated the transmit performance of 10.5 T RF coils composed of dipole antennas and high dielectric constant (HDC) ceramic materials with a “Normal” (Dipole - HDC - Sample) and a counterintuitive “Flipped” geometry (HDC – Dipole - Sample) positioning. Now we evaluated the receive performance of such an array structure with these setups both in simulations and experiments. The “flipped” setup showed notable periphery SNR improvement and suggest some promise for the UHF receiver arrays.
Introduction
High dielectric constant (HDC) materials have been successfully introduced to MRI for improve transmit efficiency, possible reduced SAR and signal-to-noise ratio (SNR)1-5. Generally, HDC materials are positioned between the imaging subject and the RF coil, however, we previously presented a setup which flips the position of the antenna and the HDC material6 and achieved performance gains with this novel configuration. To further investigate this geometry for use in ultra-high-field (UHF) arrays we built a 8-channel array structure and compared a “Normal” setup (Sample - HDC - Dipole antenna) with a “Flipped” setup (Sample - Dipole antenna - HDC).Methods
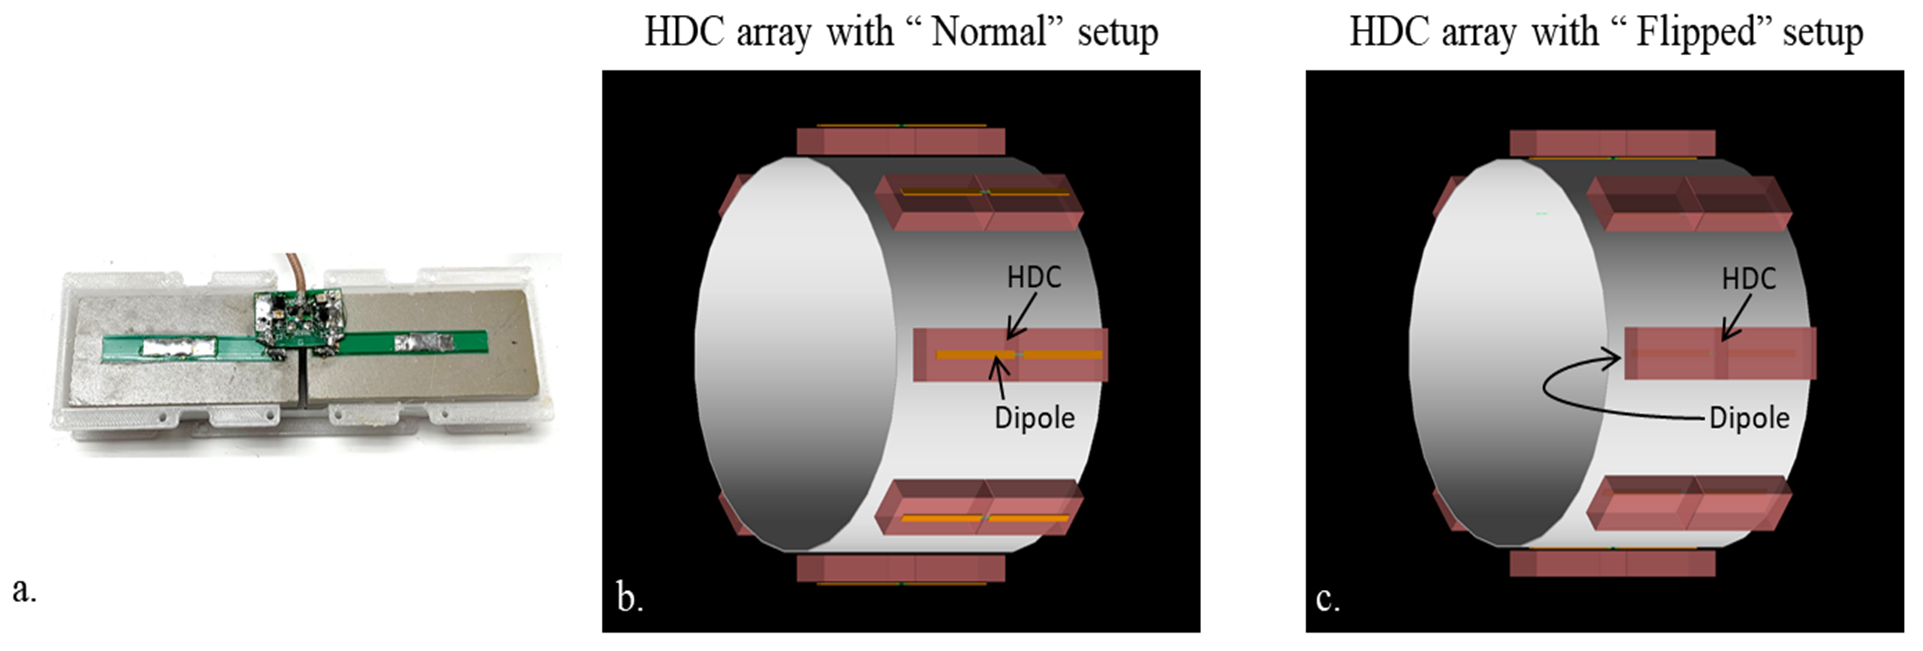
We built eight individual 15 cm long HDC dipole antenna elements and mounted them equal distant onto a circular head size support frame (dimensions: 24 cm × 24 cm). Each antenna element consisted of two short rectangular shaped (3.2 × 7.5 × 1.6 cm3) HDC materials (TiO2) blocks (σ = 0.0031 S/m and εr = 100) positioned end to end for a combined 15 cm long dipole. The dipole conductor legs and lattice balun matching network were directly mounted onto the HDC material. Fig. 1a shows the photo of a single element of the 8-channel HDC dipole antenna array. Simulation models of the “Normal” (Fig. 1b) and “Flipped” (Fig. 1c) dipole antenna array configuration with HDC materials are shown. For the experiment, the former of the HDC array was fabricated using a 3D printer (F410, Fusion3 Design, Greensboro, NC, USA). A cylindrical phantom (17 cm diameter and 30.5 cm long) with uniform electrical properties (σ= 0.6 S/m and εr = 49) at 10.5 T was used to calculate SNR with a standard proton density-weighted gradient echo (GRE) sequence (TR = 4000 ms, TE = 3 ms, TA = 7:48 ms, nominal flip angle = 60°, FOV = 354 × 354 and resolution = 1.5 mm × 1.5 mm × 3 mm acquired). The intrinsic SNR (iSNR) maps were calculated from the GRE images by dividing the image intensity by the measured noise at the scanner since the flip angle can be estimated from the flip angle map. iSNR were calculated in MATLAB (Mathworks, Inc., Natick, MA, USA). Simulated SNR were calculated using XFdtd (REMCOM, State College, PA) with 2 × 2 × 2 mm3 resolution.Results and Discussion
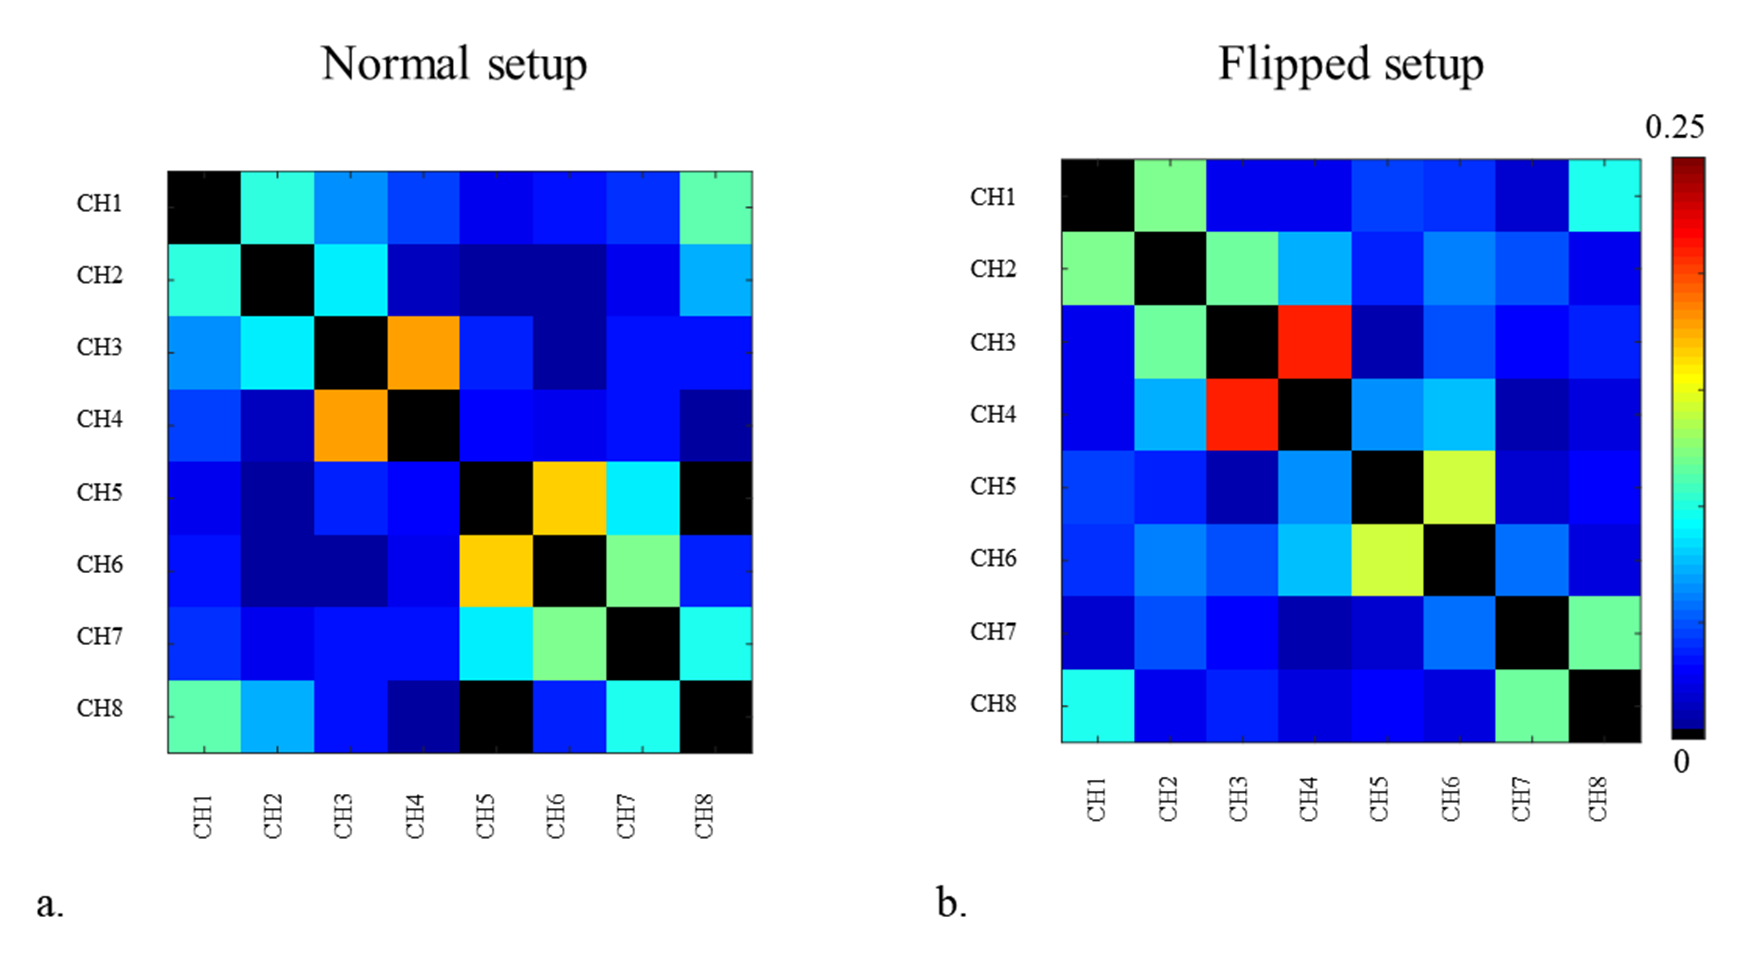
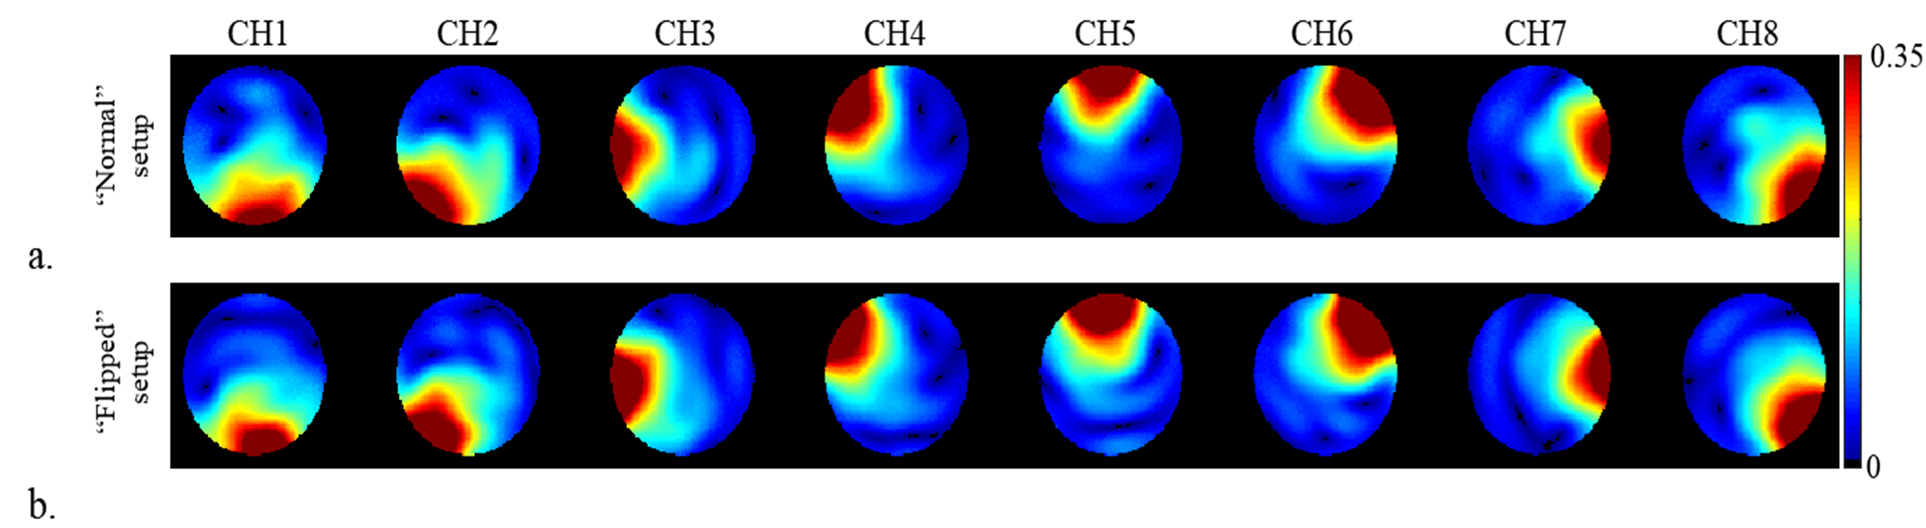
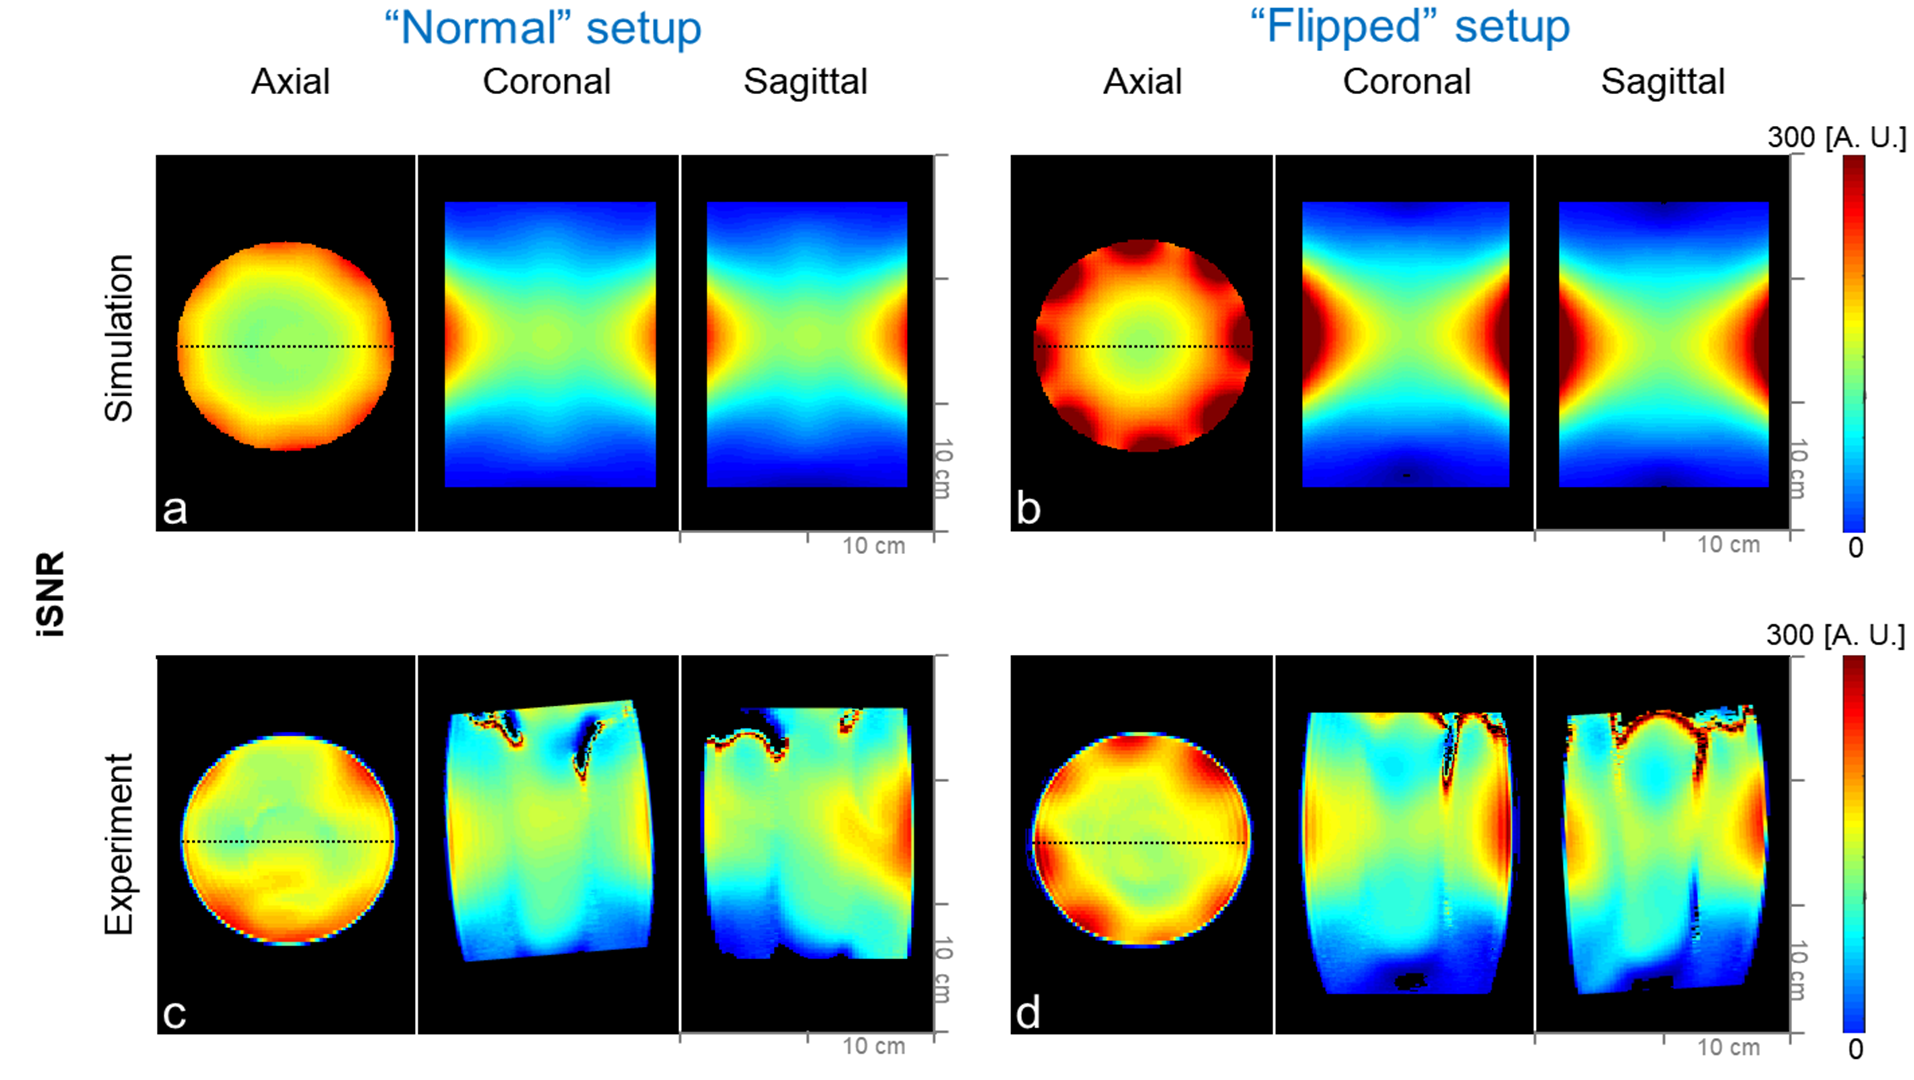
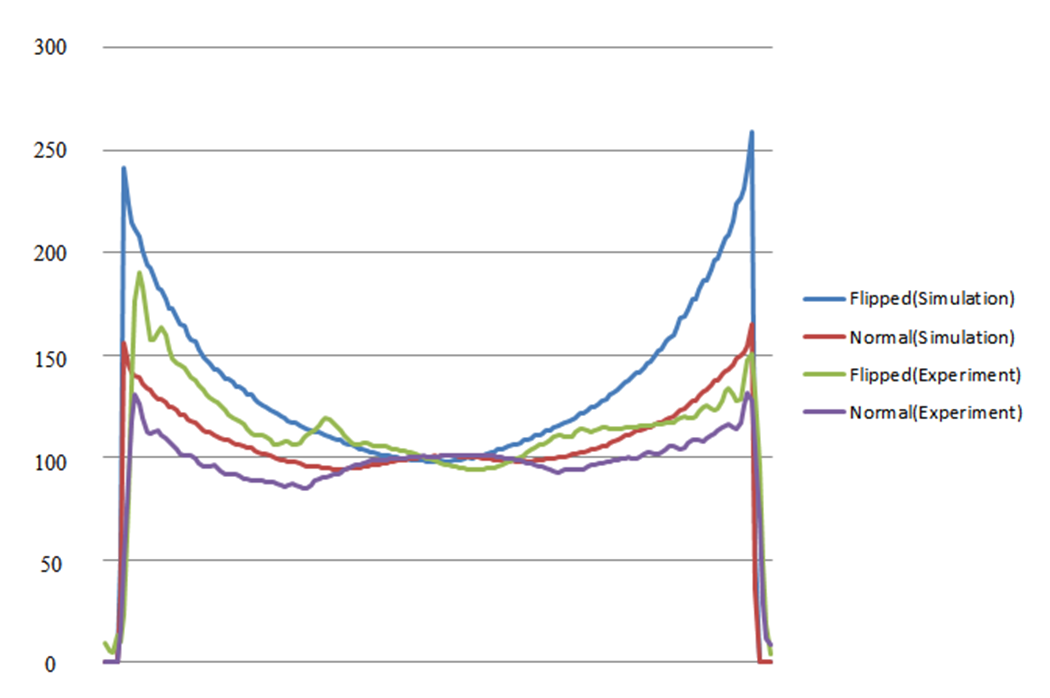
Noise correlation matrix of both arrays were obtained and are shown in Fig. 2. For the “Flipped” setup (Fig. 2b) the noise covariance among the elements was increased - but still an acceptable value (0.25) was achieved. Individual receive maps for both setups were obtained and are shown in Fig. 3. Fig. 4, the iSNR were compared between the “normal” setup and the “flipped” setup (where the dipole/HDC complex was at the same location relative to the sample as the normal set up, but the dipole was placed on the proximal as opposed to the distal (relative to sample) surface of the HDC material) both in simulation and the experiment. As indicated in Fig. 4 and 5, the flipped setup consistantly shows substantially higher peripheral SNR compared to the normal setup. These results confirm for an array configuration the previously reported improvement achievable with individual element.Conclusion
Our simulation and experimental array results confirm the previous single element observation 6, that a flipped HDC dipole element array achieves improved iSNR. As expected from reciprocity, the flipped setup also showed higher efficiency as a receiver. Here we expanded the initial SNR comparison to eight channel array setups and confirmed that the flipped setup still shows the improvements. In future studies, we plan to increase the number of antenna elements by a staggered layout in the z-direction and will optimize the HDC geometry and material paramenters for improved transceiver human head imaging at 10.5 T.Acknowledgements
NIH-U01-EB025144, NIH-S10-RR029672, NIH-BTRC-P41-EB027061 and NIH-P30-NS076408References
1 Haines, K., Neuberger, T., Lanagan, M., Semouchkina, E. & Webb, A. High Q calcium titanate cylindrical dielectric resonators for magnetic resonance microimaging. Journal of Magnetic Resonance 200, 349-353 (2009).
2 Lagore, R. L. et al. in Proceedings of the 25th Annual Meeting of ISMRM, Honolulu, HI.
3 Luo, W., Guo, J., Randall, C. & Lanagan, M. Effect of porosity and microstructure on the microwave dielectric properties of rutile. Materials Letters 200, 101-104 (2017).
4 Yang, Q. X. et al. Manipulation of image intensity distribution at 7.0 T: passive RF shimming and focusing with dielectric materials. Journal of Magnetic Resonance Imaging: An Official Journal of the International Society for Magnetic Resonance in Medicine 24, 197-202 (2006).
5 Yang, Q. X. et al. Manipulation of image intensity distribution at 7.0 T: passive RF shimming and focusing with dielectric materials. J Magn Reson Imaging 24, 197-202, doi:10.1002/jmri.20603 (2006).
6 Woo et al., M. in Proceedings of the 20th scientific meeting, International Society for Magnetic Resonance in Medicine, Melbourne, Australia 7431 (2019).
Figures