1570
Open source Magnetic rEsonance finGerprinting pAckage (OMEGA)
Enlin Qian1 and Sairam Geethanath1
1Columbia Magnetic Resonance Research Center, New York, NY, United States
1Columbia Magnetic Resonance Research Center, New York, NY, United States
Synopsis
This work develops an end to end, open source, vendor neutral package that allows for fast prototyping of magnetic resonance fingerprinting using Pulseq. In this work, a previously published sequence was implemented in Pulseq, and data were acquired on ISMRM/NIST phantom. The raw data were reconstructed and matched with an extended phase graph simulated dictionary. Automated region of interest analysis was performed to extract T1 and T2 estimation for each sphere of the phantom. The results show that T1 and T2 estimations for 17 spheres of T1 and T2 arrays are within 20% of gold standard measurements.
Introduction
Magnetic resonance fingerprinting (MRF) is a framework that allows for simultaneous quantification of tissue properties.1 However, there are no consistent implementations of MRF to evaluate accuracy and repeatability across different sites and vendors. Recently, Pulseq was established as an open-source tool that enables fast prototyping of pulse sequence in MATLAB and Python.2,3 In this work, we leverage Pulseq to develop an end to end open source MRF package named OMEGA in MATLAB and validate its functionalities.Method
The gold standard (GS) measurements of T1 and T2 in corresponding arrays of the ISMRM/NIST phantom were performed on a Siemens 3T Prisma scanner (Siemens Healthineers, Erlangen, Germany) using the same protocols in previous study.4 The last four spheres of T2 array were fitted separately using TE=12, 15, 18, and 21 ms to better characterize their values.OMEGA contains five modules. The sequence design module used repetition time (TR), echo time (TE), and flip angles (FA) reported in literature4 and generated a .seq file that was played on the scanner. The sequence was implemented using Pulseq2 with the following parameters: maximum gradient amplitude 32 mT/m, maximum slew rate 130 T/m/s, field of view 225 mm, and matrix size 256x256, with a total of 1000 time points. An inversion pulse was added at the beginning to enhance contrast and improve dictionary matching performance.
In vitro data was acquired using the generated sequence on ISMRM/NIST phantom at the same scanner. The scans were performed using a 20-channel head coil. The collected data from each coil was inputted into the image reconstruction module and sliding window reconstructed using Michigan Image Reconstruction Toolbox (MIRT) for Non-Uniform Fast Fourier reconstruction of spiral k-space data. The reconstructed data of each channel was corrected for phase and combined to form the final image.
The dictionary simulation module generated a dictionary using Extended Phase Graph (EPG)5 simulations with the same parameters as in the sequence. The dictionary contains 2627 entries covering T1 and T2 of all spheres in ISMRM/NIST phantom. The reconstructed image data was matched with EPG-simulated dictionary using vector dot product in dictionary matching module to generate T1 and T2 maps. Inversion time (TI) was calibrated to optimize dictionary matching performance.
The automated ROI analysis module was designed to extract mean and standard deviation (SD) of all spheres in the phantom. The tool assumed that: 1) the relative distance from each sphere to Sphere 1 are constants, 2) the experiment estimations are +/-15% of NIST values. The tool returns an error if the difference is greater than 15%, and 3) the phantom is at the isocenter of the magnet. 100 pixels per sphere were selected for OMEGA data and 50 pixels were selected for GS data due to different matrix sizes.
Previous studies suggested that T2 values are more susceptible to B1 variations than T1.8 A Bloch-Siegert based B1 mapping was performed to investigate the issue.
Results/Discussion
The GS measurements of T1 and T2 values are presented in Figure 1. All values are within 10% of NIST values.6 The extra four TEs helped improve the curve fitting performance with small T2 values because longer TEs mostly contribute noise and compromise the curve fitting performance.The TR and FA design of OMEGA are described in Figure 2. The design is identical to previous study.4 With the latest version of Pulseq interpreter, we were able to implement 1000 different radiofrequency (RF) pulses waveforms that correspond to the literature sequence.
Figure 3a shows the 500th time point of MRF acquisition and 3b compares the signal evolution of one pixel with its corresponding dictionary entry. The MRF images were relatively artifact free. The signal evolution and dictionary entry showed divergence in the first 200 points due to an inaccurate inversion pulse. A series of pulse calibrations were performed to fix this issue.
The T1 and T2 maps generated using OMEGA and boxplot with min and max are shown in Figure 4. Spheres 6-13 are within 15% of GS values. The first five T1 values underestimate GS values by approximately 20%. This agrees with our previous study7 and can be corrected using a constant bias term. Sphere 14 was matched incorrectly because of limited dictionary resolution in short T1 range. Deep learning method is a potential solution to this problem. T2 values have a larger SD comparing to T1. Figure 5 presents the B1 map acquired on T2 array with a flip angle of 8 degrees. The last two spheres with shortest T2 values experience larger B1 variations compared to other spheres. Sphere 1-8 received larger flip angles. B1 map can be incorporated in EPG dictionary simulation and improve the dictionary matching performance.
The complete OMEGA package is open source and accessible on Github.9 This enables consistent implementations across multiple vendor platforms for meaningful comparisons of MRF sequences.
Conclusion
In this study, we demonstrated OMEGA, the first end to end, open source, vendor neutral MRF package using Pulseq and MATLAB reconstruction. Our results suggested that OMEGA is accurate for 17 spheres of T1 and T2 arrays in ISMRM/NIST phantom. Future work includes incorporating B1 map to EPG dictionary simulation, deep learning based image reconstruction, and diffusion imaging.Acknowledgements
This study was funded [in part] by the Seed Grant Program for MR Studies and the Technical Development Grant Program for MR Studies of the Zuckerman Mind Brain Behavior Institute at Columbia University and Columbia MR Research Center site.References
- Ma, D., Gulani, V., Seiberlich, N., Liu, K., Sunshine, J. L., Duerk, J. L., & Griswold, M. A. (2013). Magnetic resonance fingerprinting. Nature. https://doi.org/10.1038/nature11971
- Layton, K. J., Kroboth, S., Jia, F., Littin, S., Yu, H., Leupold, J., … Zaitsev, M. (2017). Pulseq: A rapid and hardware-independent pulse sequence prototyping framework. Magnetic Resonance in Medicine. https://doi.org/10.1002/mrm.26235
- Ravi, K., Geethanath, S., & Vaughan, J. (2019). PyPulseq: A Python Package for MRI Pulse Sequence Design. Journal of Open Source Software. https://doi.org/10.21105/joss.01725
- Jiang, Y., Ma, D., Seiberlich, N., Gulani, V., & Griswold, M. A. (2015). MR fingerprinting using fast imaging with steady state precession (FISP) with spiral readout. Magnetic Resonance in Medicine. https://doi.org/10.1002/mrm.25559
- Weigel, M. (2015). Extended phase graphs: Dephasing, RF pulses, and echoes - Pure and simple. Journal of Magnetic Resonance Imaging. https://doi.org/10.1002/jmri.24619
- Russek SE, Boss M, Jackson EF, Jennings DL, Evelhoch JL, Gunter JL, Sorensen AG. Characterization of NIST/ISMRM MRI system phantom. In Proceedings of the 20th Annual Meeting of ISMRM, Melbourne, Australia, 2012. Abstract 2456.
- Qian E et al. Two-site repeatability study of Tailored Magnetic Resonance Fingerprinting (TMRF). In Proceedings of the 28th Annual Meeting of ISMRM, 2012. Abstract 3758.
- Chen, Y., Jiang, Y., Pahwa, S., Ma, D., Lu, L., Twieg, M. D., … Gulani, V. (2016). MR fingerprinting for rapid quantitative abdominal imaging. Radiology. https://doi.org/10.1148/radiol.2016152037
- Enlin Qian, OMEGA, (2020), GitHub repository, https://github.com/imr-framework/mrf
Figures
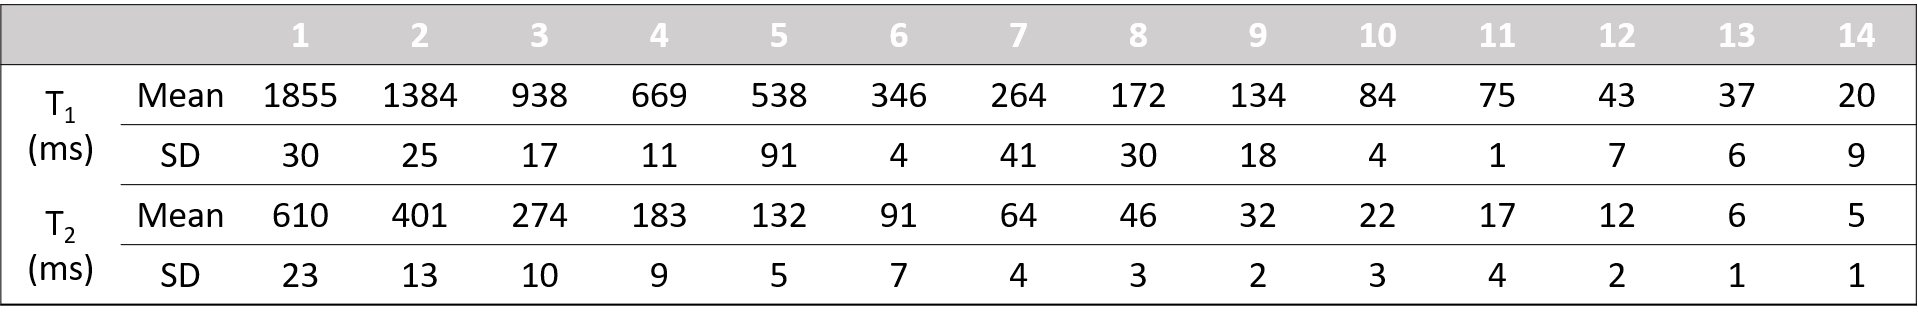
Figure 1: Gold standard measurements: The mean and standard deviation (SD) of T1 estimates of 14 spheres from T1 array using IR-SE method and T2 estimates of 14 spheres from T2 array using SE method.
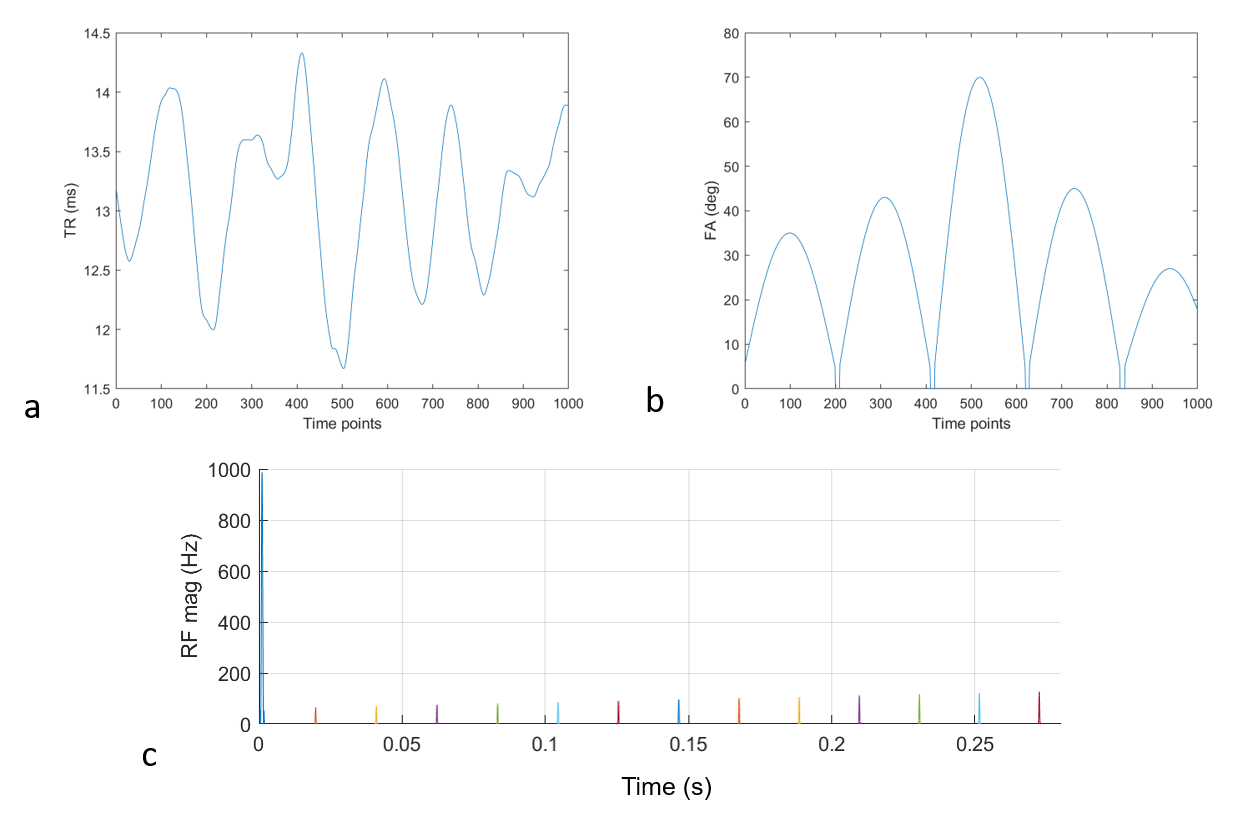
Figure 2: (a) Flip angle (FA) and (b) repetition time (TR) design in OMEGA. The design is identical to the previous MRF design in literature. (c) is the RF magnitude plot of the first 13 pulses implemented using Pulseq. The first pulse is the inversion pulse.
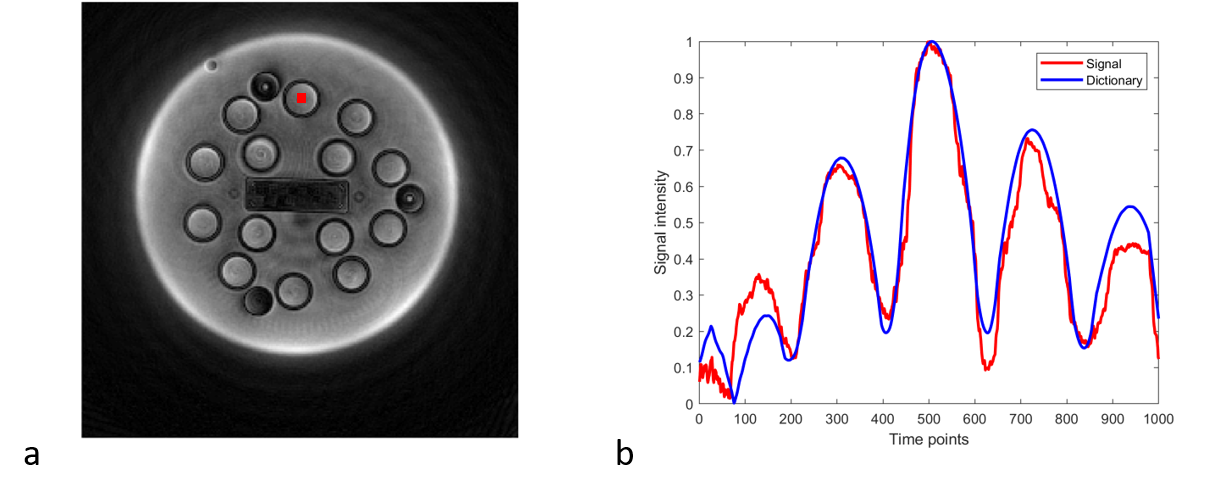
Figure 3: (a) Reconstructed MRF data at time point 500 using sliding window reconstruction. The red square marked the pixel plotted in (b). (b) Comparison of MRF signal evolution of one pixel with its corresponding dictionary entry. The pixel marked in (a) was selected in sphere 1 on T1 array. The corresponding dictionary entry selected was T1 = 1.8 s and T2 = 1.3 s.
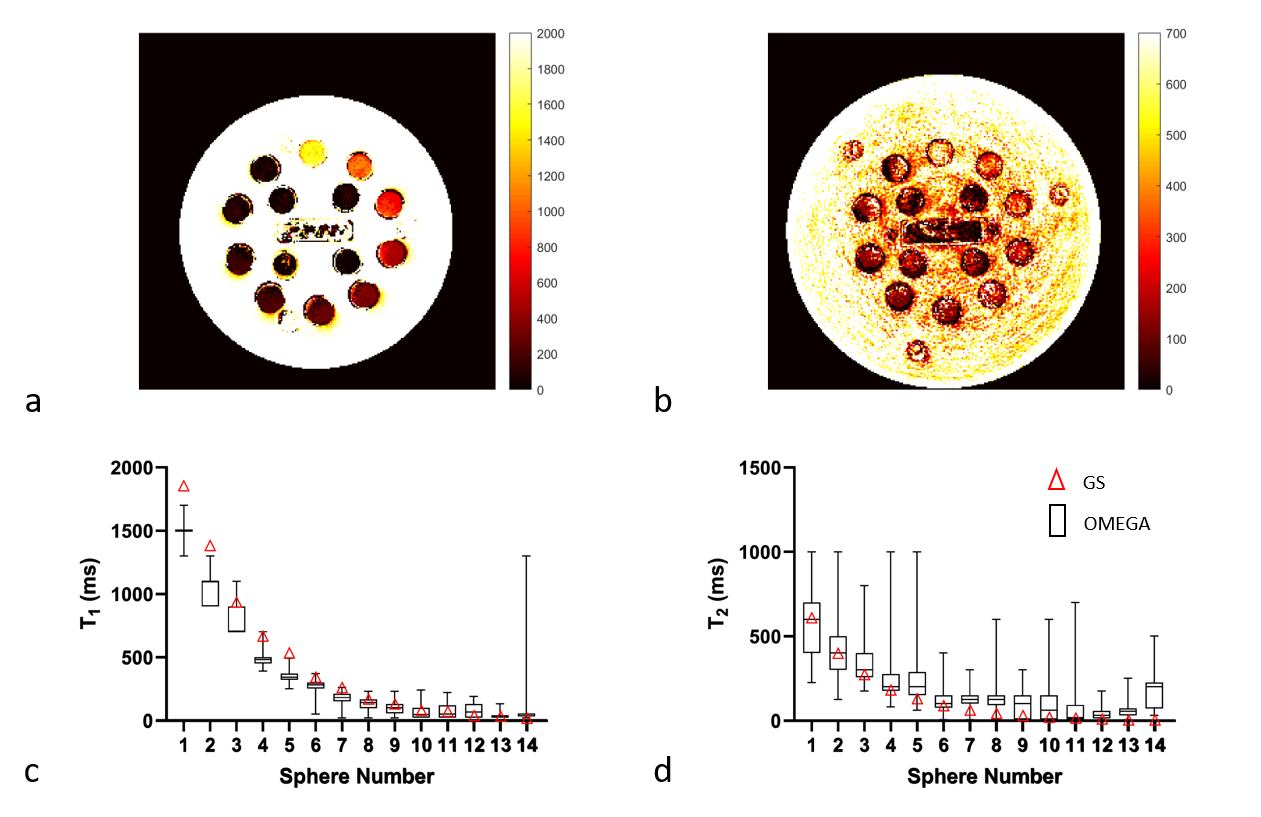
Figure 4: (a) T1 map of T1 array and (b) T2 map of T2 array generated using OMEGA. The units are in ms. The boxplots of min and max for each spheres in (c) T1 spheres and (d) T2 spheres are plotted. The red triangles are the GS values measured using the spin-echo method. The black squares are the data generated using OMEGA.
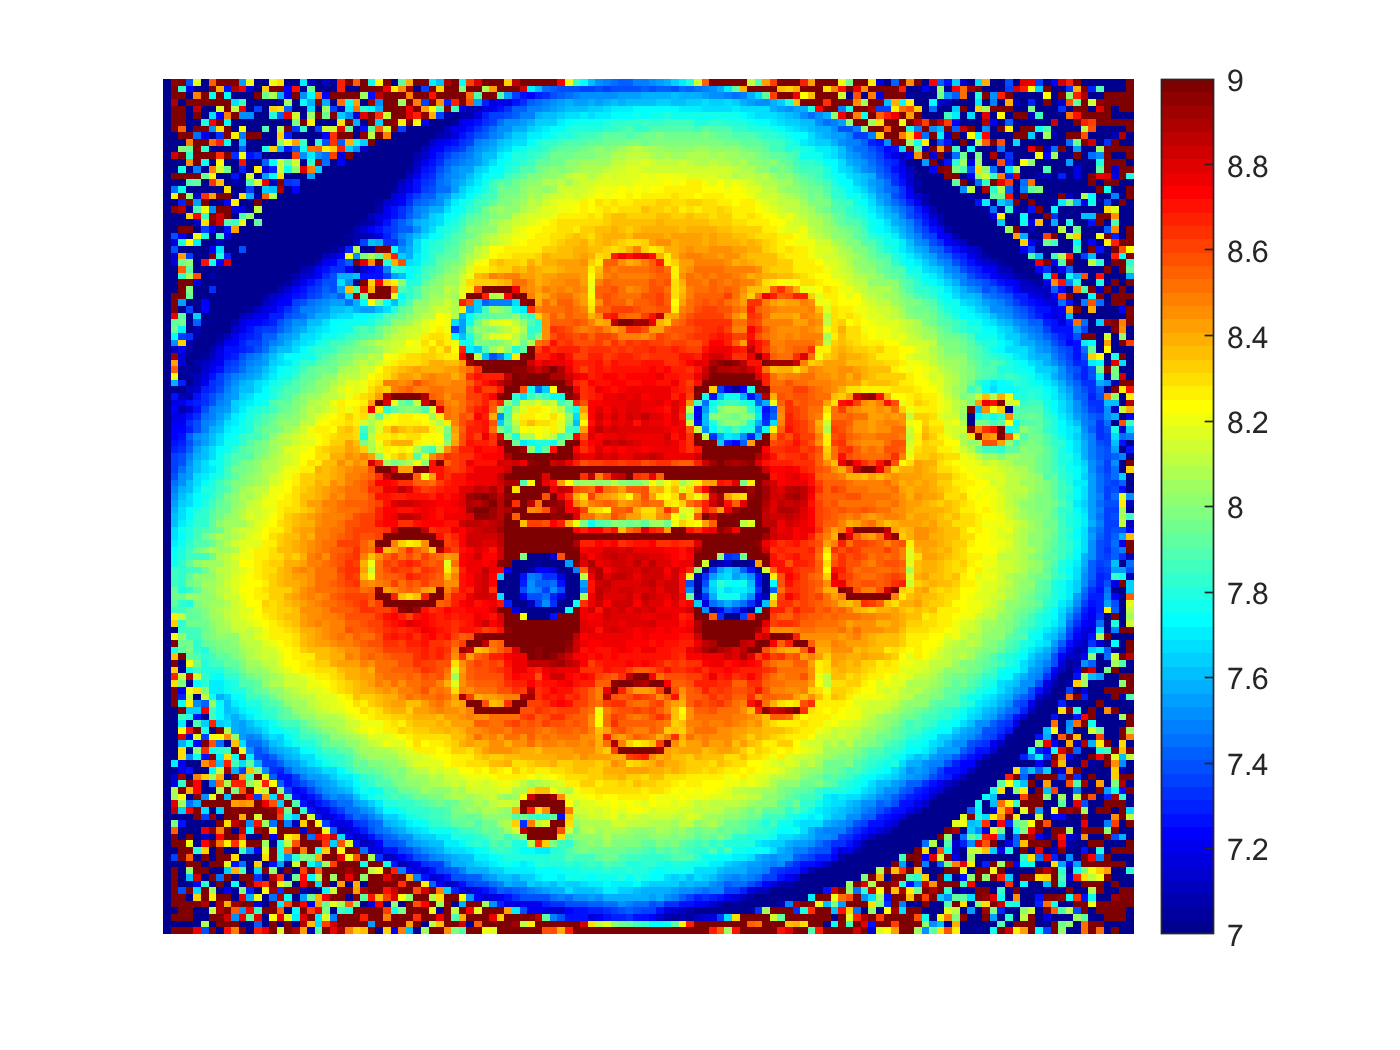
Figure 5: B1 map of T2 array of NIST phantom. The map was acquired using Bloch-Siegert method with a flip angle of 8 degrees. The four spheres with small T2 values experienced lower flip angles compared to other spheres. Spheres 1-8 received higher flip angles.