1569
Rosette MRF for simultaneous T1, T2, and R2* mapping1Biomedical Engineering, University of Michigan, Ann Arbor, MI, United States, 2Radiology, University of Michigan, Ann Arbor, MI, United States
Synopsis
This abstract proposes a method for estimating T1, T2, and R2* values from rosette MRF data. R2* and B0 can be extracted from a series of images generated by subdividing the rosette data into partial readouts, and T1 and T2 are determined using the standard MRF pattern matching pipeline. This method was tested on the ISMRM/NIST MRI system phantom to assess the accuracy of the quantitative relaxation measurements.
Introduction
The rosette trajectory1 is a sampling scheme that crosses the center of k-space multiple times during the acquisition. Recently, the rosette trajectory has been used with cardiac MRF2,3 to enable T1 and T2 mapping with fat or water suppression4. In addition, the multiple k=0 crossings of the rosette trajectory have been used to create individual echo images, which can be used to fit R2*5 and B0 values. While previous work has investigated R2* estimation from Dixon MRF6, this work investigates an alternate sampling method. This abstract proposes an approach for using rosette MRF data for estimation of T1, T2, and R2* properties simultaneously.Methods
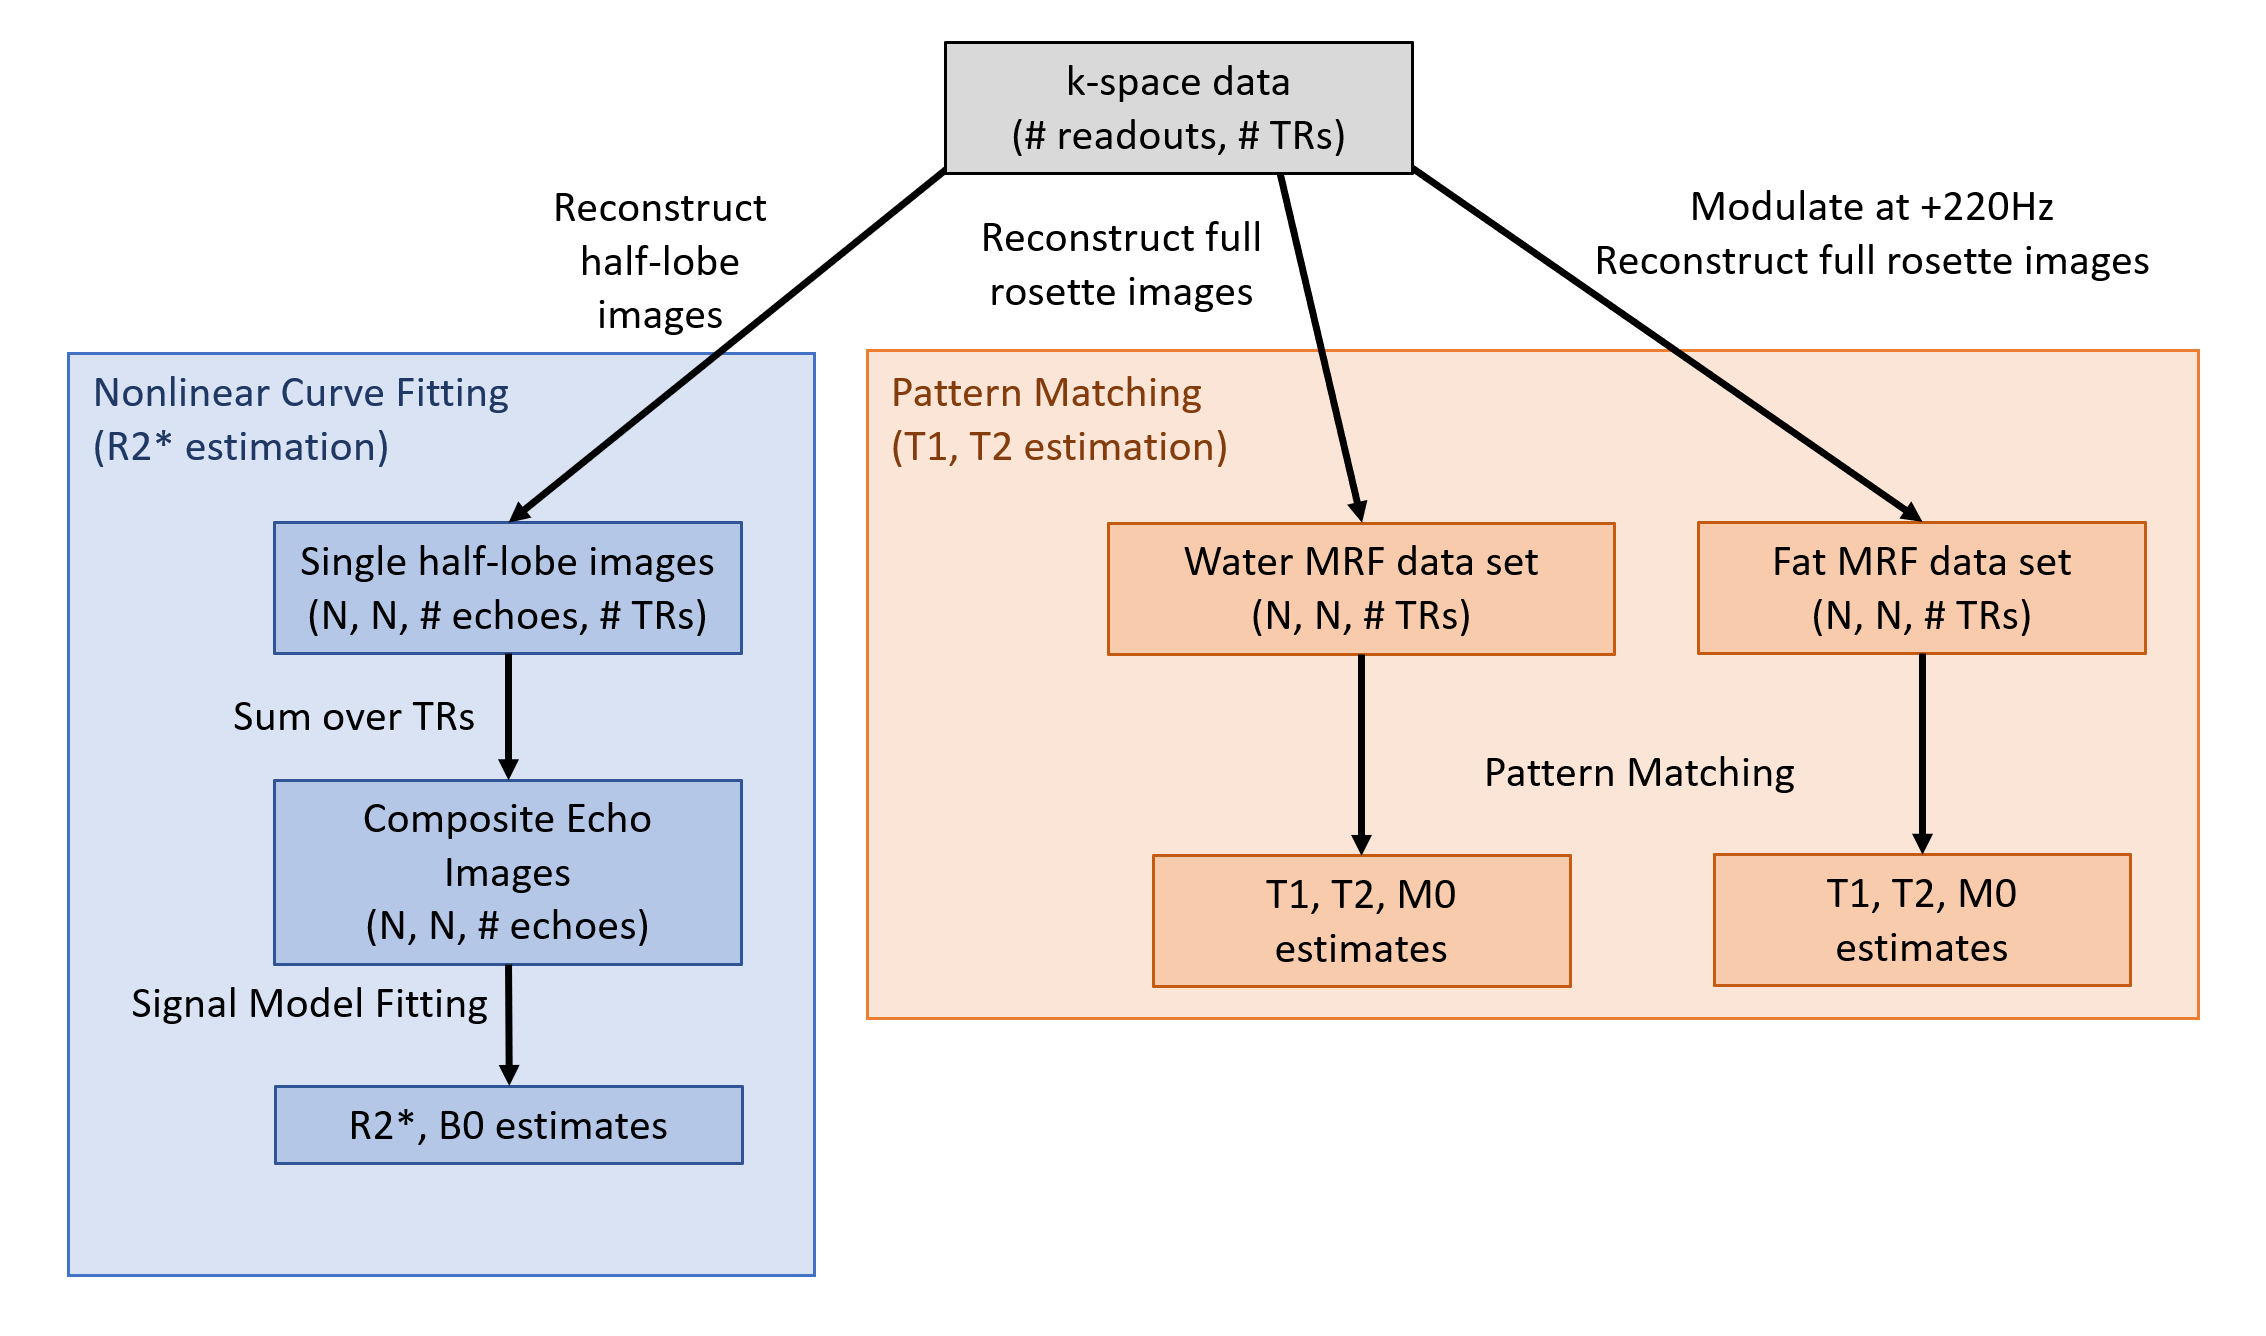
MRF data were acquired on a 1.5T Sola (Siemens Healthineers, Erlangen, Germany) using a five-lobe rosette trajectory. The sequence was based on the cardiac sequence described in 3 and used the following parameters: TR = 17.4 ms, TE (start of sampling) = 1 ms, readout duration = 15.2 ms, 768 repetitions, total scan duration = 14.7 s, flip angles ranging between 4.5° and 15°, 192 x 192 matrix size, and 300 mm2 FOV. Inversion pulses were used with inversion times between 21 and 260 ms to sensitize the signal to T1; T2 prep pulses were used with echo times between 40 and 80 ms. The sequence was run continuously without cardiac gating. Data were acquired on the T2 array of the ISMRM/NIST MRI system phantom. Reference T1 and T2 values were measured using a cardiac MRF sequence with a spiral trajectory, and reference R2* values were measured using a series of 6 gradient echo images with echo time of 2.38n ms for the nth image in the series.Quantitative tissue property maps were reconstructed in a two-step process, shown in Figure 1. The first step of this process is to estimate R2* and B0 values from a set of multi-echo images collected during the rosette readout. First, the rosette trajectory was separated into 10 half-lobes, with effective echo times of 1+3.03n ms for a half-lobe around the nth k=0 crossing, and data from half-lobes was reconstructed using the NUFFT7 to generate 10 images per TR. These images were summed over all TRs to create a set of 10 composite images with different echo times. R2* and B0 values were then fit pixelwise to these composite echo images using a nonlinear least-squares algorithm.
The second step of this process involves applying the MRF pattern matching algorithm to estimate T1 and T2 maps. The reconstruction dictionary was simulated with the following tissue property value ranges for T1 = [50:10:750 775:25:1200 1250:50:3000], T2 = [5:1:50, 55:5:200 210:10:450 475:25:700], B0 = [-15:5:15], and included corrections for slice profile and inversion efficiency8.
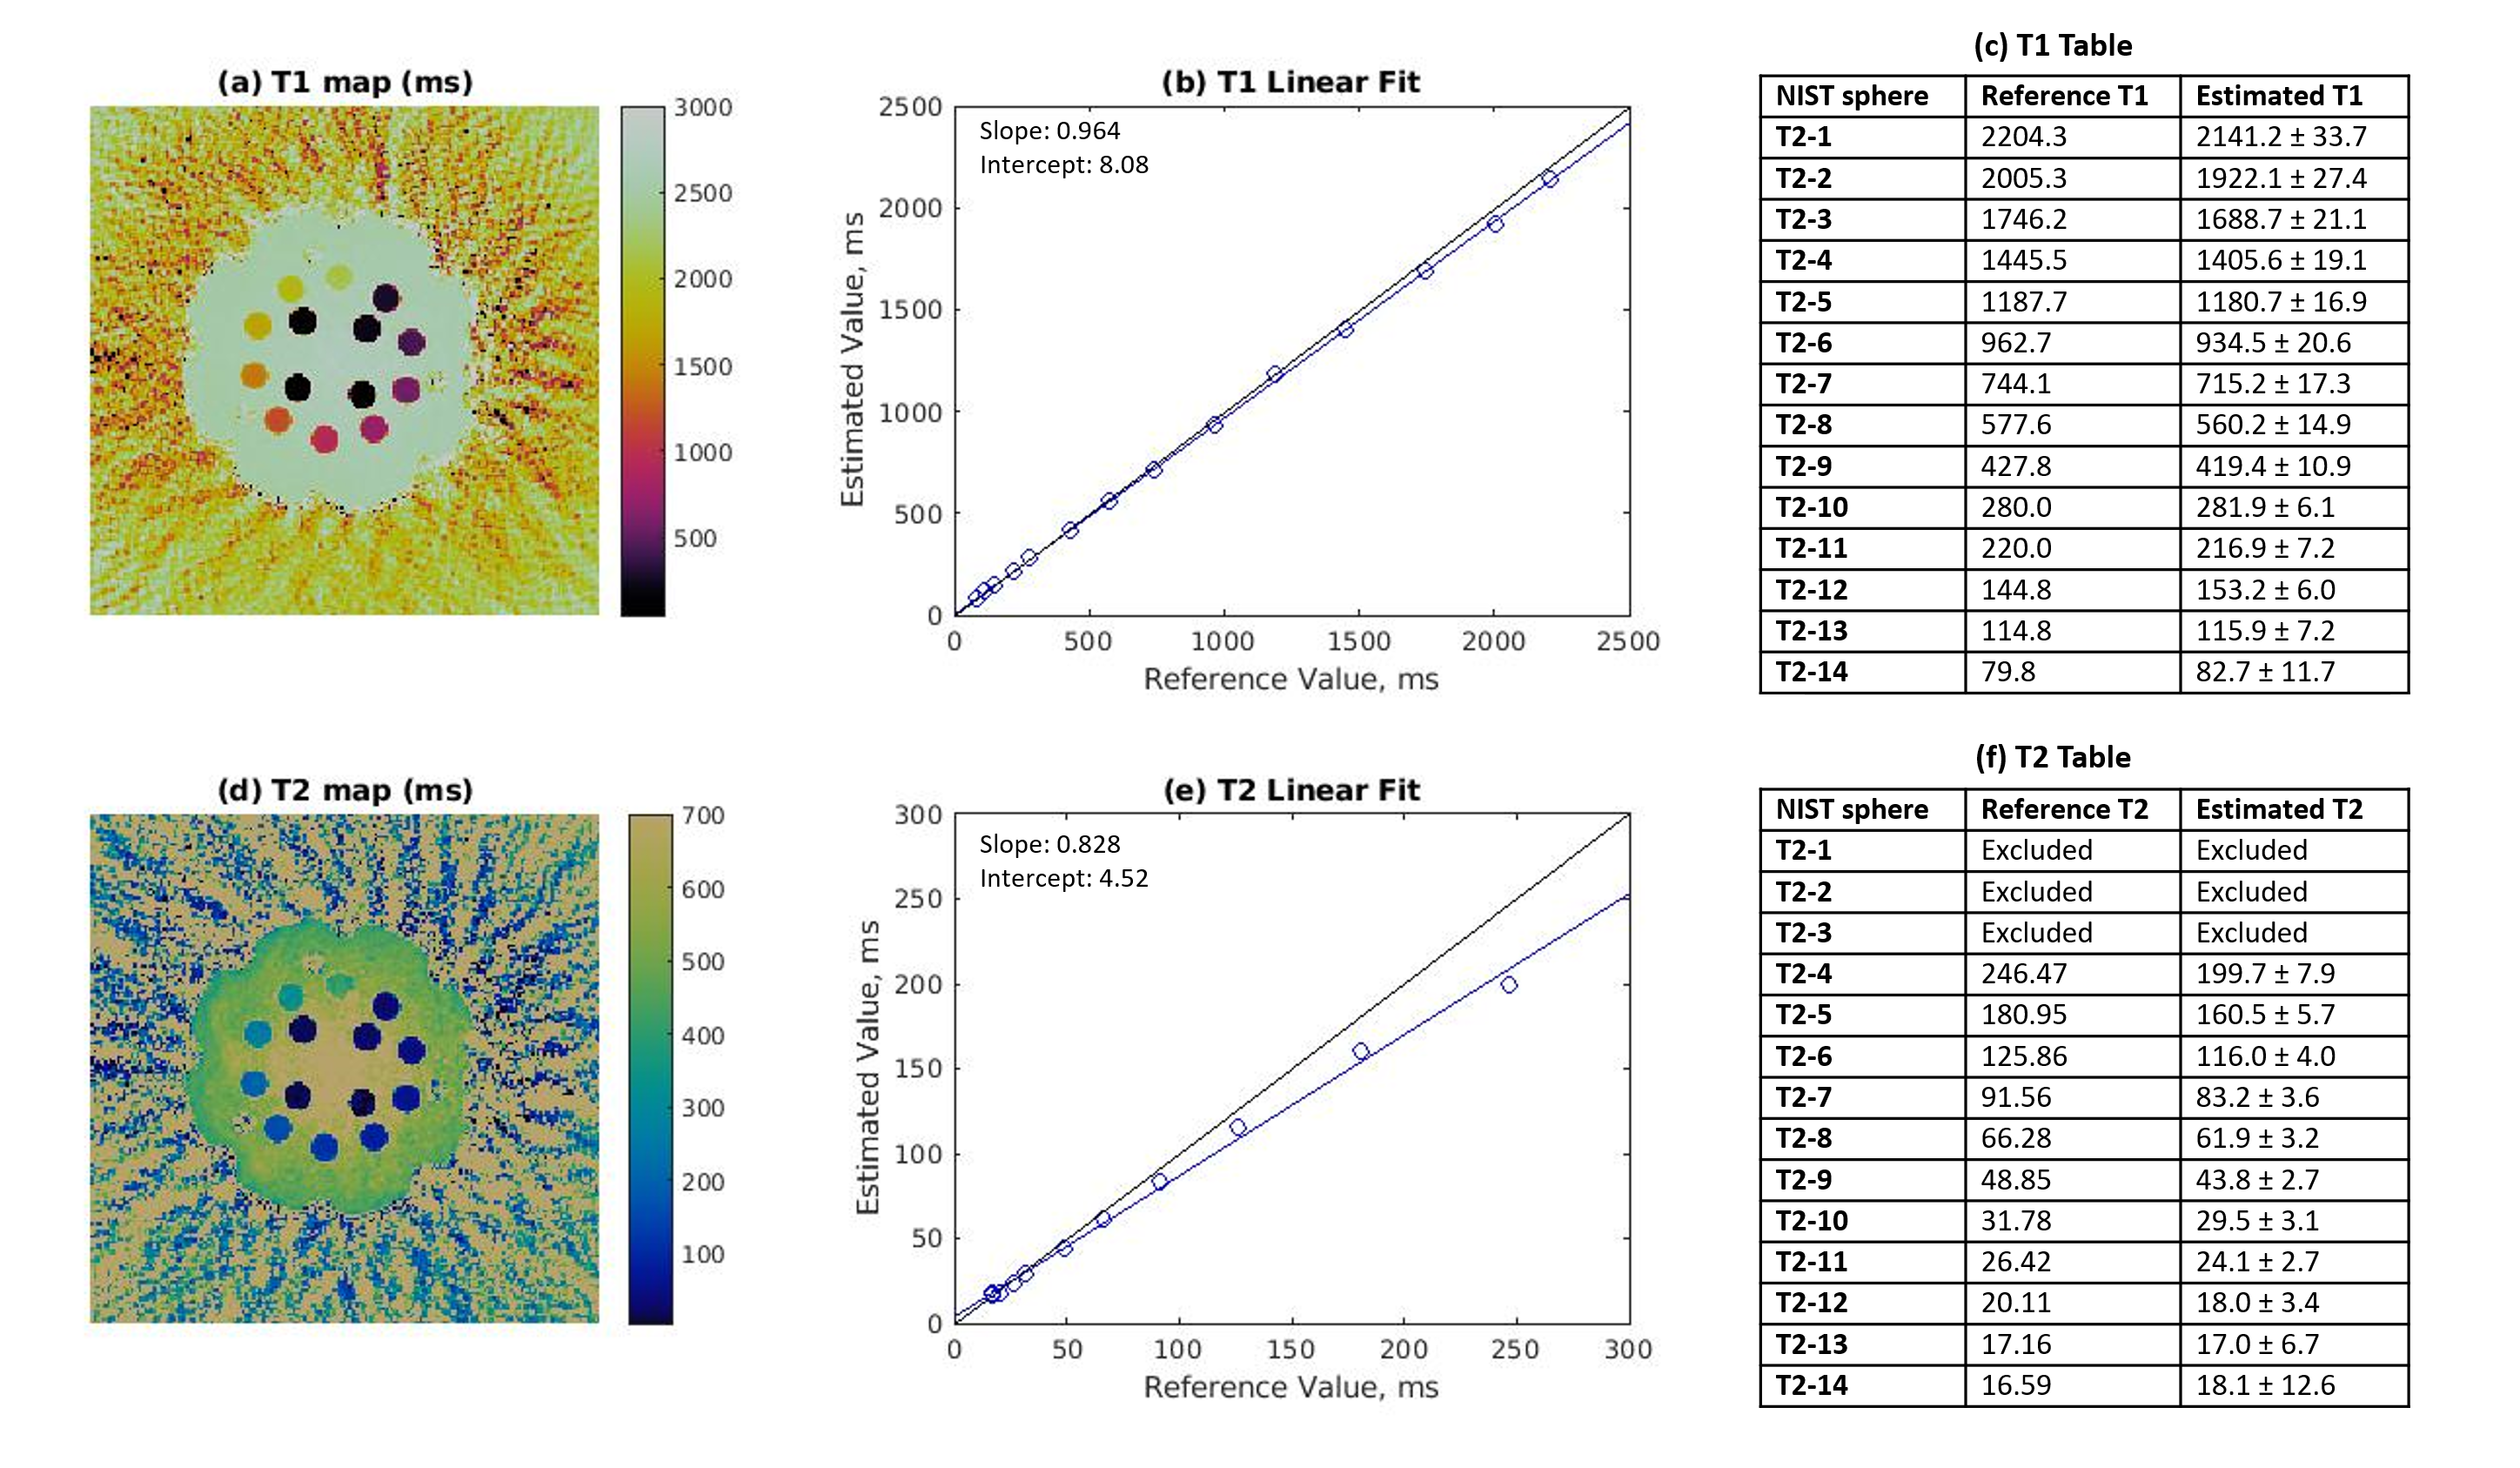
To evaluate the accuracy of the T1, T2, and R2* maps, quantitative values were determined from the mean value of a sphere within the NIST phantom and compared to reference values. Linear regression was performed between estimated and reference values in each case to assess the quality of the estimation. Spheres with T2 values greater than 300 ms were excluded from analysis, as the sequence used was not designed to be sensitive to high T2 values.
Results
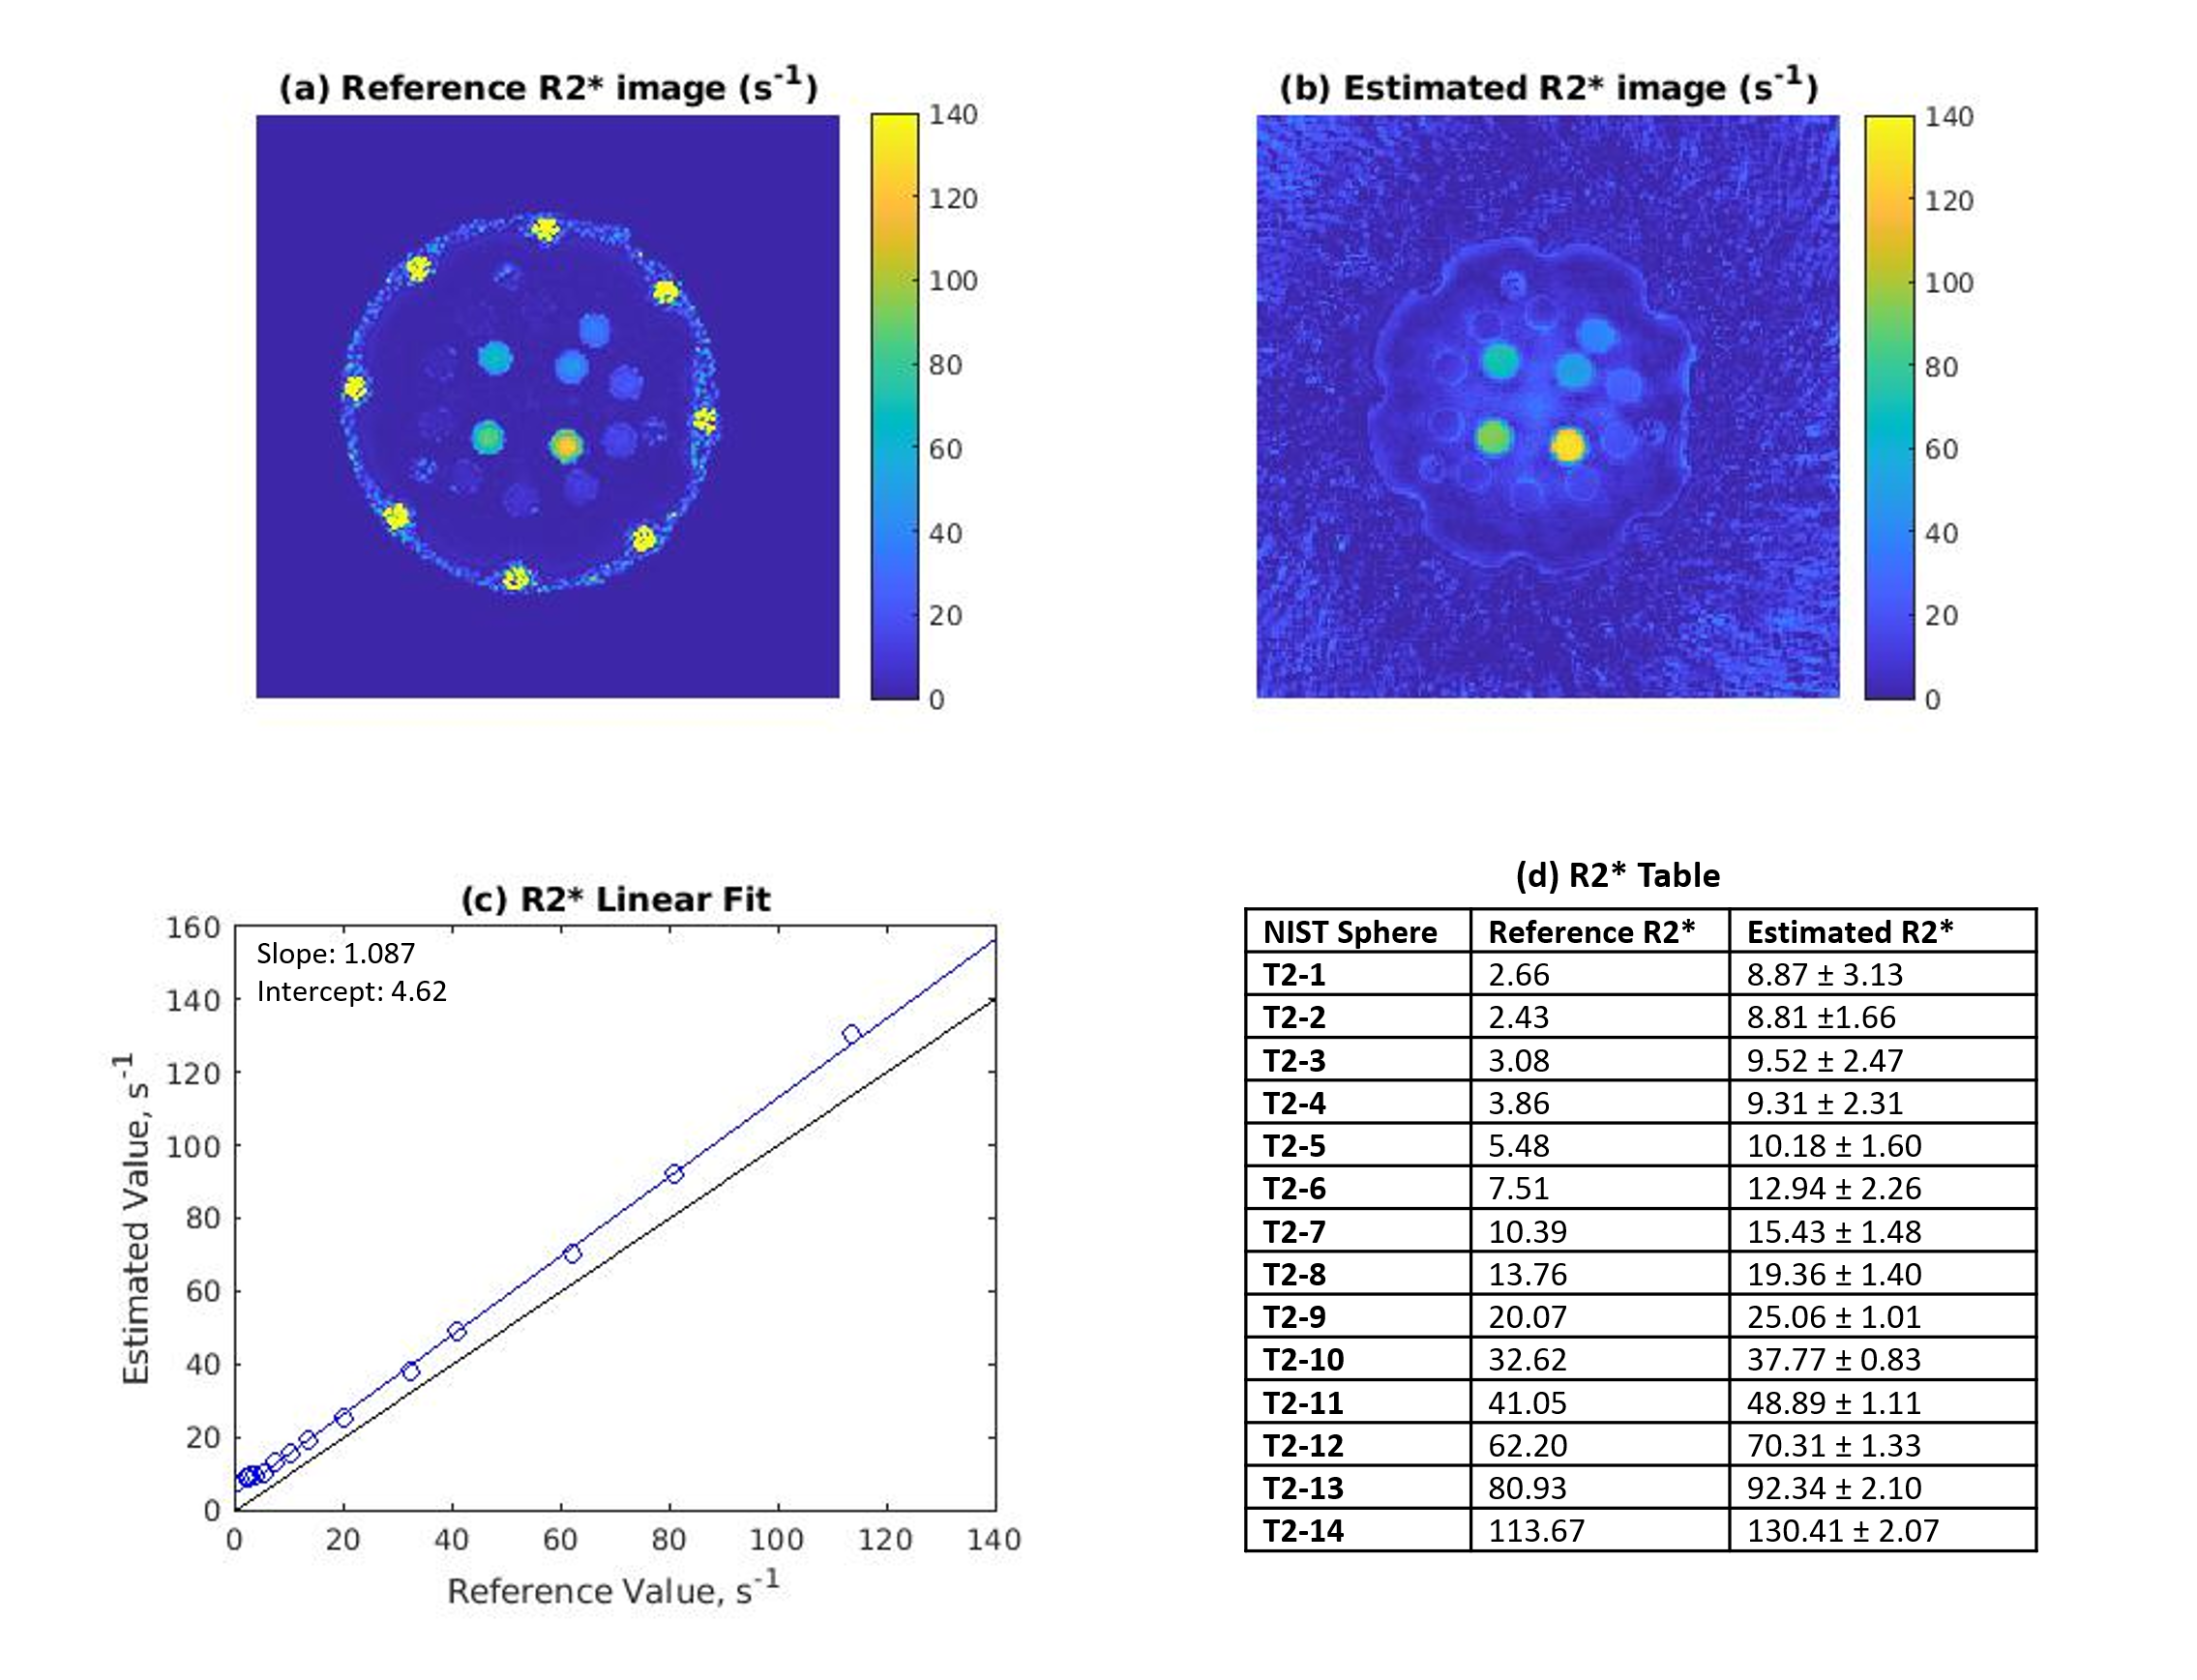
Reference and estimated R2* maps are shown in Figure 2, with a regression plot and table of mean sphere values. For R2* values, the linear regression had a slope of 1.087, and an intercept of 4.62 s-1. T1 and T2 maps, regression plots, and mean sphere values are shown in Figure 3. For T1, the linear regression had a slope of 0.964, and an intercept of 8.08 ms. For T2, the linear regression had a slope of 0.828 and an intercept of 4.52 ms.Discussion
In this work, half-lobes of rosette MRF data were separated and then combined over the acquisition to extract T2* and B0 maps from the rosette data in addition to T1 and T2 maps. While T1 and T2 can be determined using the traditional pattern matching MRF pipeline, R2* is fit as an exponential function of readout time as in more traditional mapping approaches.For R2* values, the linear regression slope of 1.087 indicates that the values measured show the correct trend, although rosette MRF tends to slightly overestimate R2* values compared to the GRE sequence. This effect increases at higher R2* values, which could indicate that the rosette k=0 crossing points do not occur frequently enough with this trajectory to capture rapid T2* decay effects. The regression for T1 shows that this approach offers similar values when compared to spiral MRF; T2 was underestimated as compared to the values measured with spiral MRF, as shown in 4.
The main difference between sequences used in previous work on rosette MRF4 and this approach is the sampling time. A longer rosette was chosen for this work to allow for more T2* decay to occur during the readout, theoretically allowing for more accurate estimation of shorter R2* values. This increased scan time by approximately 70%, but this could likely be reduced depending on desired R2* accuracy and with further research.
Conclusion
R2* and B0 values can be estimated alongside T1 and T2 values when using a rosette readout to collect MRF data.Acknowledgements
NSF/CBET 1553441, NIH/NIDDK 1R01CA208236, NIH/NHLBI R01HL094557, Siemens HealthineersReferences
1. Noll, DC. Multishot Rosette Trajectories for Spectrally Selective MR Imaging. IEEE Trans Med Imaging 1997;16(4):372-377
2. Ma D, Gulani V, Seiberlich N, Liu K, Sunshine JL, Duerk JL, Griswold MA. Magnetic Resonance Fingerprinting. Nature. 2013;495:187-192
3. Hamilton JI, Jiang Y, Chen Y, Ma D, Lo W, Griswold M, Seiberlich N. MR Fingerprinting for Rapid Quantification of Myocardial T1, T2, and Proton Spin Density. Magn Reson Med. 2017;77:1446-1458
4. Liu Y, Hamilton J, Eck B, Griswold M, Seiberlich N. Myocardial T1 and T2 quantification and water-fat separation using cardiac MR fingerprinting with rosette trajectories at 3T and 1.5T. Magn Reson Med. 2021;85:103-119
5. Bush AM, Sandino CM, Ramachandran S, et al. Rosette Trajectories Enable Ungated, Motion Robust, Simultaneous Cardiac and Liver T2* Iron Assessment. J Magn Reson Imaging. 2020;52(6):1688-1698
6. Jaubert O, Arrieta C, Cruz G, Bustin A, et al. Multi-parametric liver tissue characterization using MR fingerprinting: Simultaneous T1, T2, T2*, and fat fraction mapping. Magn Reson Med. 2020;84:2625-2635
7. Fessler JA, Sutton BP. Nonuniform fast Fourier transforms using min-max interpolation. IEEE Trans Signal Processing. 2003;51:560-574
8. Hamilton JI, Jiang Y, Ma D, Lo W, et al. Investigating and reducing the effects of confounding factors for robust T1 and T2 mapping with cardiac MR fingerprinting. Magn Reson Imaging 2018;53:40-51
Figures