1565
Multi-Resolution MR Fingerprinting: High-Resolution Maps from a Combination of High- and Low-Resolution Data1Department of Radiology, University of Michigan, Ann Arbor, MI, United States
Synopsis
Increasing the spatial resolution of MR Fingerprinting can result in longer acquisition times due to the need to sample a larger extent of k-space. In this work, a novel data sampling scheme consisting of interleaved high- and low-resolution spiral trajectories is introduced to achieve high-resolution maps during a shortened acquisition time, which could have advantages for sequences that require a breath-hold.
Introduction
MR Fingerprinting1 (MRF) is an imaging technique that yields quantitative maps of multiple tissue properties from a single rapid acquisition. Typically, high-resolution property maps require acquisition patterns that collect high spatial resolution data, or a larger extent of k-space. These acquisition patterns require more data sampling time, thereby extending the scan time. However, the individual images used for MRF contain only a fraction of the total k-space data and, therefore, high spatial resolution data may not need to be acquired at every time point to enable higher resolution mapping. In this work we explore the combination of low- and high-resolution data to generate high resolution maps with a smaller increase in scan time as compared to the collection of all high-resolution data.Methods
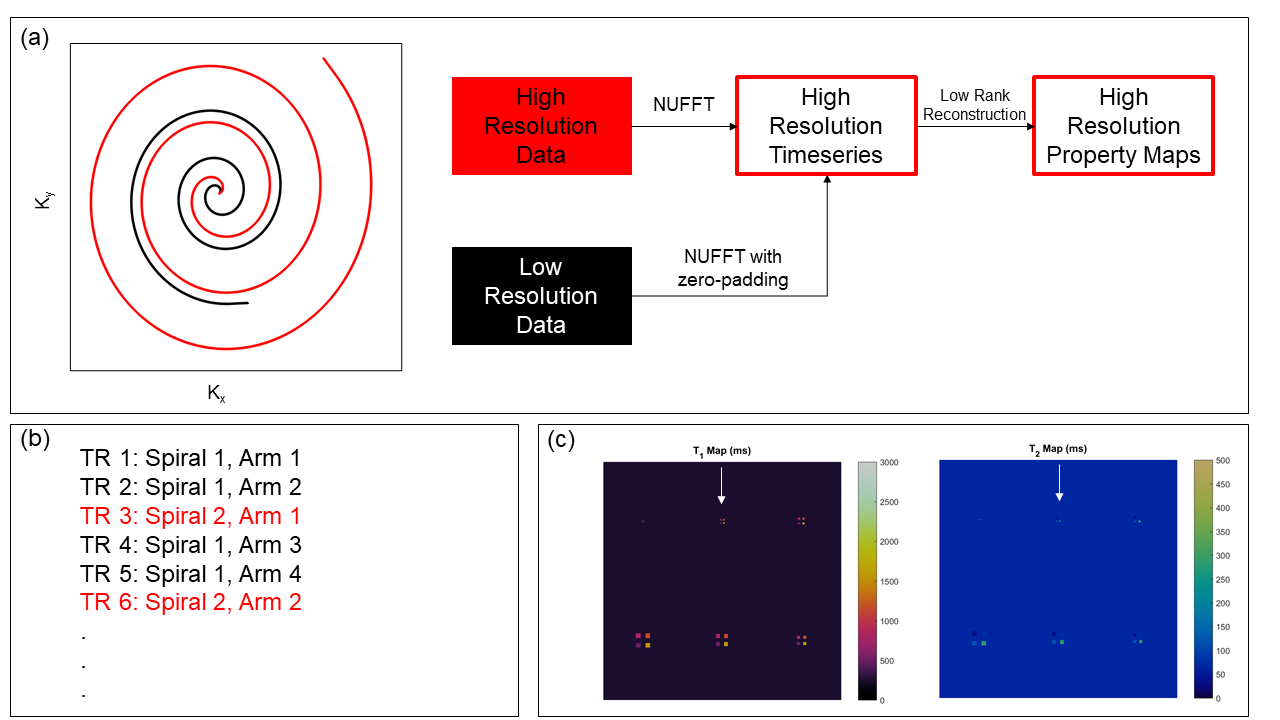
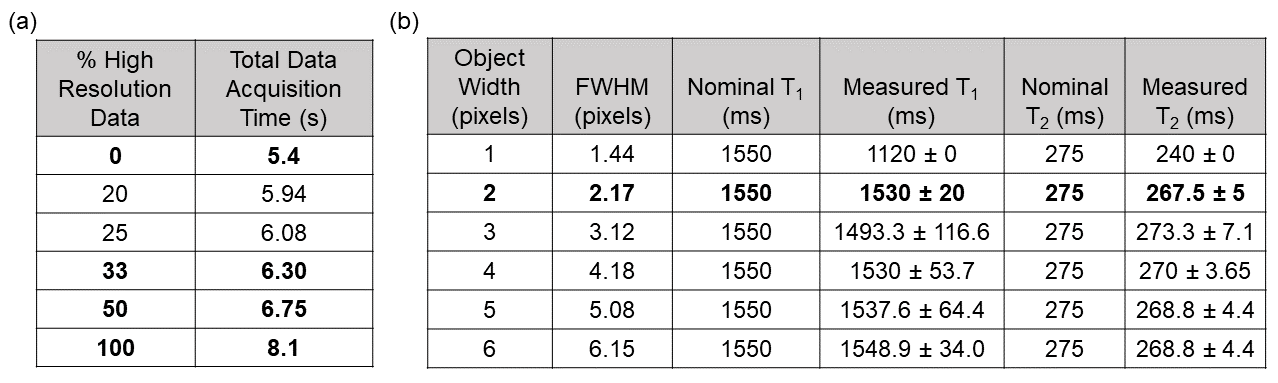
This study employed a 2D FISP MRF sequence2 with 1000 TRs and an initial adiabatic inversion. Two 48-arm spirals with FOV=300mm2 were designed: (1) a lower-resolution variable density spiral with an undersampling factor of 24 in the central 25% of k-space and 48 at the periphery of k-space, matrix size 192x192, resolution 1.6x1.6mm2, readout duration 2.9ms, and minimum TR 5.4ms; and (2) a higher-resolution uniform density spiral with an undersampling factor of 48, matrix size 300x300, resolution 1.0x1.0mm2, readout duration 5.6ms, and minimum TR 8.1ms. During the MRF acquisition, the low- and high-resolution spirals are interleaved, and the number of higher resolution spirals varied to assess the effect on image resolution. Figure 1(b) shows an example where 33% of the MRF images (i.e., every third TR) are collected using the high-resolution spiral. The non-uniform fast Fourier transform (NUFFT) was used to grid the spiral k-space data to yield a time series of undersampled images. The low-resolution spiral data were zero-padded in k-space to yield a matrix size of 300x300 to match that of the high-resolution data. Figure 1(a) shows the reconstruction pipeline. For each pulse sequence, a dictionary with 4,966 atoms was calculated for T1 values [10:10:90,100:20:1000,1040:40:2000,2050:50:3000] and T2 values [2:2:8,10:5:100,110:10:300,350:50:1100]. Maps were generated using a low-rank reconstruction3 followed by inner product matching with the dictionary.The proposed method was evaluated in two simulation experiments. First, a resolution phantom was generated as shown in Figure 1(c) with a matrix size of 300x300. It contained six clusters of four equal-sized squares with widths ranging from one to six pixels, each with different T1 and T2 values; the surrounding pixels were set to T1=250ms, T2=68ms. Six different acquisition schemes were simulated, where a different fraction of MRF time points were sampled using the high-resolution spiral (100, 50, 33, 25, 20, and 0%). All acquisitions employed 1000 TRs; however, the total scan times varied due to the differences in spiral readout duration. Maps were assessed by measuring the mean T1 and T2 values from each square in the 2x2 square cluster and the 10x10 pixel surrounding background. For the 33% mixed-resolution sequence, the T1 and T2 values and full-width at half-maximum (FWHM) were measured for one square of each size cluster to quantify spatial blurring. Second, to assess the sensitivity to off-resonance blurring, FWHM of the point spread function (PSF) for all six acquisition schemes was calculated from the sum of the undersampled MRF images over time using a point object phantom (assuming infinite relaxation times) for off-resonance values of 0 Hz, 50 Hz, and 150 Hz.
Results
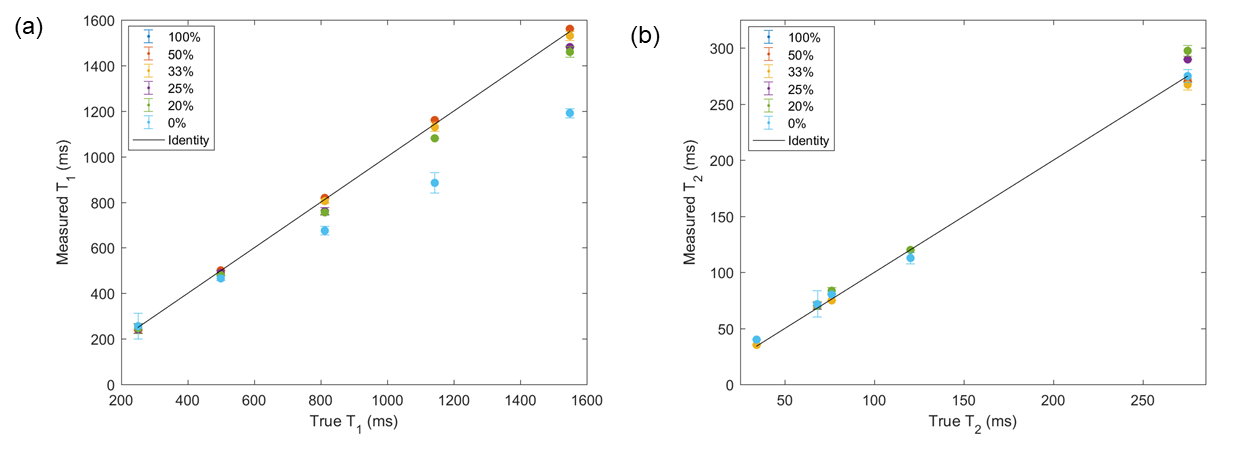
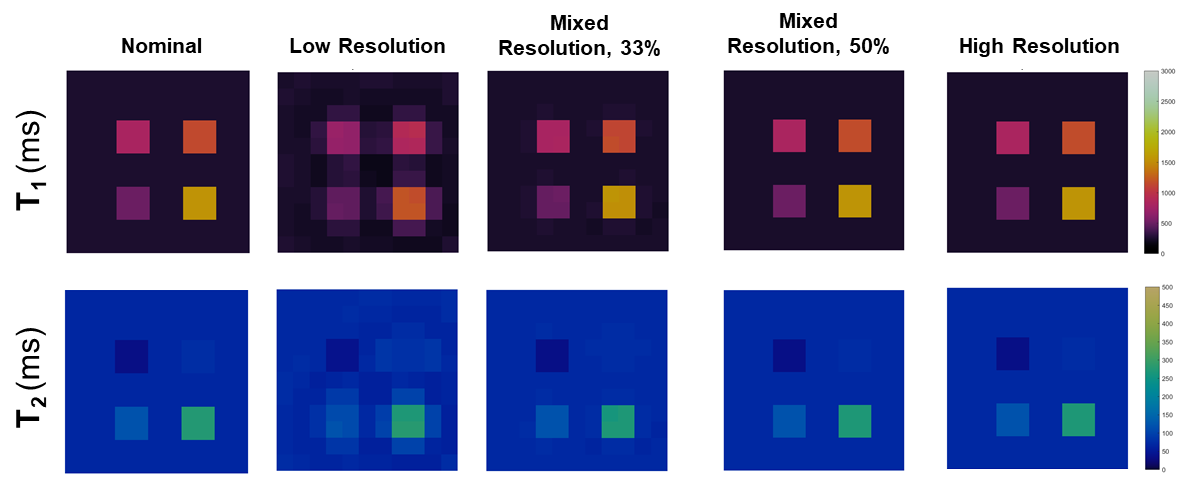
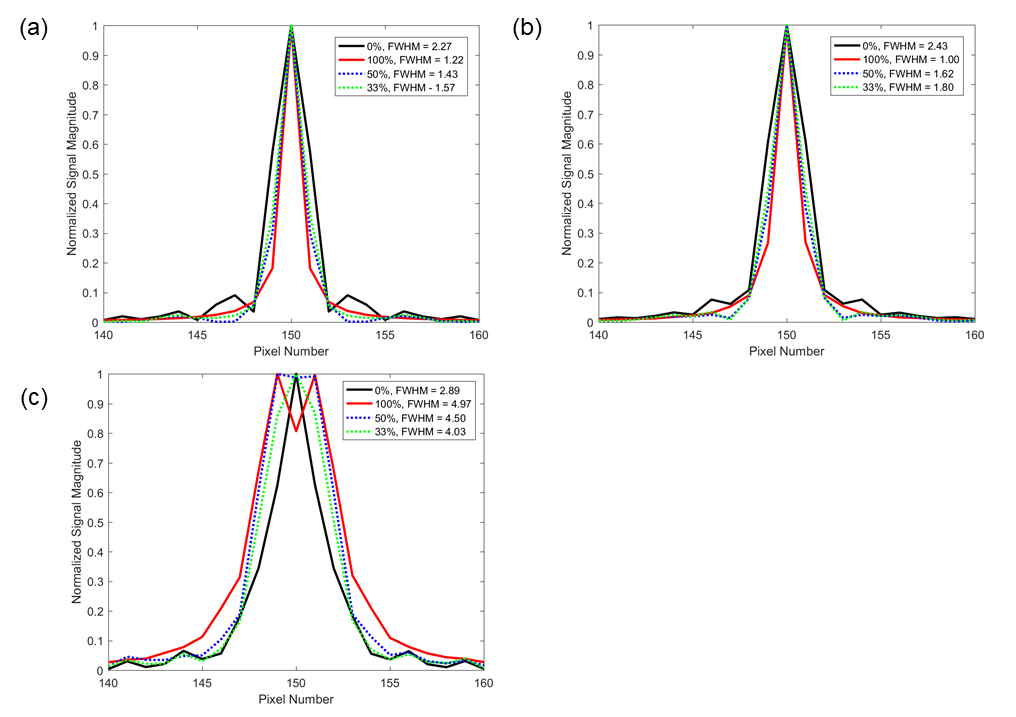
The simulation results (Figures 2-4) show that high-resolution 1.0x1.0mm3 MRF maps can be collected in 22% less time (6.3 seconds) using the proposed mixed-resolution spiral sampling compared to a conventional high-resolution spiral trajectory (8.1 seconds). Acquiring at least 33% of the data at high-resolution yields accurate T1 and T2 measurements and minimal blurring in small objects, as shown in Figures 2, 3, and 4(b). Acquiring less than 33% high-resolution data results in decreased T1 values, as shown in Figure 2(a).High-resolution spirals with longer durations may cause image blurring in the presence of off-resonance. Figure 5 shows the PSF for low-, high-, and mixed-resolution acquisitions at various off-resonance frequencies. For off-resonance frequencies close to 0 Hz, the 33% mixed-resolution acquisition provides improved spatial resolution (FWHM=1.57 pixels) compared to the low-resolution acquisition (FWHM=2.27 pixels). At larger off-resonance frequencies near 150 Hz, the off-resonance blurring dominates over the gain in nominal spatial resolution; the FWHMs of all scans using the high-resolution acquisition are larger than that of the low-resolution acquisition.
Discussion
Using a combination of low-resolution and high-resolution data for MRF can yield high-resolution maps with a shorter acquisition time than when collecting all high-resolution data. Acquiring at least 33% of the data with a high-resolution spiral yields maps with accurate property values and minimal resolution loss. In contrast, simply zero-padding low-resolution data to increase the matrix size results in substantial blurring and inaccurate maps, most likely due to partial volume artifacts. While mixed-resolution spirals may provide higher-resolution maps in the absence of off-resonance, a deblurring algorithm may be necessary to mitigate spiral blurring to achieve higher resolutions in the presence of off-resonance.Conclusion
A data sampling scheme for MRF is introduced consisting of interleaved high- and low-resolution spiral trajectories, which can decrease the acquisition time needed to collect high-resolution tissue property maps.Acknowledgements
Research support from Siemens Healthineers and NIH grant R01 HL 094557-10.References
[1] D. Ma et al., “Magnetic resonance fingerprinting,” Nature, vol. 495, no. 7440, pp. 187–192, 2013.
[2] Y. Jiang, D. Ma, N. Seiberlich, V. Gulani, and M. A. Griswold, “MR fingerprinting using fast imaging with steady state precession (FISP) with spiral readout,” Magn. Reson. Med., vol. 74, pp. 1621–1631, 2015.
[3] J. I. Hamilton et al., “Simultaneous multislice cardiac magnetic resonance fingerprinting using low rank reconstruction,” NMR Biomed., vol. 32, no. 2, Feb. 2019.
Figures