1557
Abdominal Water/Fat Separated MR Fingerprinting on a Lower-Field 0.75T MRI1University and ETH Zurich, Zurich, Switzerland, 2Philips Research, Hamburg, Germany, 3Leiden University Medical Center, Leiden, Netherlands
Synopsis
We have investigated the feasibility of concurrent water/fat separation and T1/T2 mapping using spoiled FISP-MR Fingerprinting on a lower-field 0.75T MRI. Water/fat separation is performed in k-space and combined with seven-peak fat-spectrum deblurring and B0-deblurring using multi-frequency interpolation. Matching is performed for water and fat separately and takes B1+ inhomogeneities into account. At 0.75T, T1 was 491ms (liver), 911ms (spleen), 958ms (kidney), 744ms (muscle), and 195ms (fat); and T2 was 77ms (liver), 91ms (spleen), 111ms (kidney), 50ms (muscle), and 105ms (fat).
Introduction
In recent years, lower-field MRI (0.1…1T) has received considerable interest as a potential cost-effective, yet high-quality and -performance imaging modality.1 Quantitative parameter mapping using MR fingerprinting might especially profit from lower-field as confounders including B0 and B1+ inhomogeneity are reduced while T2* is prolonged.2 Feasibility of spoiled FISP-MRF for brain and abdominal applications was recently demonstrated on a lower-field MRI (0.55T) system.2 In the present work, we investigate the feasibility of combining FISP-MRF with chemical shift-based water/fat separation for concurrent water/fat imaging and T1/T2 estimation in the abdomen using a lower-field 0.75T MRI.Methods
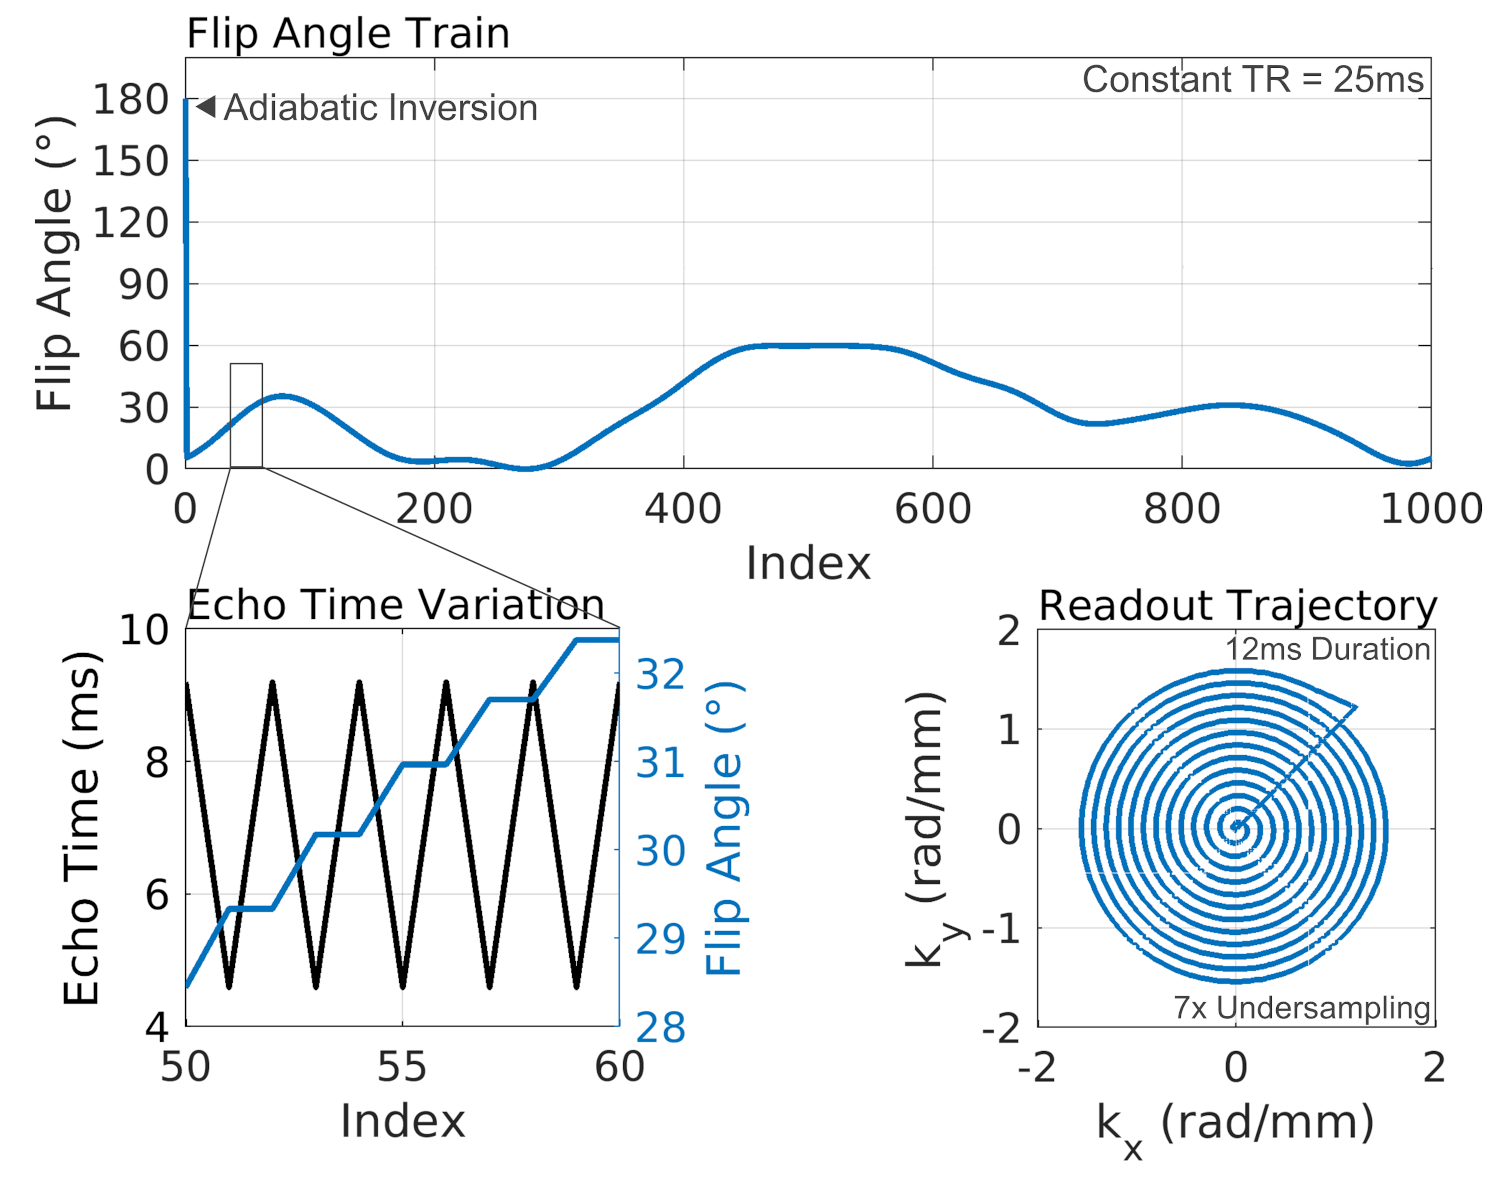
We exploited the Carbon-13 channels of the multi-nuclei interface of a 3T Philips Achieva system (Best, The Netherlands) to measure proton magnetization at a quarter of the nominal field strength i.e. at 0.75T. A double Helmholtz volume transmitter and a four-channel receive array (Clinical MR Solutions, Brookfield, WI, USA) was used for excitation and signal reception.We performed FISP-MRF3 combined with a two-point Dixon-like acquisition as published by Koolstra et al. in the abdomen of one healthy volunteer.4 A 500-point constant-TR spiral MRF sequence was modified to acquire the same flip angle twice in an “interleaved fashion” alternating between in- (4.605 ms) and out-phase (9.21 ms) echo times (water/fat shift at 0.75T: approx. 108 Hz) resulting in an effective fingerprinting train of 1000 shots and utilizing a fixed repetition time of 25 ms (Figure 1). An Archimedean spiral with seven-fold undersampling, 12 ms readout duration, field-of-view of 350 mm, and 2 mm in-plane resolution was employed. Slice thickness was chosen as 8 mm as a trade of between SNR and resolution (Figure 1), resulting in a single train water-fat resolved MRF of 25s duration.
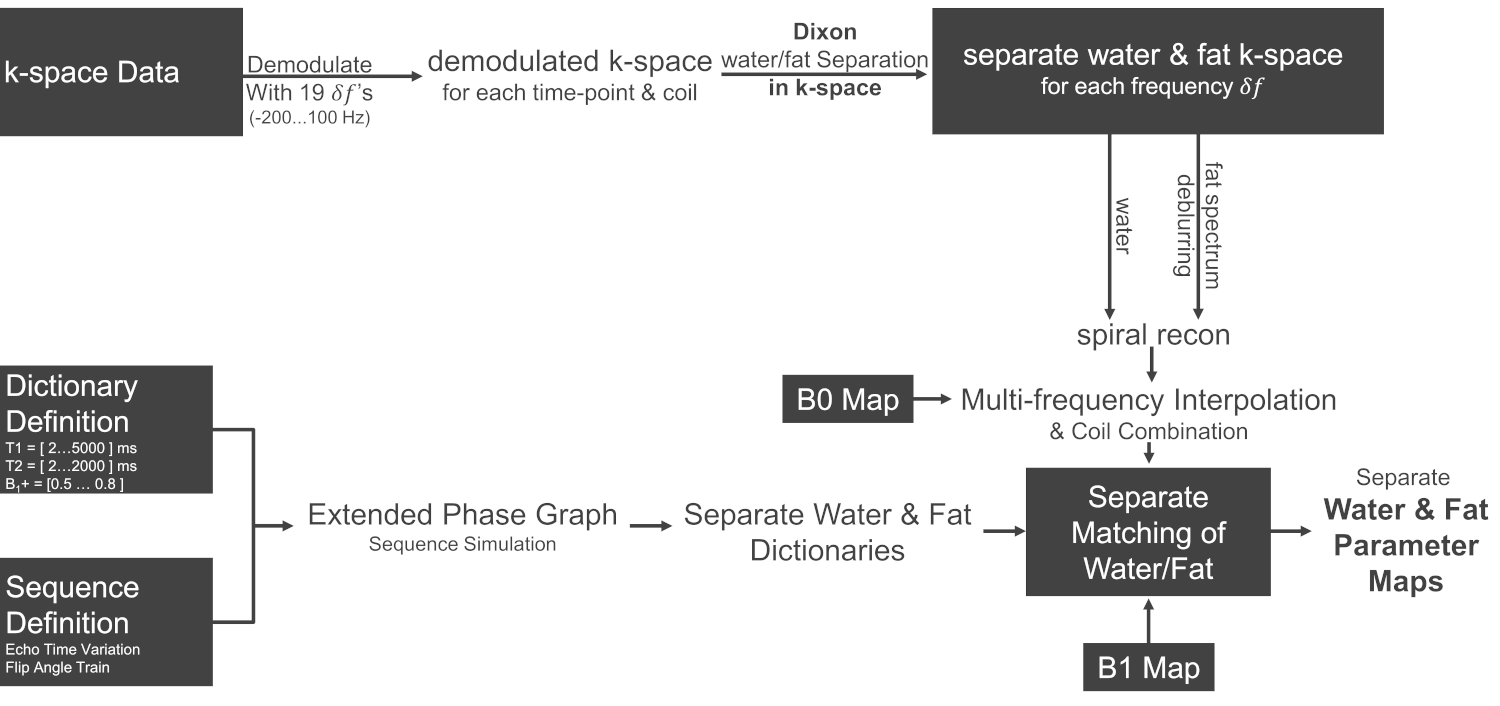
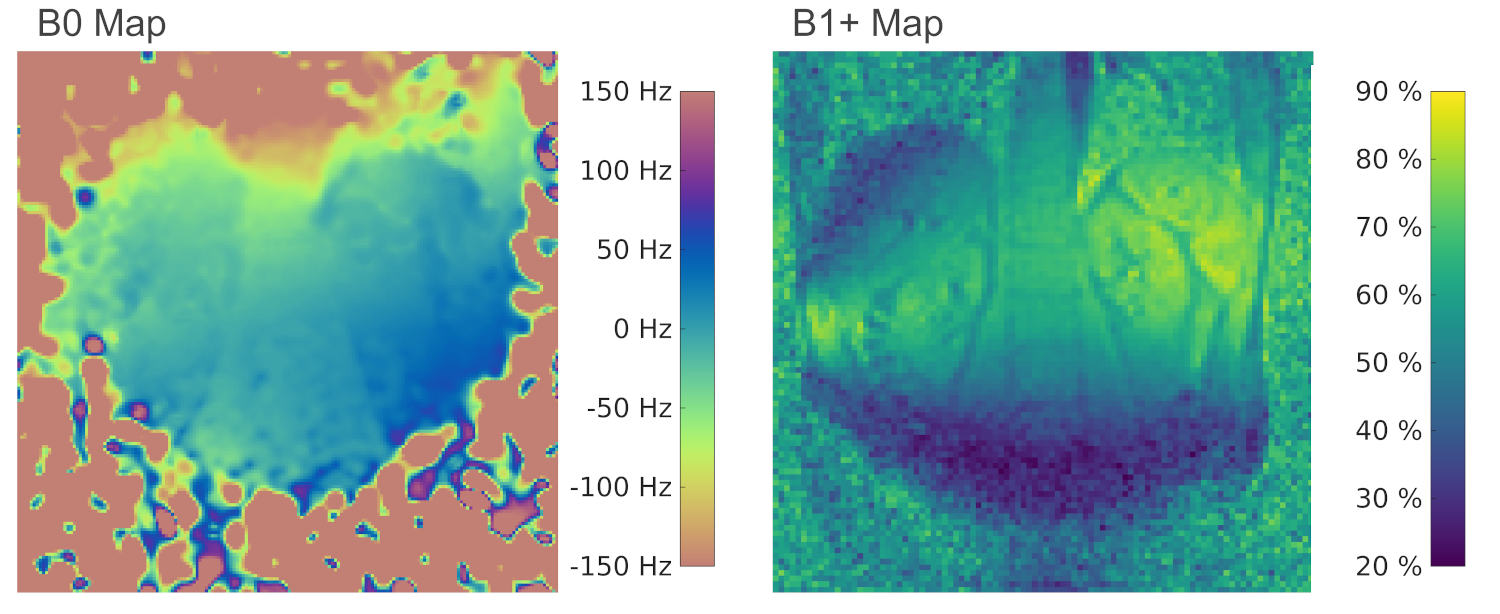
Reconstruction of the MRF data was performed in MATLAB 2018a (Mathworks, Natick, MA, USA) using MRecon (GyroTools LLC, Winterthur, Switzerland) as shown in Figure 2. Water/fat separation was performed in k-space and the fat-channel was deblurred using a seven-peak fat-spectrum.5,6 B0 blurring was corrected for using multi-frequency interpolation and a separately acquired B0 map (Figure 3).7
The dictionary was created using the extended phase graph formalism8 and obtained for a range of T1 values of [2:2:100, 100:10:1000, 1000:20:2000, 2000:40:5000] ms and T2 values of [2:2:150, 150:10:500, 500:20:1000, 1000:40:2000] ms. Transmit field inhomogeneities were corrected for by measuring a separate B1+ map using DREAM9 (Figure 3) and accounting for it in the dictionary simulation using B1+ values of 50% to 80% in 5% point steps. Separate dictionaries for water and fat were obtained by summing and subtracting subsequent signals, resulting in two, 500-point time series. Matching was then performed for water and fat separately to obtain T1 and T2 maps.4 To reduce computational complexity, the dictionaries were calculated with a B1+ resolution of 5% and linearly interpolated to intermediate B1+ values.
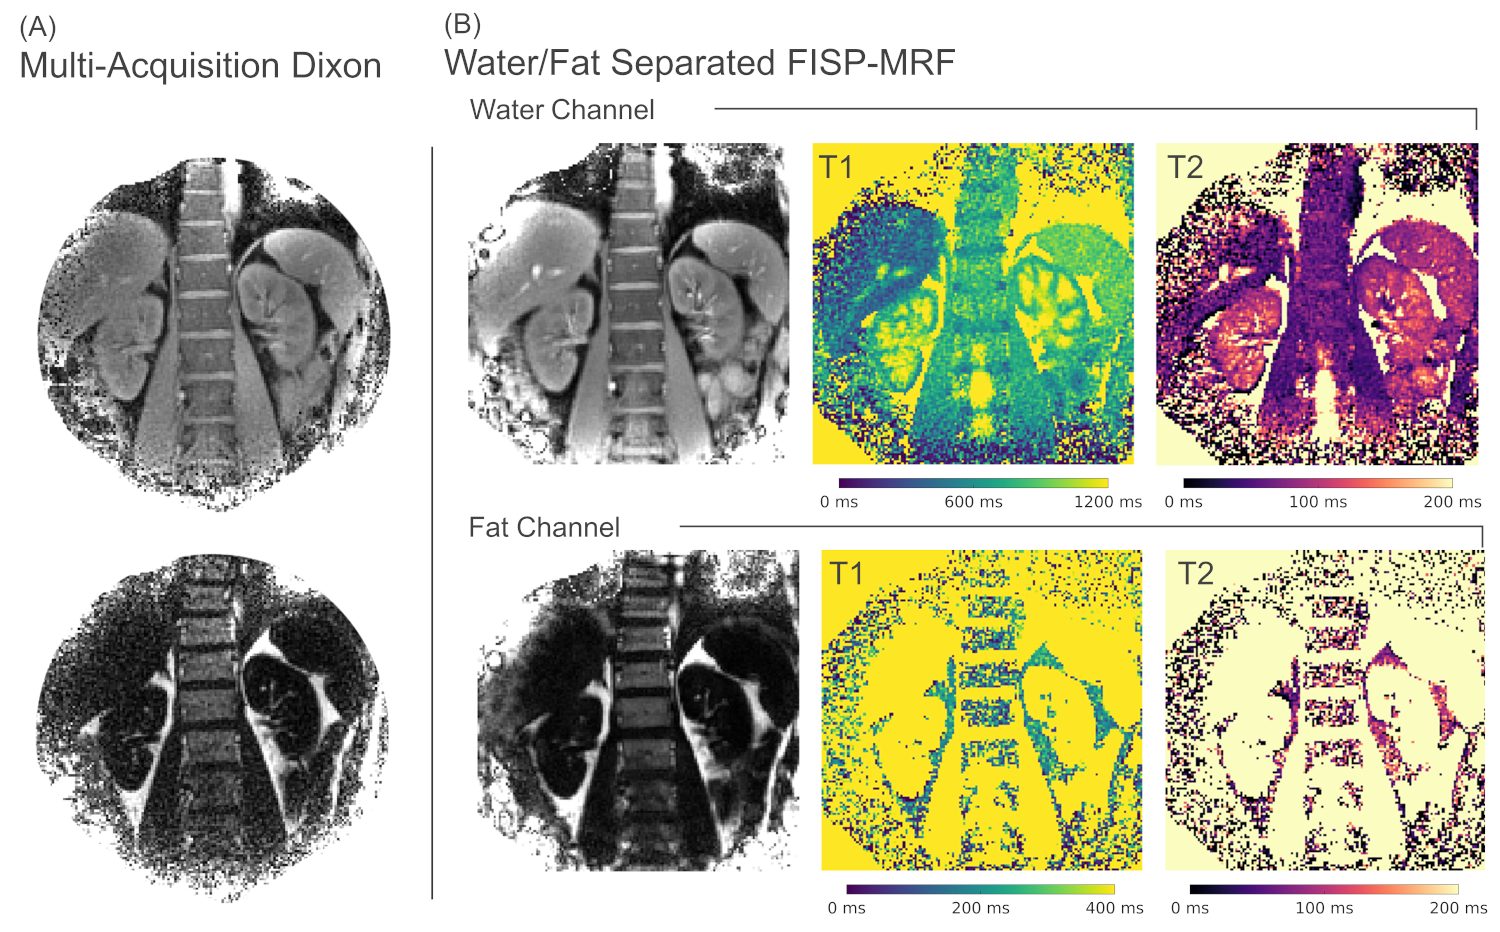
For comparison, we also performed a classical Cartesian multi-acquisition three-point Dixon scan to show efficacy of water/fat separation with equivalent field-of-view and nominal resolution (TR=11.5ms, TE=2.9ms, TE=3.07 ms, 2mm resolution, 8mm slice-thickness, 4 averages).10,11
Results & Discussion
The water/fat separating FISP-MRF sequence resulted in a breath hold duration of 25 s for a single coronal slice, which is comparable to the 27 s breath hold required for the Cartesian multi-acquisition Dixon scan.In Figure 4, reconstruction results of the MRF acquisition are shown providing a water/fat separated proton image and separate estimates of T1 and T2 for water and fat channels. The proton density images obtained with MRF are in good agreement with the Cartesian Dixon scan, however showing bright vessels due to blood inflow effects during the MRF sequence and slightly reduced actual resolution of the spiral acquisition compared to the Cartesian scan.
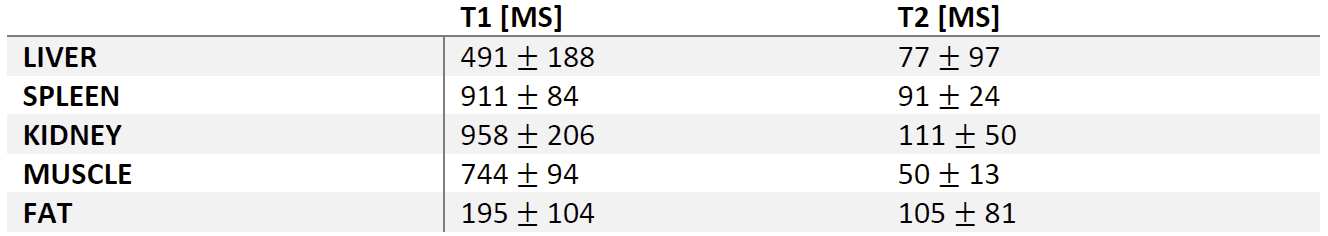
Average and standard deviation of relaxation parameters are reported in Figure 5 for liver (T1/T2: 491ms / 77ms), spleen (911ms / 91ms), kidney (958ms / 111ms), muscle (744ms / 50ms) and fat (195ms / 105ms).
Due to the reduced Larmor frequency at 0.75T, the body coil of the 3T system could not be used, which necessitated the additional 13C hardware to excite proton magnetization. The flexible four-loop transmitter resulted in considerable B1+ inhomogeneity (Figure 3) especially for coronal and sagittal slice orientations, which needed to be considered during matching. B1+ homogeneity was considerably improved for transverse slices and it is expected to be improved generally, if a body coil is employed.
Conclusion
We have demonstrated feasibility of water/fat separation with simultaneous T1/T2 parameter mapping in the abdomen on a lower-field 0.75T MRI resulting in water/fat separation comparable to Cartesian three-point Dixon. Despite the lower signal-to-noise ratio at lower field, MR fingerprinting is capable of determining T1/T2 concurrently to chemical shift-based water/fat separation. Improved performance is expected, if the fingerprint sequence and readout are specifically optimized for 0.75T.Acknowledgements
No acknowledgement found.References
1. Campbell-Washburn AE, Ramasawmy R, Restivo MC, et al. Opportunities in Interventional and Diagnostic Imaging by Using High-Performance Low-Field-Strength MRI. Radiology. 2019;293(2):384-393. doi:10.1148/radiol.2019190452
2. Campbell-Washburn AE, Jiang Y, Körzdörfer G, Nittka M, Griswold MA. Feasibility of MR fingerprinting using a high-performance 0.55T MRI system. In: Intl. Soc. Mag. Reson. Med. 28. ; 2020:0868.
3. Jiang Y, Ma D, Seiberlich N, Gulani V, Griswold M a. MR fingerprinting using fast imaging with steady state precession (FISP) with spiral readout. Magn Reson Med. 2015;74(6):1621-1631. doi:10.1002/mrm.25559
4. Koolstra K, Webb AG, Veeger TTJ, Kan HE, Koken P, Börnert P. Water–fat separation in spiral magnetic resonance fingerprinting for high temporal resolution tissue relaxation time quantification in muscle. Magn Reson Med. 2020;84(2):646-662. doi:10.1002/mrm.28143
5. Brodsky EK, Holmes JH, Yu H, Reeder SB. Generalized K-space decomposition with chemical shift correction for non-Cartesian water-fat imaging. Magn Reson Med. 2008;59(5):1151-1164. doi:10.1002/mrm.21580
6. Yu H, Shimakawa A, McKenzie CA, Brodsky E, Brittain JH, Reeder SB. Multiecho water-fat separation and simultaneous R 2* estimation with multifrequency fat spectrum modeling. Magn Reson Med. 2008;60(5):1122-1134. doi:10.1002/mrm.21737
7. Man L-C, Pauly JM, Macovski A. Multifrequency interpolation for fast off-resonance correction. Magn Reson Med. 1997;37(5):785-792. doi:10.1002/mrm.1910370523
8. Weigel M. Extended phase graphs: Dephasing, RF pulses, and echoes - pure and simple. J Magn Reson Imaging. 2015;41(2):266-295. doi:10.1002/jmri.24619
9. Nehrke K, Börnert P. DREAM-a novel approach for robust, ultrafast, multislice B1 mapping. Magn Reson Med. 2012;68(5):1517-1526. doi:10.1002/mrm.24158
10. Glover GH, Schneider E. Three-point dixon technique for true water/fat decomposition withB0 inhomogeneity correction. Magn Reson Med. 1991;18(2):371-383. doi:10.1002/mrm.1910180211
11. Glover GH. Multipoint dixon technique for water and fat proton and susceptibility imaging. J Magn Reson Imaging. 1991;1(5):521-530. doi:10.1002/jmri.1880010504
Figures