1555
Whole-knee quantification of the articular cartilage: magnetic resonance fingerprinting for joint T1 and T2* mapping of 16 slices in 3 minutes1Magnetic Resonance Systems Lab, Department of Imaging Physics, Delft University of Technology, Delft, Netherlands, 2Computer Assisted Clinical Medicine, Medical Faculty Mannheim, Heidelberg University, Mannheim, Germany, 3Department of Mechanical Engineering, Stanford University, Stanford, CA, United States, 4Department of Radiology, Leiden University Medical Center, Leiden, Netherlands, 5Orthopaedic Surgery, Erasmus University Medical Centre, Rotterdam, Netherlands, 6Department of Biomechanical Engineering, Delft University of Technology, Delft, Netherlands
Synopsis
Quantitative tissue characterization of the articular cartilage is a promising method for early assessment of degeneration. However, current techniques have limited spatial coverage and are at risk of missing localized alterations. In this work, we implemented and validated an MRF-EPI sequence for the simultaneous T1 and T2* quantification with whole knee coverage across 16 slices in 3 minutes. Initial evaluation in phantom, ex vivo animal tissue and in one healthy subject show promising results compared with conventional methods.
Introduction
Quantitative MRI offers great promise for early detection of degeneration in the articular knee cartilage, where standard clinical MRI techniques often fail to capture non-morphological changes1. However, quantitative MRI protocols often suffer from long scan times and numerous scans are required, hampering image fusion due to the need to co-register several scans2.Magnetic resonance fingerprinting (MRF) 3 enables the simultaneous quantification of multiple MR parameters with high scan efficiency. In MRF, multiple images with different contrast weighting are generated by varying acquisition parameters throughout the scan. Matching the resulting magnetization evolution to Bloch-simulations yields tissue parameter maps.
Previous results show great promise of MRF for discrimination between mild osteoarthritis patients and healthy volunteers 4. However, due to the comparatively long scan time (7 minutes), spatial coverage was limited (6 slices) with the risk of missing localized alterations of the articular cartilage. MRF-EPI has recently been introduced as an alternative MRF approach 5 with the promise of high scan time efficiency for volumetric coverage using an interleaved acquisition design 6. In this study, we explore the use of an MRF-EPI sequence for simultaneous quantification of T1 and T2* with whole-knee coverage in 3 minutes, as a candidate one-stop shop sequence for quantitative assessment of cartilage degeneration.
Methods
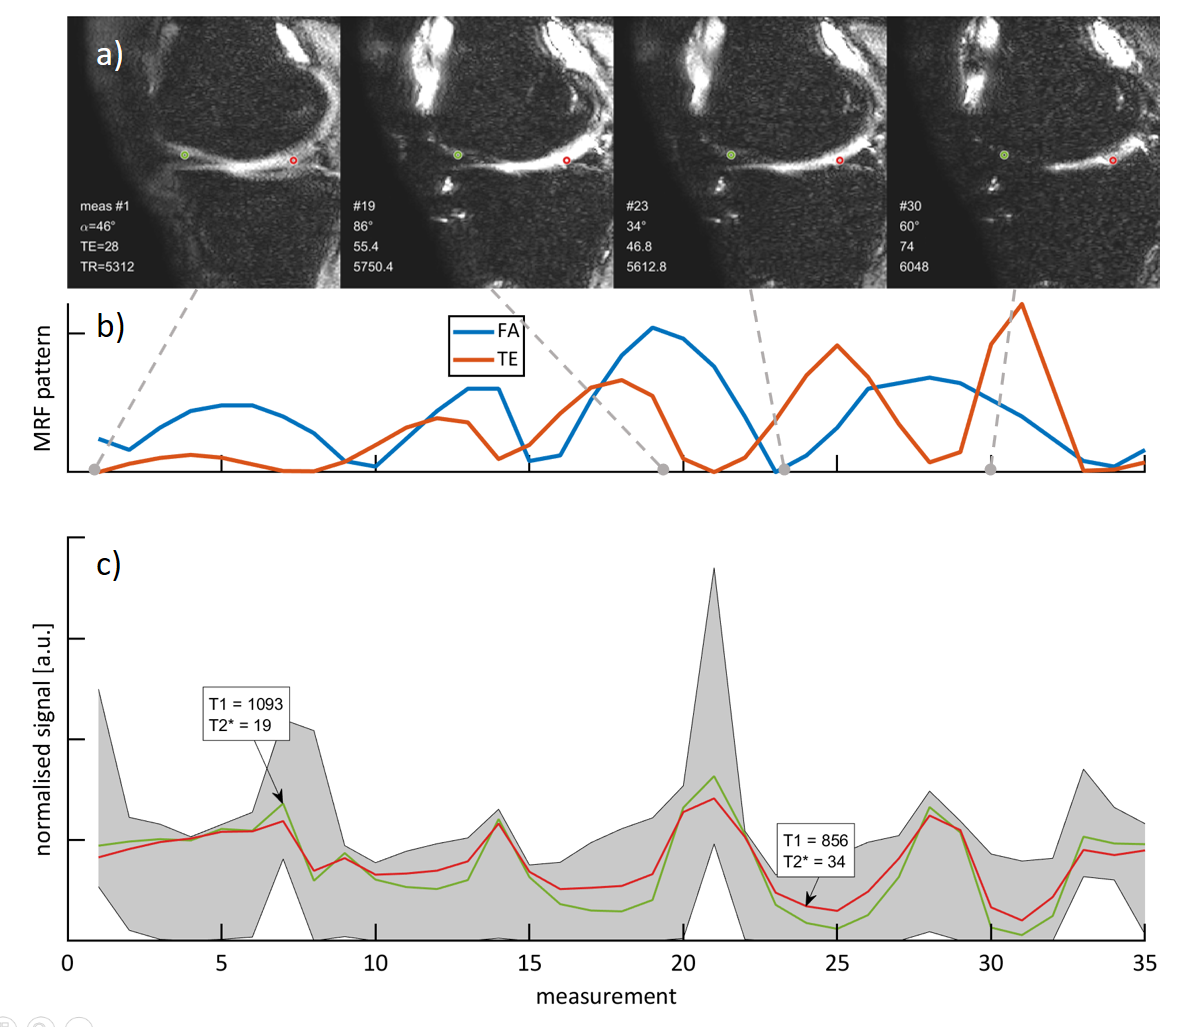
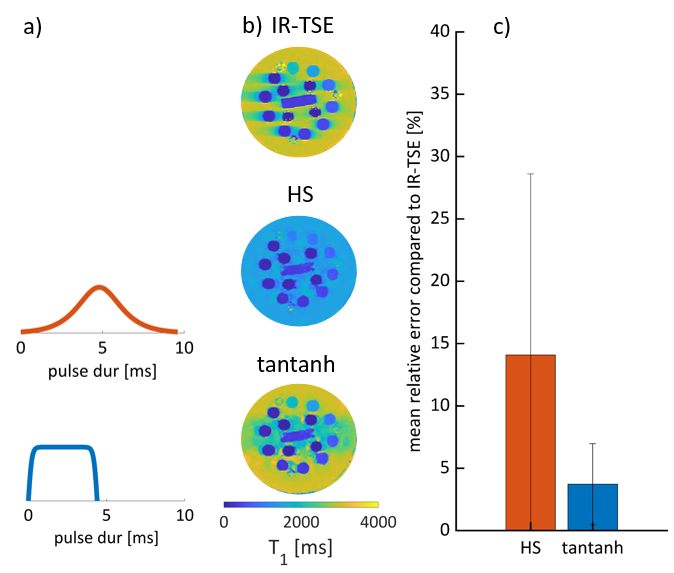
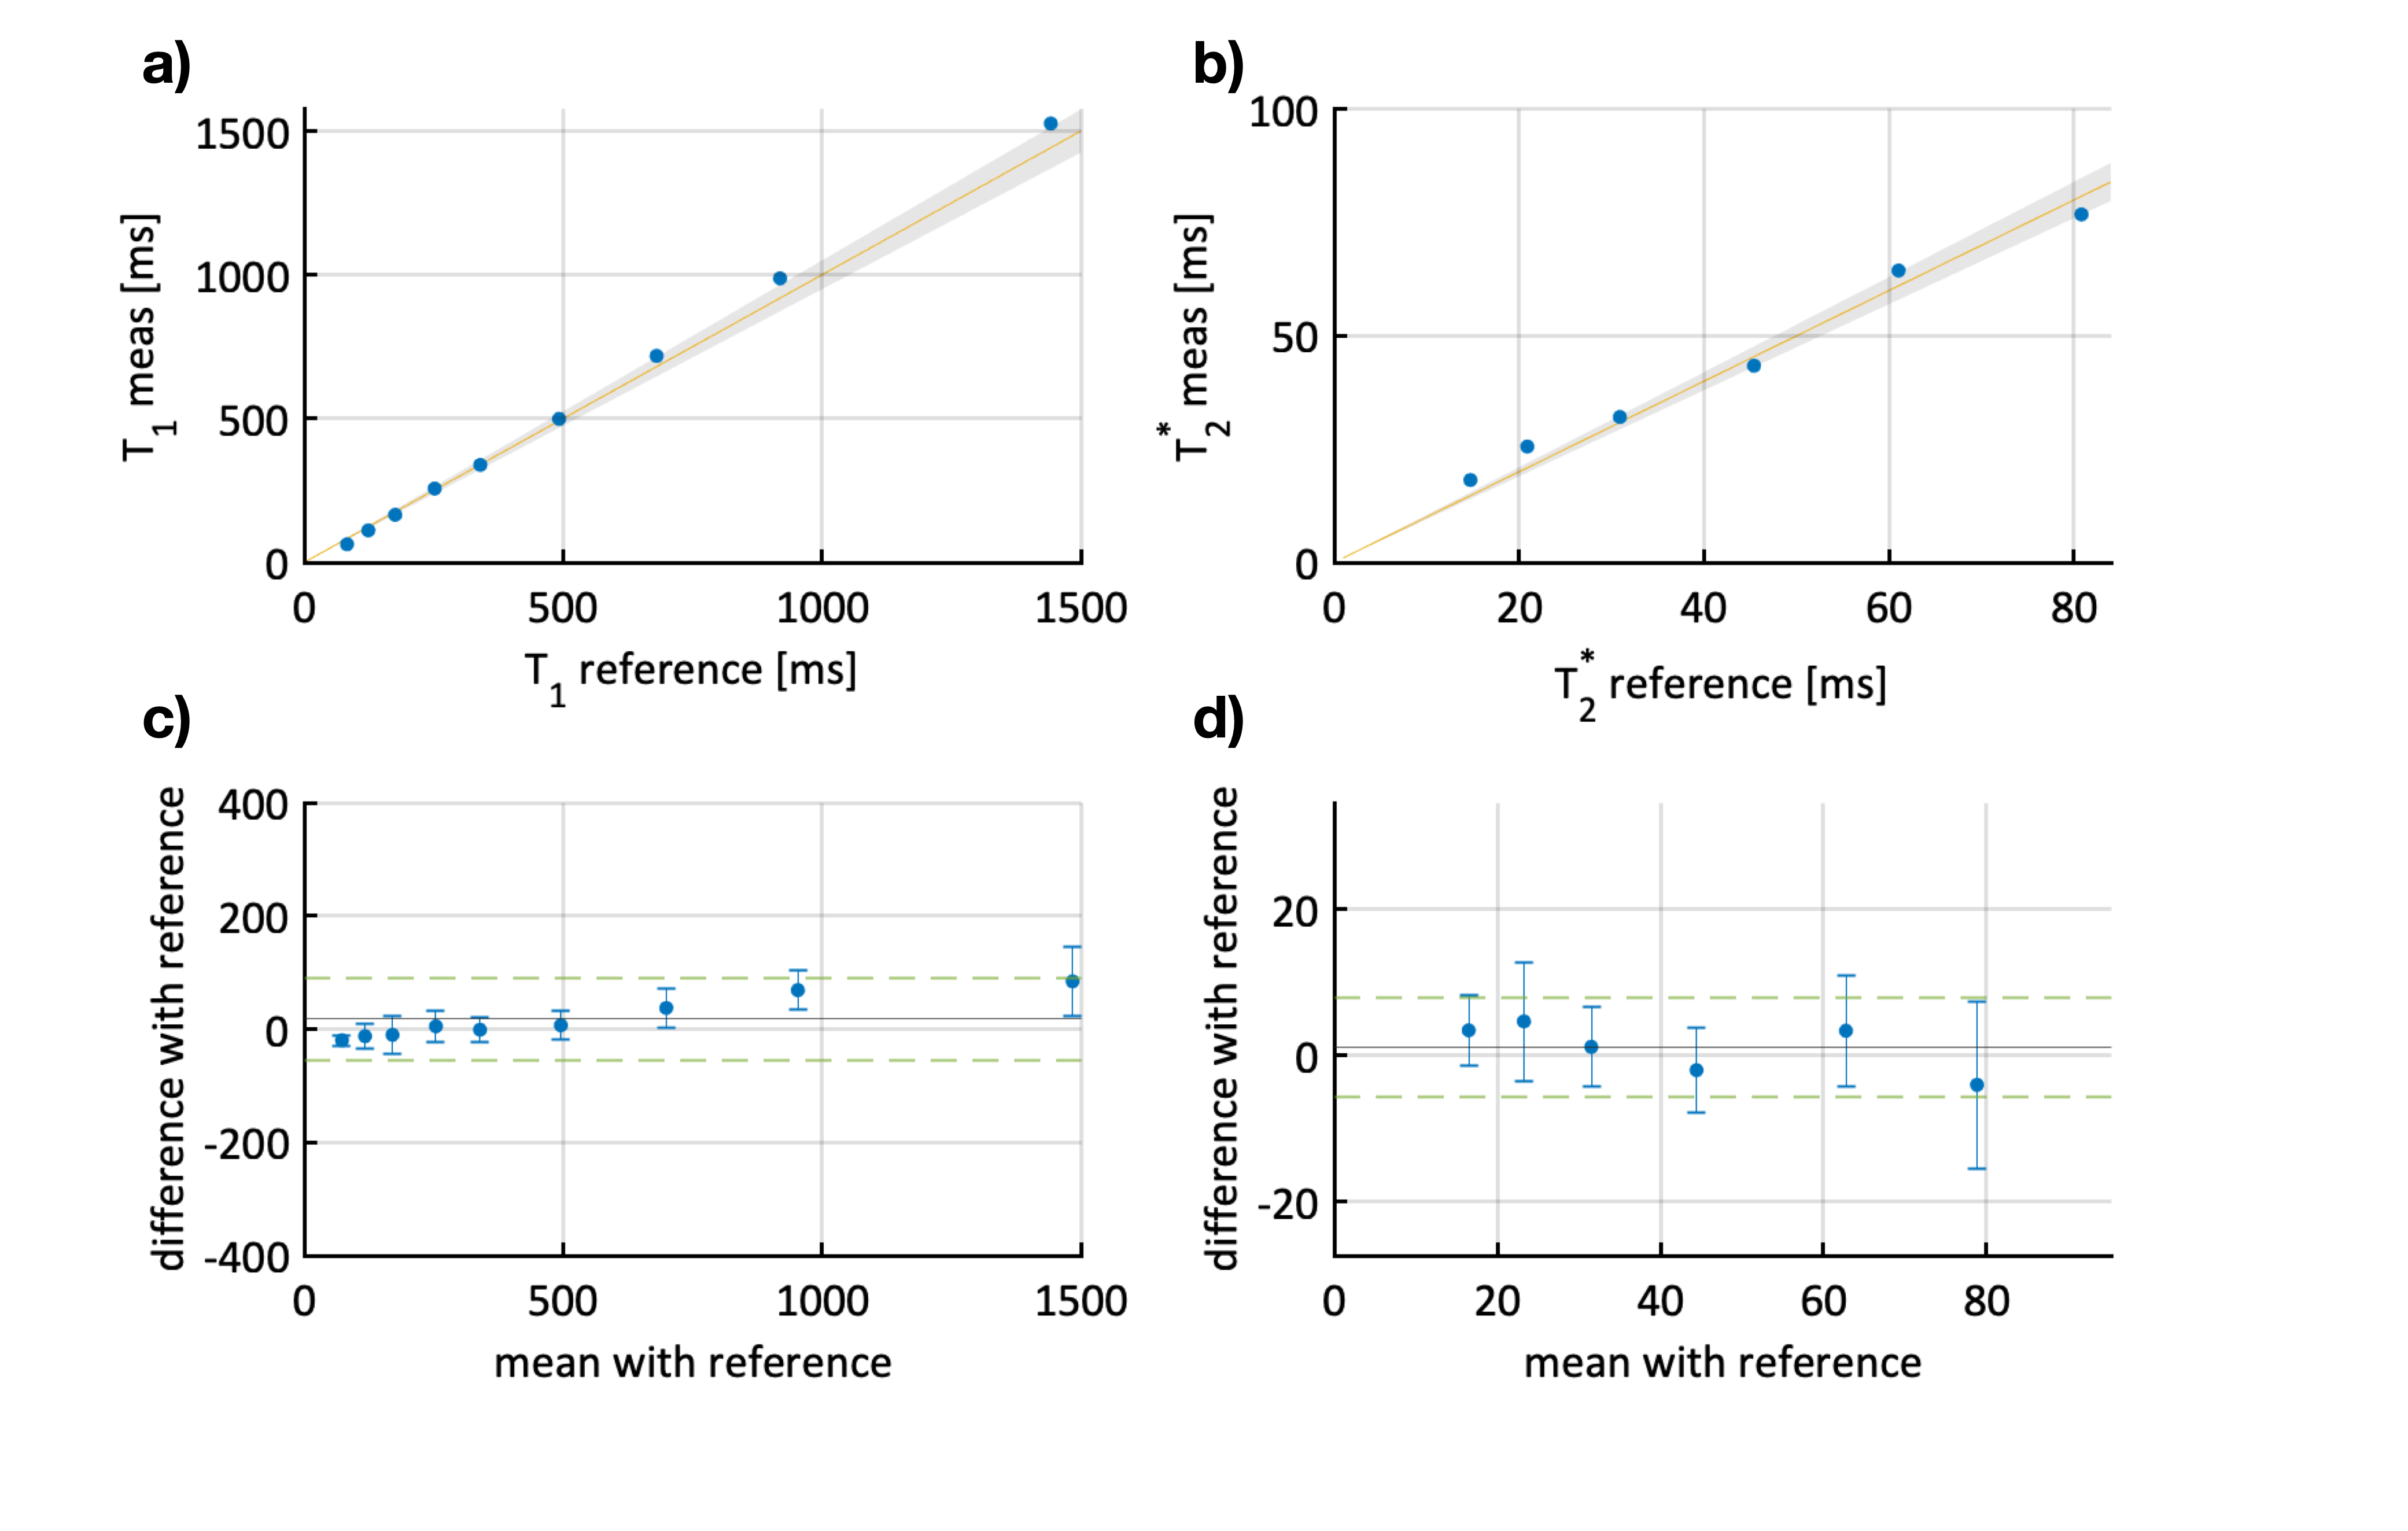
An MRF sequence based on an EPI readout5,6 was implemented on a 3T scanner (Ingenia, Philips) using an 8-channel receiver coil array. The sequence parameters were FOV = 150x150mm2, matrix size = 250x250, in-plane resolution = 0.6x0.6mm2, slice thickness = 5mm, SENSE factor = 2, partial Fourier = 0.6 and varying flip angle (34-86deg), TE (28-89ms), effective TR (5312-6280ms) with 4 temporally spaced adiabatic inversion pulses as shown in Fig. 1. The total acquisition time was 3:03 minutes for acquiring 560 baseline images covering 16 slices. Parameter maps were reconstructed using a dictionary consisting of 52,297 entries with T1 (20-3000ms), T2* (5-300ms), and flip angle efficiency B1+ (0.6-1.2).Phantom imaging was performed to assess the accuracy of the proposed technique in comparison to an inversion recovery turbo spin-echo (IR-TSE) and multi gradient echo (multi GRE) reference. Additionally, T1 accuracy was evaluated when using a conventional hyperbolic-secant (HS) (9.6ms), and a recently proposed tan-tanh adiabatic inversion pulse (4.4ms)7.
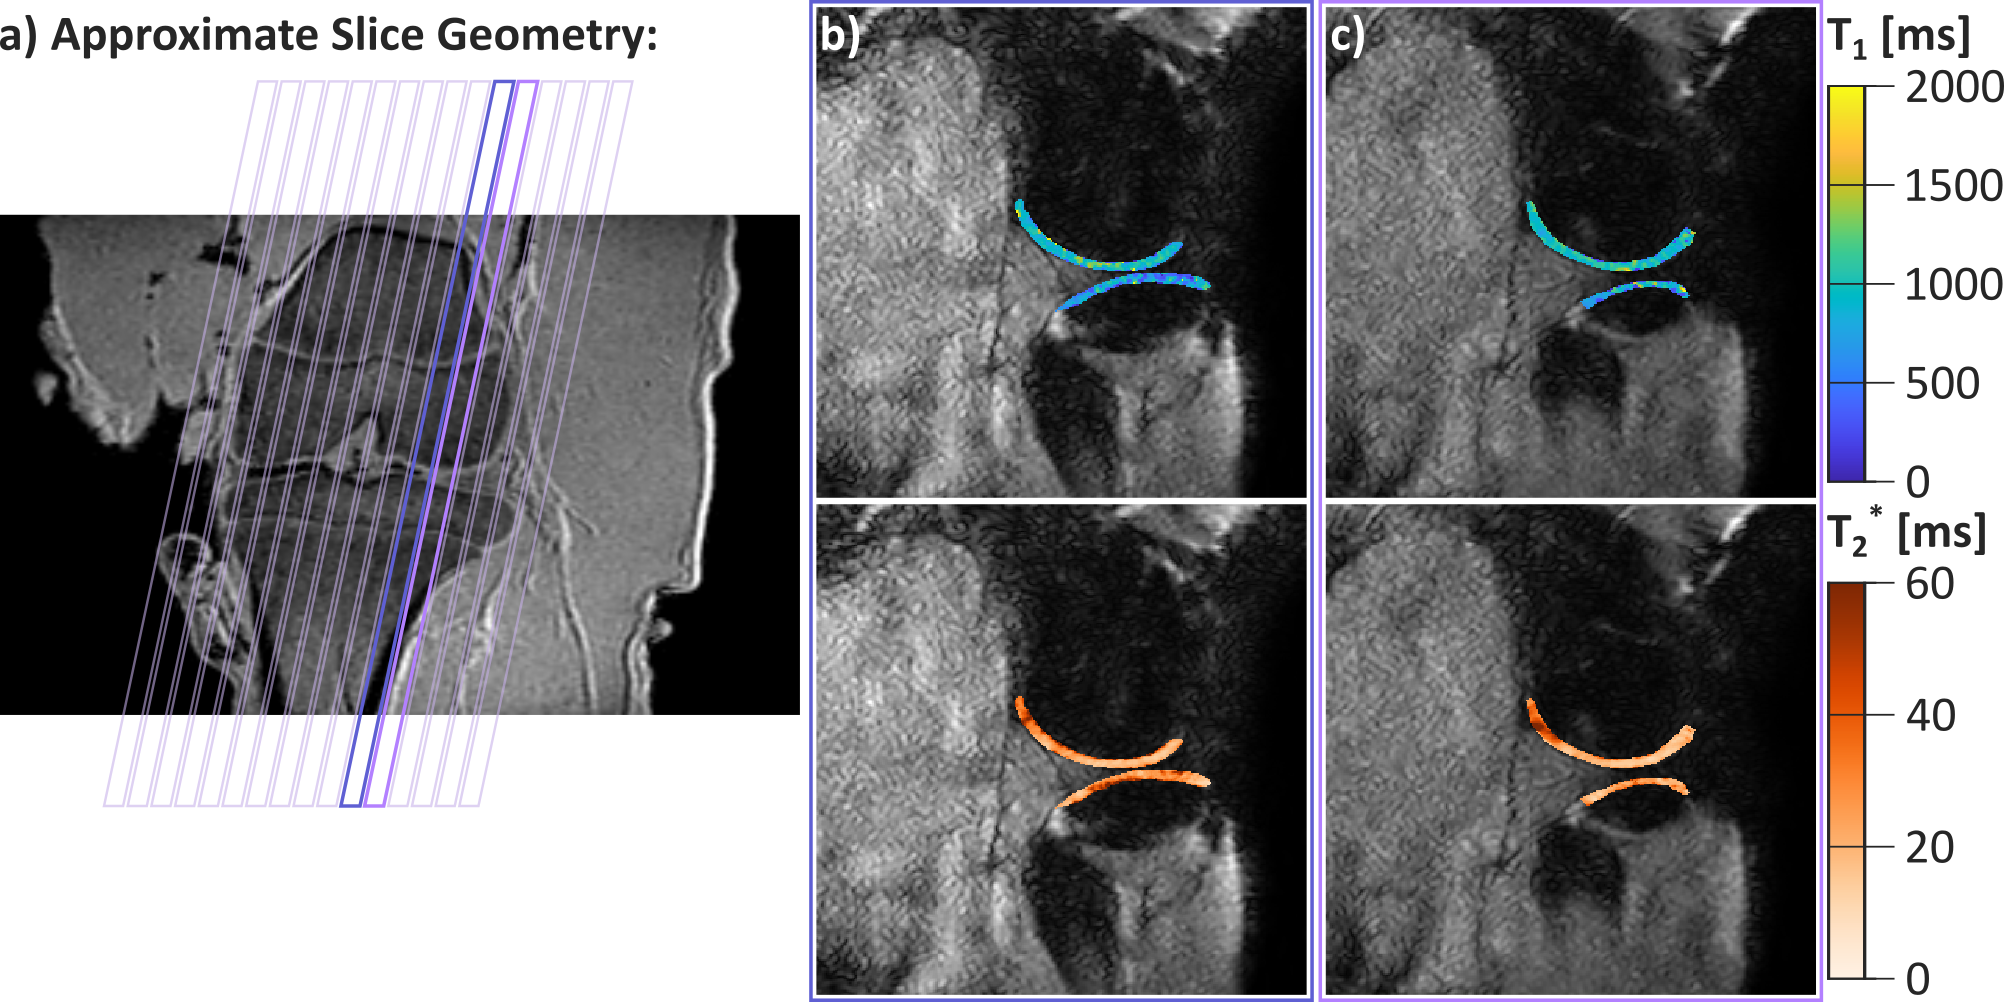
Furthermore, imaging was performed in the articular knee cartilage of an ex vivo pig leg and one healthy subject. In vivo reference T1 maps were generated using 5(3s)3 MOLLI and T2* using multi GRE with 15 contrasts (1.6-21ms). Reference images were acquired with lower in-plane resolution (1.2x1.2mm2), due to lower scan efficiency. The combined acquisition time for the reference scans was 9:84 min. Regions of interest were manually drawn in the femoral articular cartilage to calculate mean values and standard deviations of the T1 and T2* times.
Results
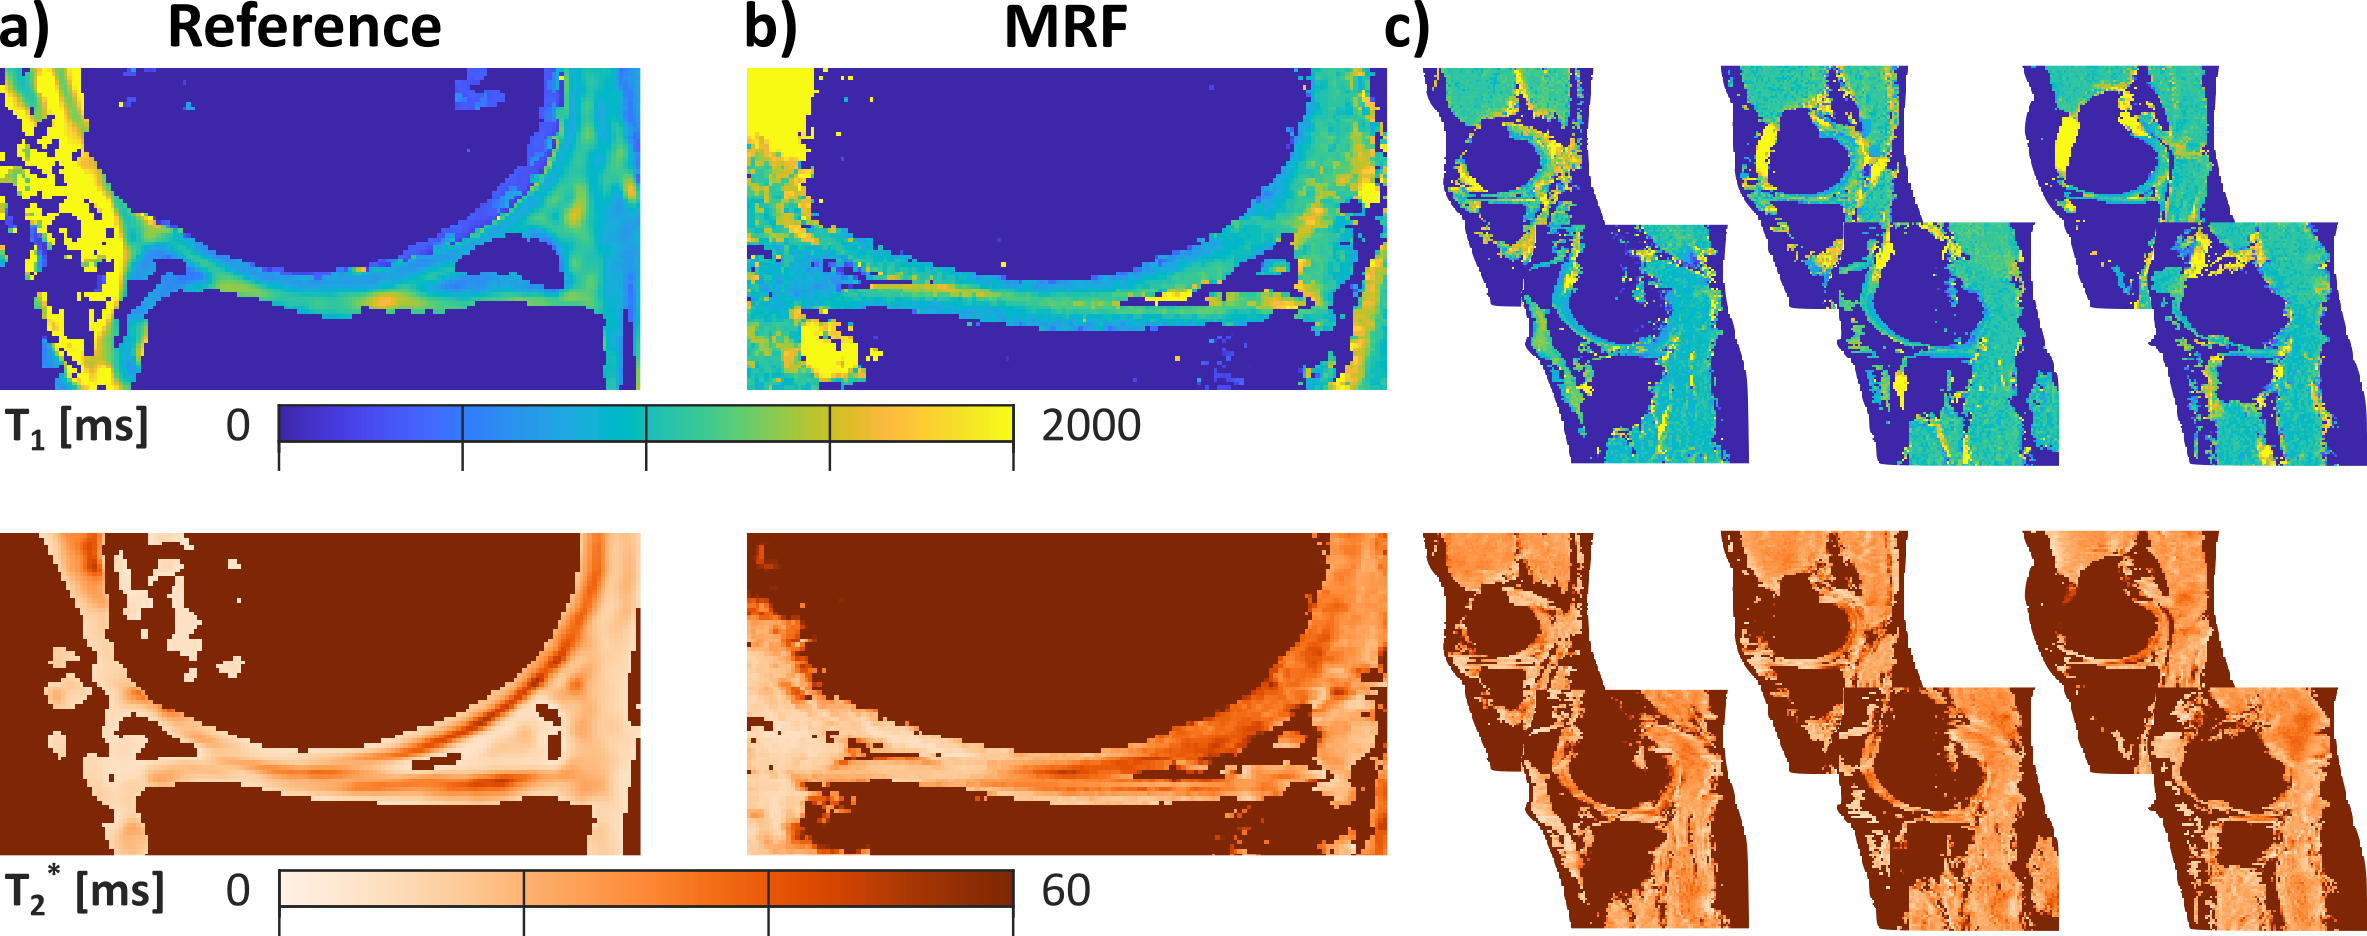
Substantially improved T1 accuracy is achieved when using the optimized tan-tanh pulse, indicating insufficient inversion efficiency for cartilage-like phantoms (Fig. 2). Using the tan-tanh pulse, phantom scans showed good agreement with reference for both T1 and T2* with deviations of less than 84ms for T1 and 4.6ms for T2* (Fig. 3).Two exemplary slices from the whole-knee quantification in the pig leg are shown in Figure 4. Largely homogeneous quantification is achieved in both femoral and tibial cartilage. In-vivo MRF T1 and T2* maps are compared to conventional mapping in Figure 5. MRF in vivo measurements in the femoral cartilage yielded T1=922+-153ms and T2* =29.8+-12.6ms compared to T1=865+-126ms and T2* =20.3+-11.4ms for the reference scans. The contrast in the MRF maps was similar to the reference scans but with a factor two increased in-plane resolution.
Discussion
In this study, we evaluated the feasibility of quantitative articular cartilage characterization with whole knee coverage (16 slices) in 3 minutes using MRF-EPI. Co-registered T1 and T2* maps showed good agreement with standard methods and literature8,9. Promising image quality in ex vivo animal tissue and in vivo was obtained.In this study, T2* maps were acquired instead of T2 maps, as previously used for mapping articular cartilage with MRF4. However, previous research has shown that T2* quantification is non-inferior to T2 for detection of cartilage changes while allowing for acquisition schemes with higher scan efficiency8. Thus, in this study, we acquired T2* maps to enable rapid quantification of the whole knee. Future research is warranted to validate the use of T2* as a biomarker in appropriate disease models.
Traditionally, slice coverage has been limited for quantitative MRI approaches in the cartilage due to high scan time requirements. Limited slice coverage does, however, result in the possibility of missing localized tissue alterations. Spatial variability of cartilage relaxation times has been found to be of importance for monitoring of disease progression10. Especially, for the assessment of cartilage lesions, complete coverage may enable to detect small localized lesions earlier after onset11. Future work will focus on clinically validating the advantages of quantitative whole-knee imaging in patients suffering from osteoarthritis.
Conclusion
MRF-EPI of the articular cartilage enables whole-knee quantification of T1 and T2* times in 16 slices with 3 minutes scan time. The proposed technique bears promise for enabling rapid and comprehensive assessment of early-stage cartilage deterioration in clinical use.Acknowledgements
S.W. acknowledges funding from the 4TU Precision Medicine program, a NWO Start-up STU.019.024 and ZonMW OffRoad 04510011910073. The authors thank Christal van de Steeg-Henzen for her help with the data acquisition.References
1. A. Guermazi et al. “Compositional MRI techniques for evaluation of cartilage degeneration in osteoarthritis”. en. In: Osteoarthritis and Cartilage 23.10 (Oct. 2015), pp. 1639–1653.
2. Jean J. L. Hsieh and Imants Svalbe. “Magnetic resonance fingerprinting: from evolution to clinical applications”. In: Journal of Medical Radiation Sciences (June 2020). Publisher: John Wiley and Sons Ltd, jmrs.413.
3. Dan Ma et al. “Magnetic resonance fingerprinting”. en. In: Nature 495.7440 (Mar. 2013). Number: 7440 Publisher: Nature Publishing Group, pp. 187– 192.
4. Azadeh Sharafi et al. “MR fingerprinting for rapid simultaneous T 1 , T 2 , and T 1 relaxation mapping of the human articular cartilage at 3T”. en. In: Magnetic Resonance in Medicine 84.5 (Nov. 2020), pp. 2636–2644.
5. Benedikt Rieger et al. “Magnetic resonance fingerprinting using echoplanar imaging: Joint quantification of T1 and relaxation times”. en. In: Magnetic Resonance in Medicine 78.5 (2017).
6. Ingo Hermann et al. “Magnetic resonance fingerprinting for simultaneous renal T1 and mapping in a single breath-hold”. en. In: Magnetic Resonance in Medicine 83.6 (2020).
7. Peter Kellman, Daniel A. Herzka, and Michael Schacht Hansen. “Adiabatic inversion pulses for myocardial T1 mapping”. In: Magnetic Resonance in Medicine 71.4 (2014). Publisher: John Wiley and Sons Inc, pp. 1428–1434. 4
8. Tallal Charles Mamisch et al. “T2 star relaxation times for assessment of articular cartilage at 3 T: a feasibility study”. en. In: Skeletal Radiology 41.3 (Mar. 2012), pp. 287–292.
9. Shruti Mittal et al. “T1 and T2 mapping of articular cartilage and menisci in early osteoarthritis of the knee using 3-Tesla magnetic resonance imaging”. In: Polish Journal of Radiology 84 (Dec. 18, 2019), e549–e564.
10. E Wiener, C W A Pfirrmann, and J Hodler. “Spatial variation in T1 of healthy human articular cartilage of the knee joint”. In: The British Journal of Radiology 83.990 (June 2010), pp. 476–485.
11. M. Kretzschmar et al. “Spatial distribution and temporal progression of T2 relaxation time values in knee cartilage prior to the onset of cartilage lesions – data from the Osteoarthritis Initiative (OAI)”. In: Osteoarthritis and Cartilage 27.5 (May 1, 2019), pp. 737–745.
Figures