1554
A Neural Network for Rapid Generation of T1, T2, T1Ρ Dictionaries for Cardiac MR Fingerprinting1School of Biomedical Engineering and Imaging Sciences, King's College London, London, United Kingdom
Synopsis
Dictionary generation for multi-parametric cardiac Magnetic Resonance Fingerprinting (MRF) is a significant bottleneck as subject-specific dictionaries must be created accounting for the subject’s heart rate variability and dictionaries grow exponentially with the number of parameters considered. Here we propose a feedforward neural network to generate cardiac MRF dictionaries for T1, T2 and T1ρ. The proposed approach was tested on simulations and in-vivo data, generating dictionaries in 3 seconds. The proposed method achieved a good match to dictionaries generated with Extended Phase Graph (EPG) simulations with mean relative errors for myocardium T1, T2 and T1ρ ranging from 1.7% to 5.1%.
Introduction
Cardiac Magnetic Resonance Fingerprinting (MRF) has been proposed to rapidly and simultaneously quantify multiple tissue parameters including T1 and T2 1-3. More recently simultaneous T1, T2 and T1ρ cardiac MRF4 has been introduced and enabled promising detection of focal and diffuse myocardial fibrosis with T1ρ without the need of exogenous contrast agents. However, the computational burden of MRF dictionary generation increases exponentially with the number of parameters. This is especially challenging for cardiac MRF that requires subject-specific dictionaries incorporating information about heart rate variability throughout the scan. Here we build on previous work5 and propose a new neural network-based dictionary generation for T1, T2 and T1ρ cardiac MRF. The proposed approach can generate accurate cardiac MRF dictionaries in 3 seconds for T1, T2 and T1ρ and a wide range of heart rates including heart rate variability. The proposed neural network based dictionary was compared against dictionaries generated using EPG simulations6 on simulated and in-vivo data.Methods
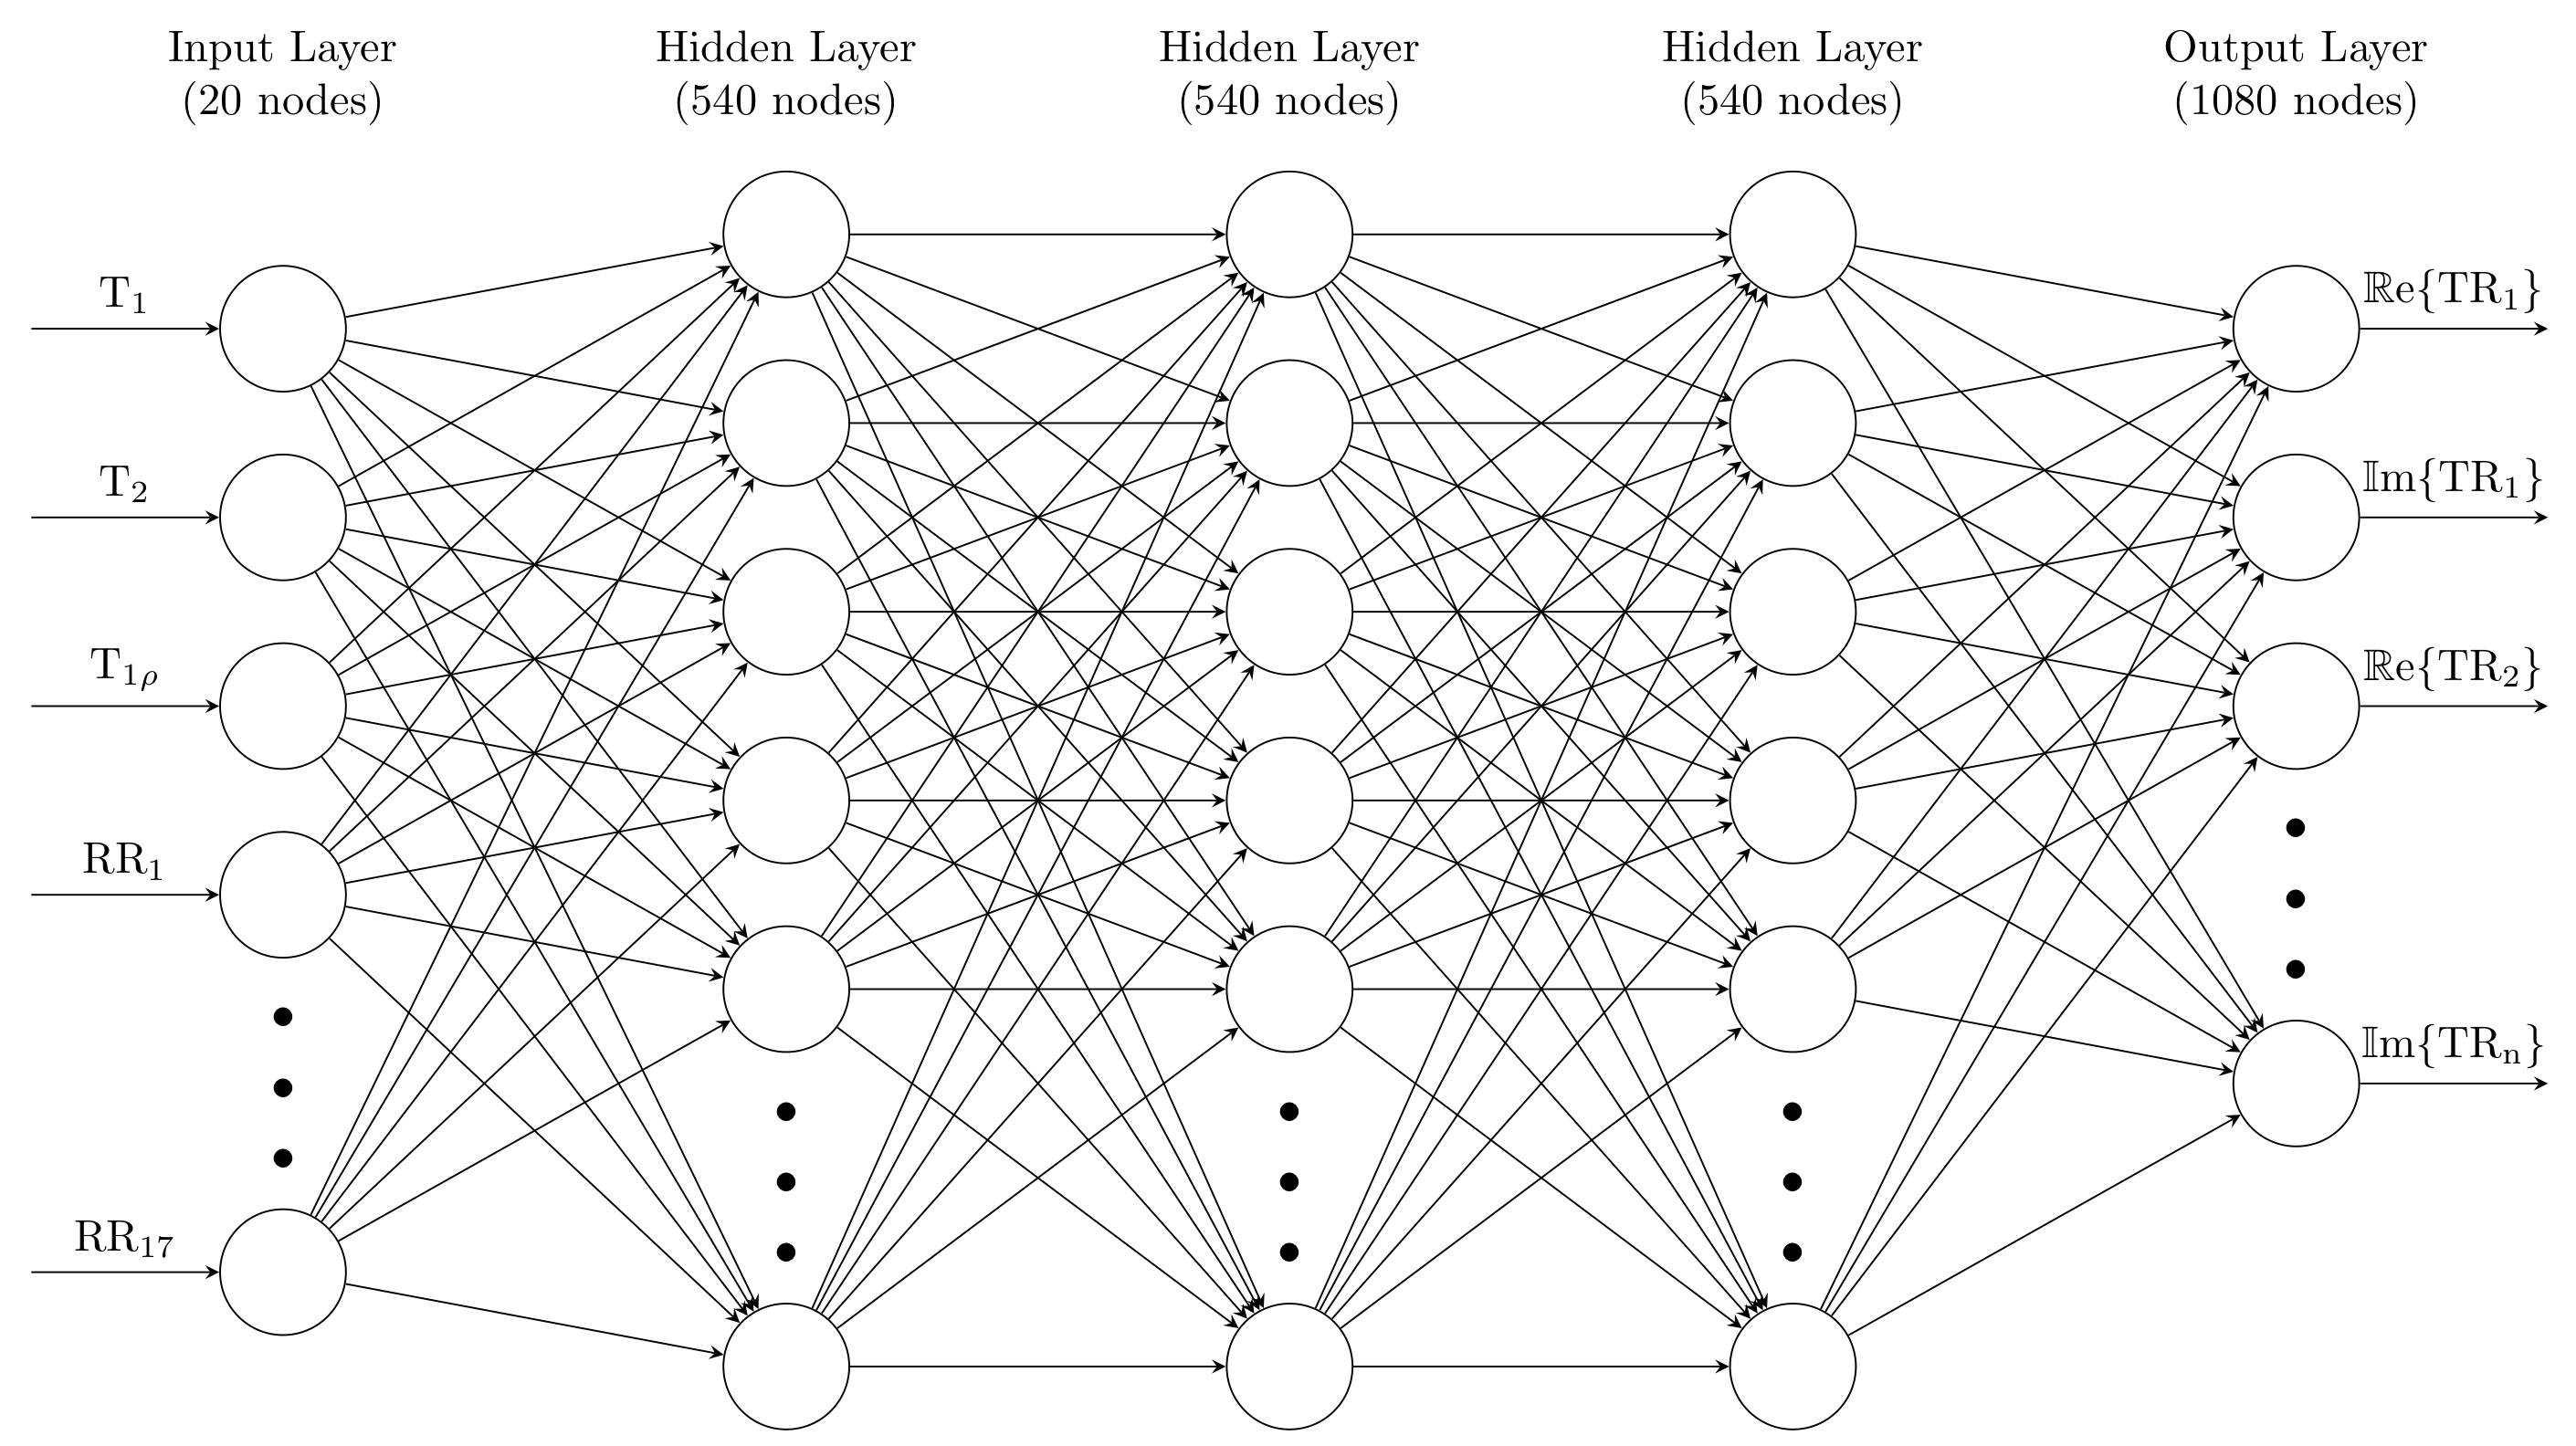
The input for the proposed cardiac MRF feedforward neural network (FFNN) is a 20-element vector consisting of the T1, T2 and T1ρ values and 17 RR intervals corresponding to an 18-heartbeat acquisition. The network has 3 hidden layers with 540 neurons each and an output layer of 1080 neurons, corresponding to the real and imaginary components of the 540 time points of the cardiac MRF fingerprints (Figure 1).Training data for the neural network was generated using EPG simulations. Dictionaries were generated for RR intervals with a mean heart rate ranging from 40 bpm to 120 bpm in steps of 2.5 bpm. For each step in the mean heart rate, 30 dictionaries were generated, varying the standard deviation of the heart rates in the 18-beat acquisition from 0% to 20% of the mean. This resulted in a total of 990 unique RR sequences. For each of these, a dictionary with 34680 T1, T2 and T1ρ combinations was generated using EPG simulations, resulting in a total of 34.3 million unique fingerprints. The neural network was then trained using 80% of the data for training and 10% for both validation and testing.
The proposed approach was tested using the test dataset to output predicted fingerprints for comparison with EPG simulations. The proposed approach was validated in simulations and in-vivo acquisitions. Acquisitions were performed on a 1.5T scanner (Ingenia, Philips Healthcare) on 2 healthy subjects, using a novel 2D cardiac MRF sequence based on inversion recovery, T2 preparation (echo times T2pTEs = {0, 40, 80 ms}) and T1ρ preparation (spin lock times SLTs = {0, 40, 80 ms} at 350 Hz) pulses4. Relevant acquisition parameters included: 30 spiral readouts per heartbeat, sinusoidally varying FA of 5-10deg, TE/TR= 0.91/7.11 ms, scan time ~18s.
Results
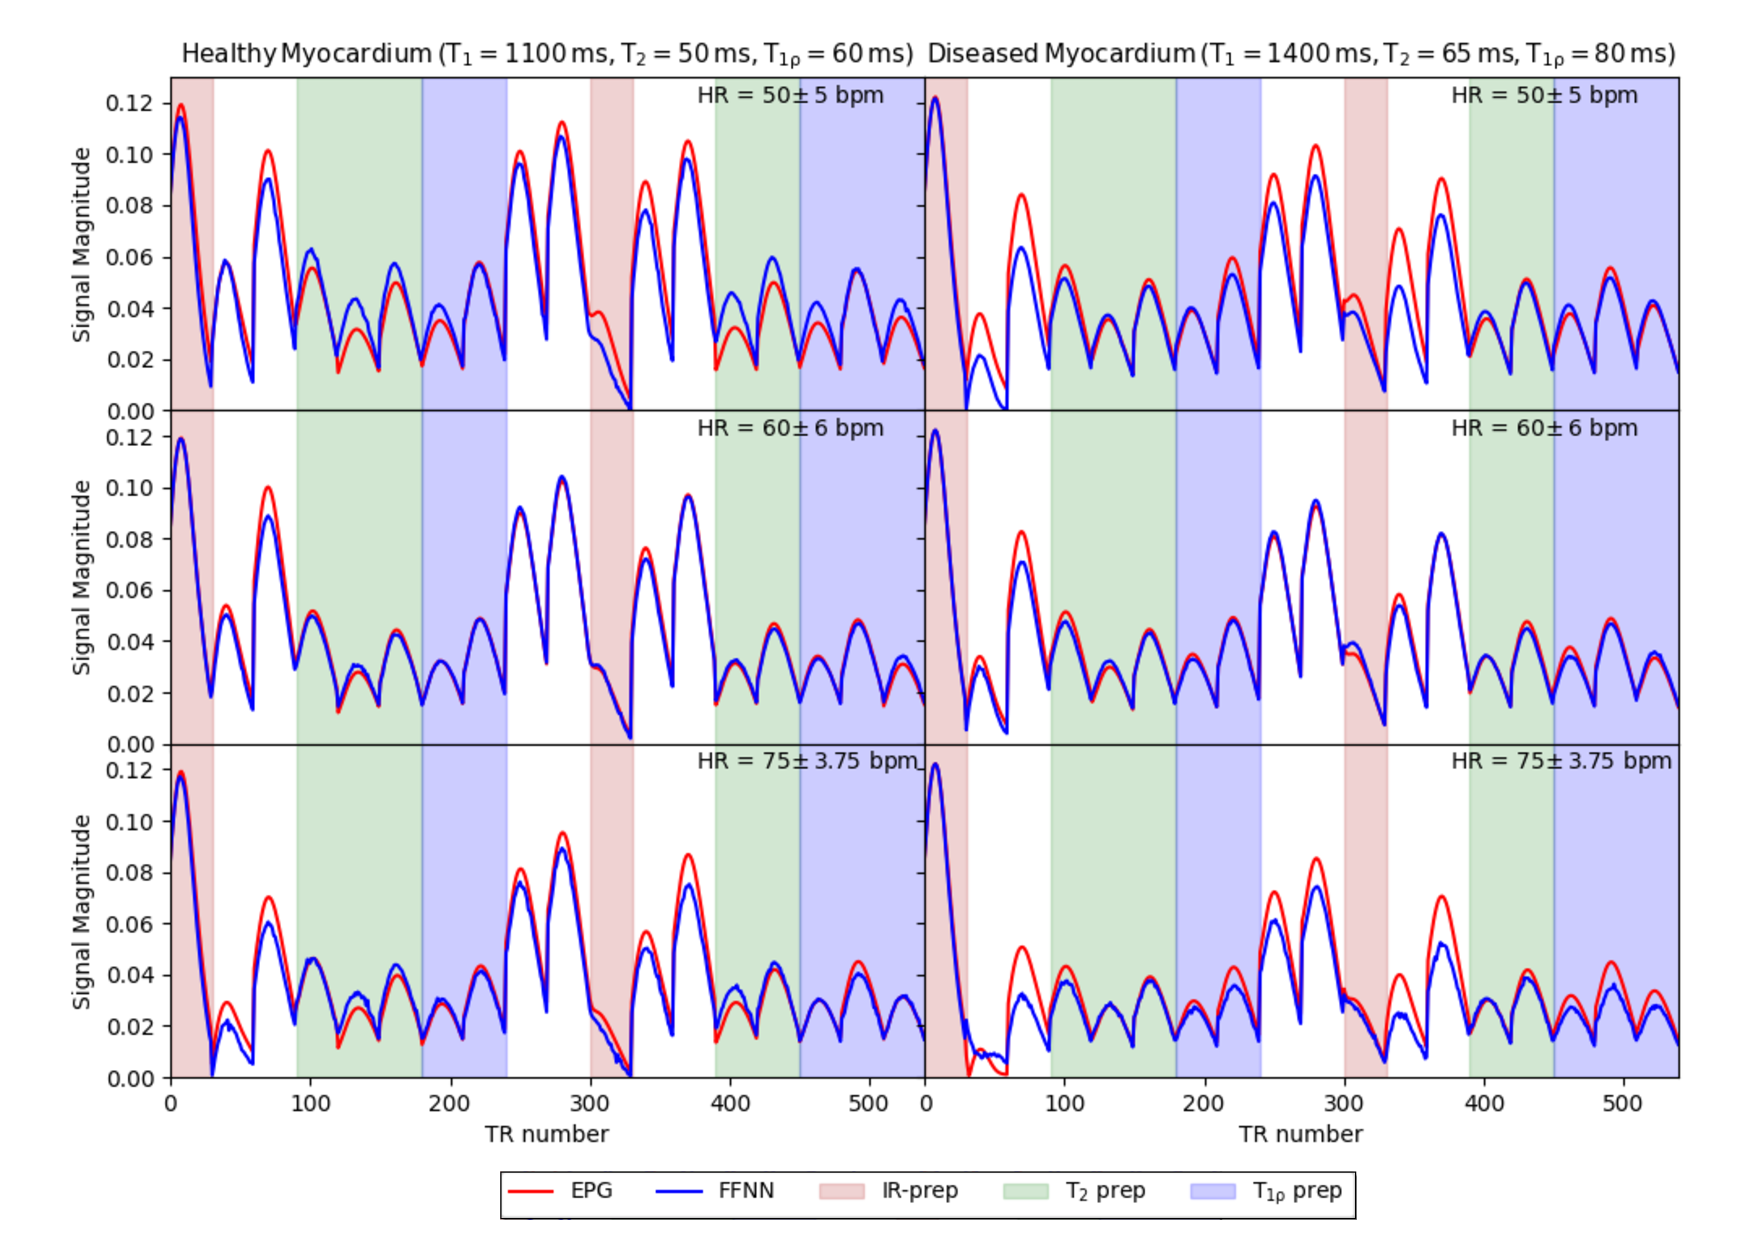
Each subject-specific dictionary, with 36480 T1, T2 and T1ρ parameters, was generated in just 3 seconds compared to 137 seconds taken to produce the EPG dictionary of the same size.Fingerprints generated by the proposed FFNN approach and benchmark fingerprints generated by EPG simulations for both healthy (T1 = 1100 ms, T2 = 50 ms and T1ρ = 60 ms) and diseased (T1 = 1400 ms, T2 = 65 ms and T1ρ = 80 ms) myocardium for 3 different RR sequences are shown in Figure 2. The FFNN sequences provide a good match to the EPG sequences and overall the mean absolute error of the test dataset is 0.0012.
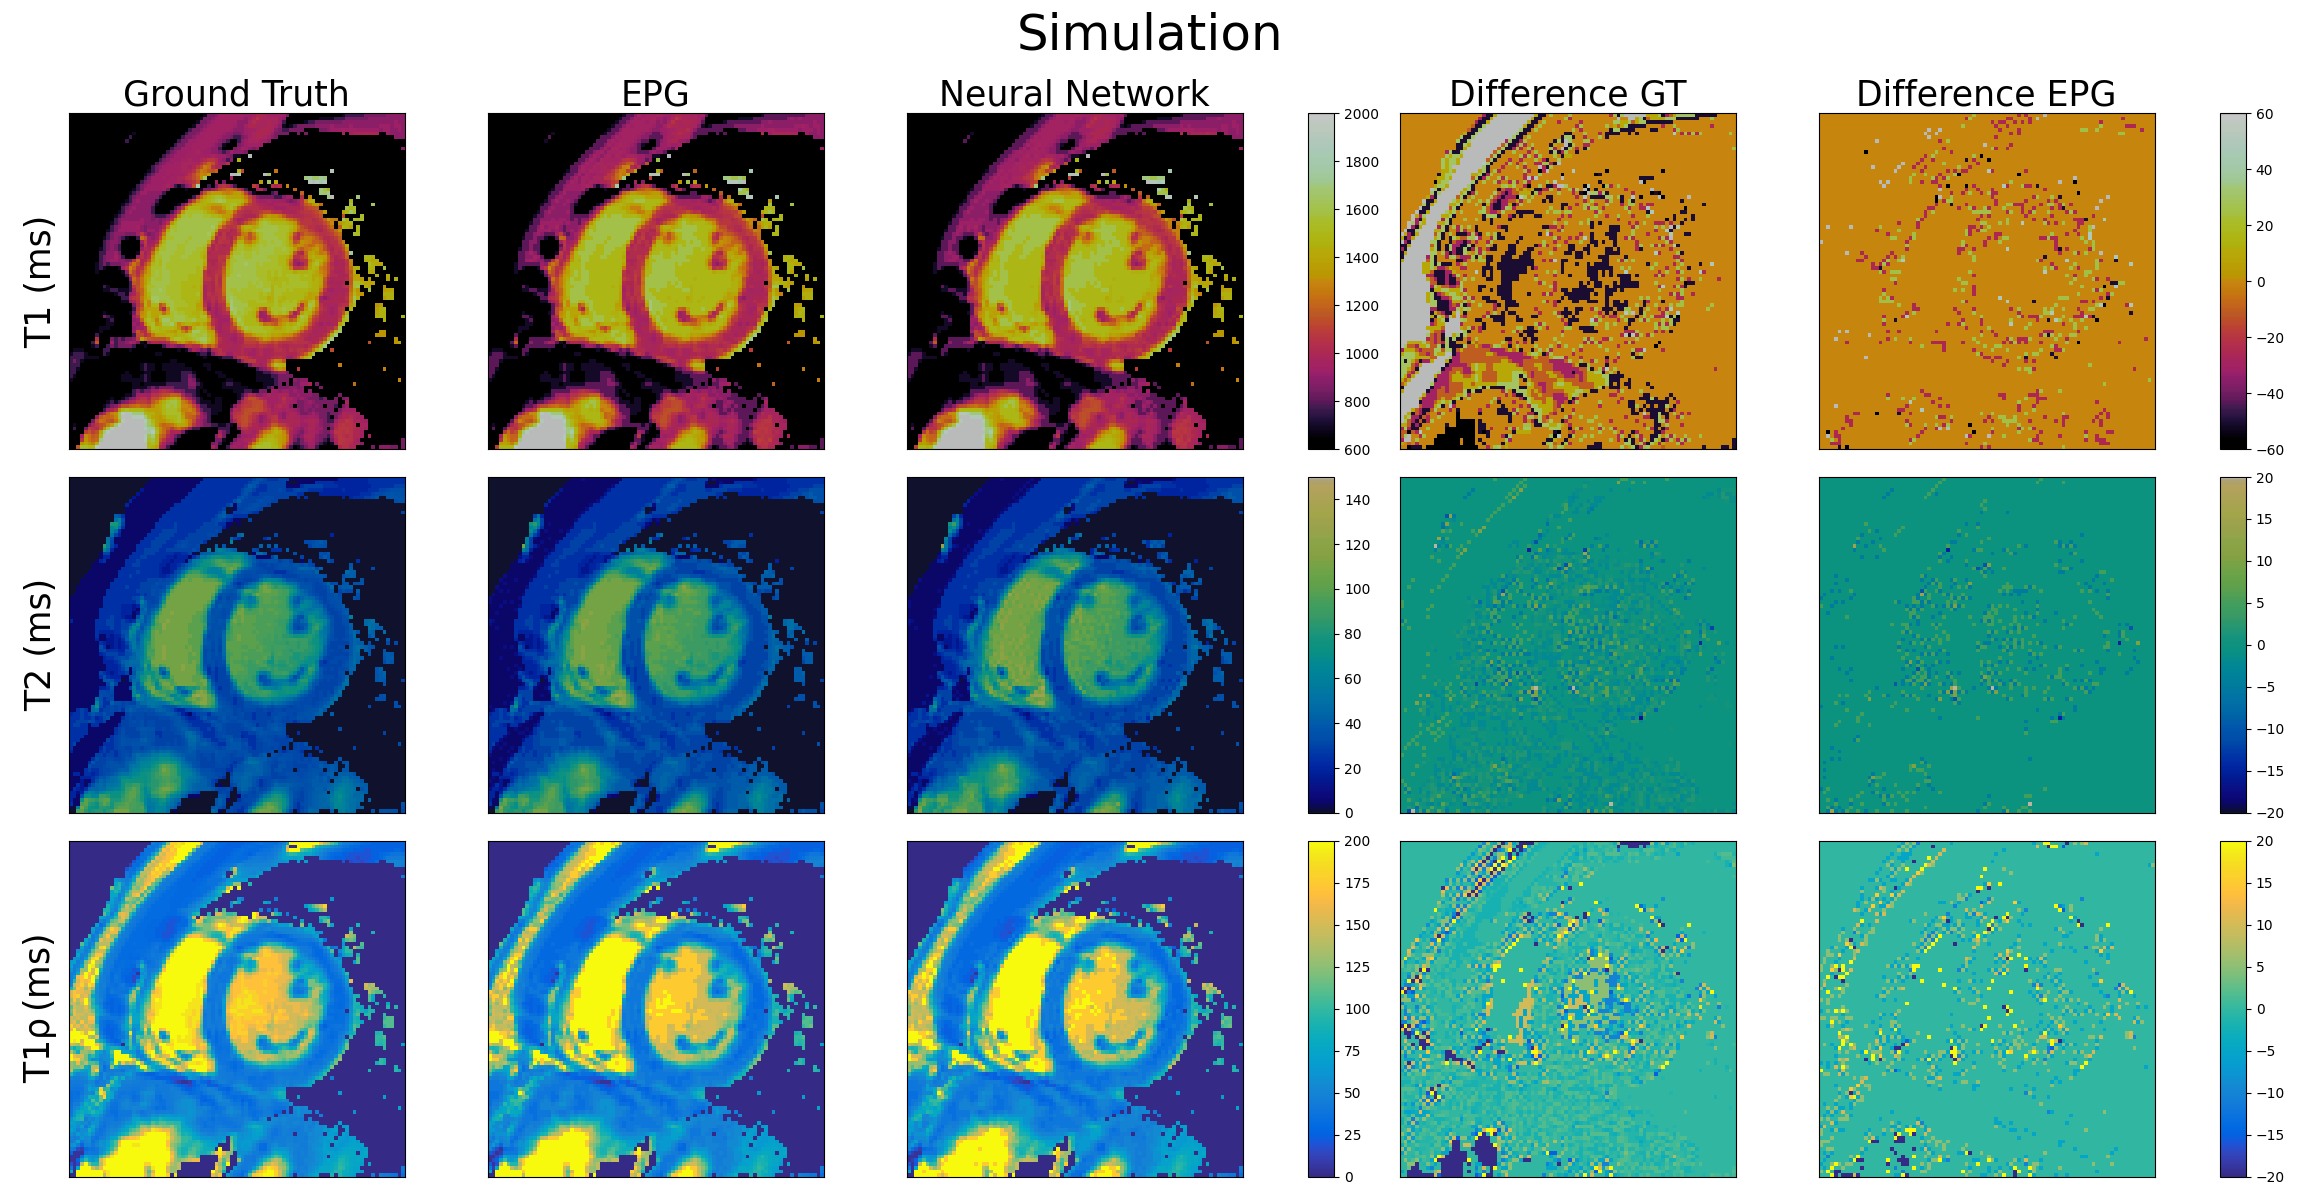
Simulated (60 ± 6 bpm) T1, T2 and T1ρ cardiac MRF maps are shown in Figure 3 for the proposed FFNN dictionary in comparison to the ground truth maps as well as benchmark maps obtained using a dictionary generated by EPG simulations. Good quality maps are obtained with the proposed approach, showing excellent agreement with the ground truth and EPG approaches for all maps. The mean relative error between the FFNN and EPG T1, T2 and T1ρ maps are 0.9%, 3.7% and 3.8% respectively.
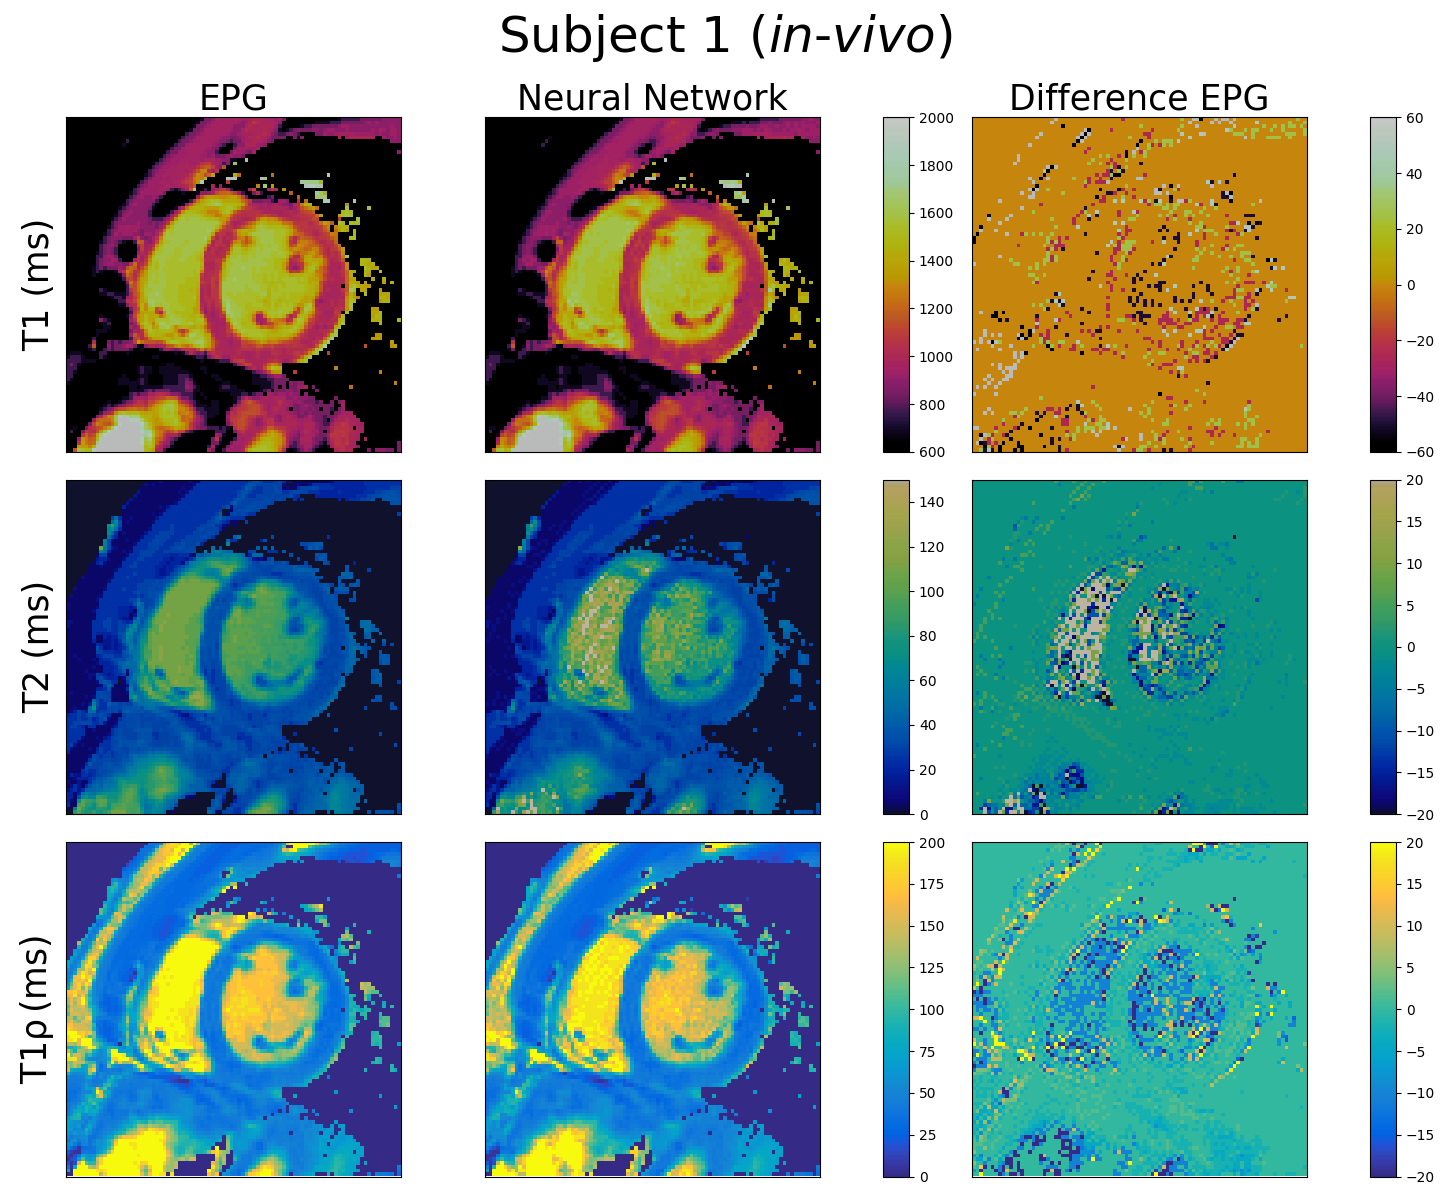
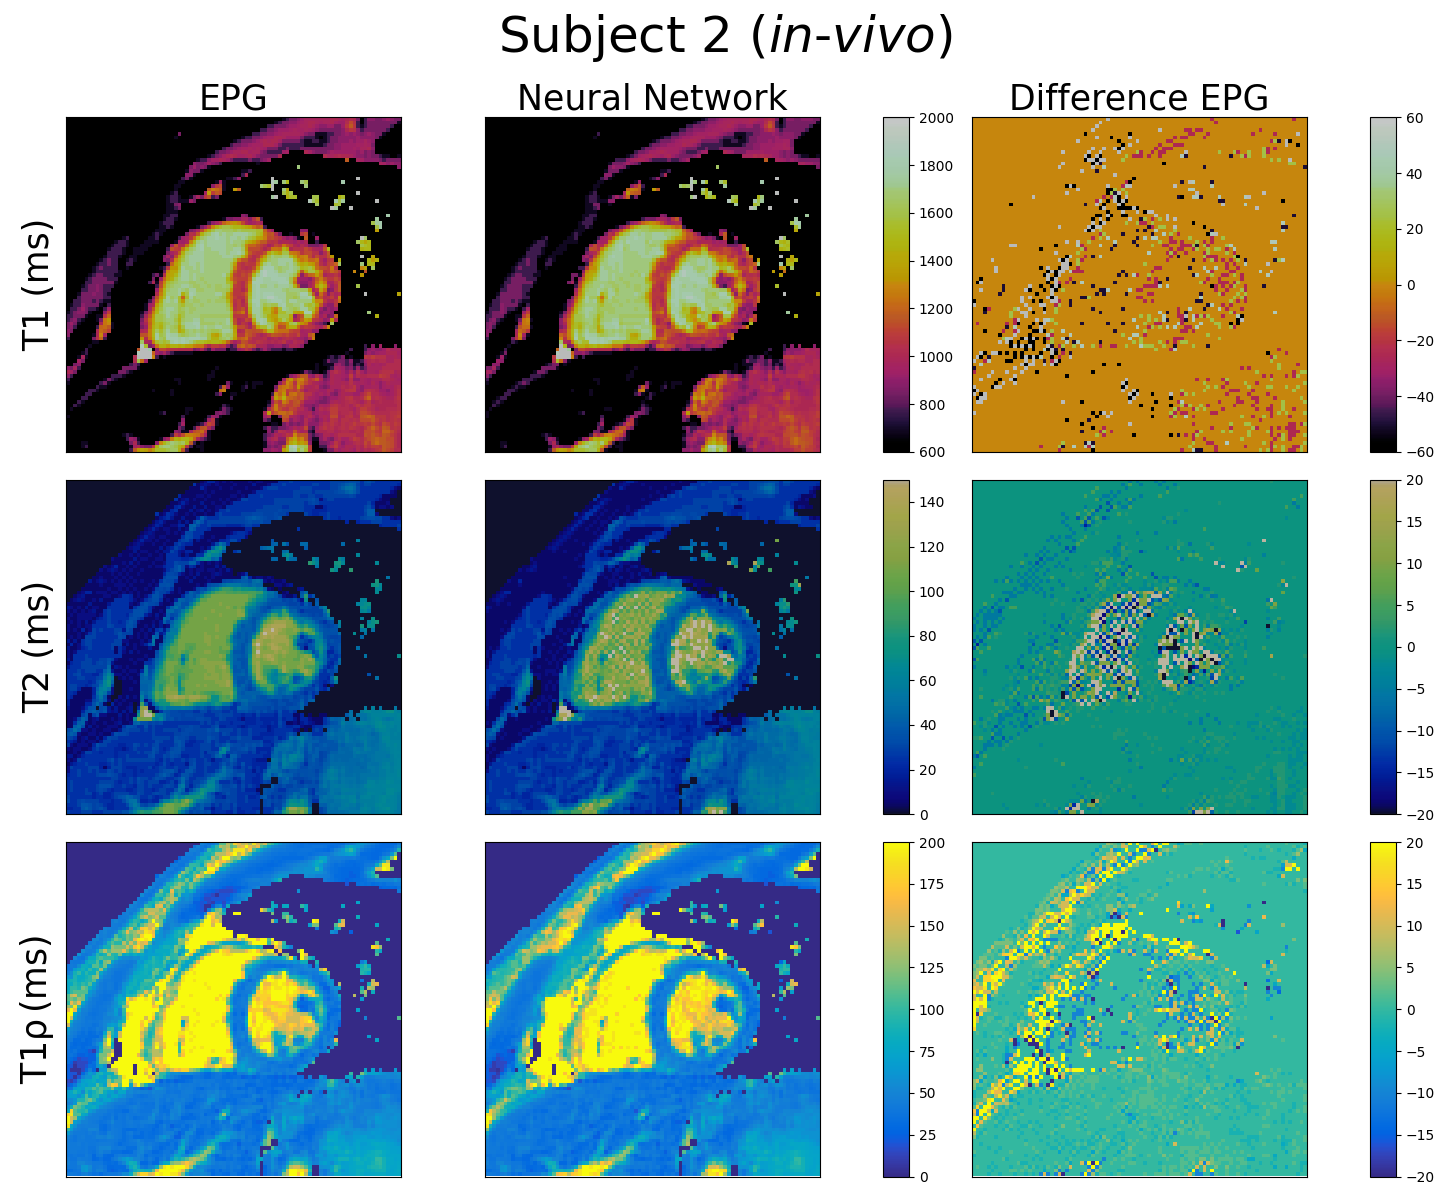
T1, T2 and T1ρ cardiac MRF maps generated using the FFNN and EPG dictionaries are shown in Figures 4 and 5 for healthy subjects 1 (64.3 ± 4.4 bpm) and 2 (60.7± 2.3 bpm) respectively. Again, good quality maps are obtained with the proposed approach, showing excellent agreement with the EPG approach for all maps. The mean relative error for T1, T2 and T1ρ for the full maps for subject 1 are 2.3%, 7.9% and 6.3% respectively. However, the corresponding relative errors for the myocardium are 1.7%, 4.8% and 5.1%. For subject 2 the errors for the full maps are 4.3%, 11.9% and 11.3% for T1, T2 and T1ρ respectively while the errors for the myocardium are 1.7%, 4.5% and 5.1%.
Conclusion
We have proposed and tested a feedforward neural network model capable of accurate dictionary generation for T1, T2, T1ρ and a wide range of heart rates and heart rate variabilities for cardiac MRF. The dictionary-generating model has been validated by producing T1, T2 and T1ρ maps for simulated and in-vivo scans of healthy subjects. Future work will investigate the proposed approach in a larger cohort of subjects.Acknowledgements
This work was supported by the following grants: (1) EPSRC EP/P032311/1, EP/P007619/1, EP/P001009/1; (2) BHF programme grant RG/20/1/34802 and (3) Wellcome/EPSRC Centre for Medical Engineering (WT 203148/Z/16/Z).References
1. Hamilton, Jesse I., et al. "MR fingerprinting for rapid quantification of myocardial T1, T2, and proton spin density." Magnetic resonance in medicine 77 (2017): 1446-1458.2.
2. Liu, Yuchi, et al. "Cardiac magnetic resonance fingerprinting: technical overview and initial results." JACC: Cardiovascular Imaging 11.12 (2018): 1837-1853.3.
3. Cruz, Gastao, et al. "Cardiac magnetic resonance fingerprinting: Technical developments and initial clinical validation." Current cardiology reports 21.9 (2019): 1-10.4.
4. Velasco, C., Cruz, G., Botnar, R. M., Prieto, C. "Simultaneous T1, T2 and T1ρ cardiac Magnetic Resonance Fingerprinting for Contrast-free Myocardial Tissue Characterization", submitted to ISMRM 2021.
5. Hamilton, Jesse I., and Nicole Seiberlich. "Machine learning for rapid magnetic resonance fingerprinting tissue property quantification." Proceedings of the IEEE 108.1 (2019): 69-85.6.
6. Weigel, Matthias. "Extended phase graphs: dephasing, RF pulses, and echoes‐pure and simple." Journal of Magnetic Resonance Imaging 41.2 (2015): 266-295.
Figures