1551
T1Ρ Magnetic Resonance Fingerprinting of Chronic Pancreatitis1Diagnostic Radiology, Oregon Health and Science University, Portland, OR, United States, 2Gastroenterology and Hepatology, Oregon Health and Science University, Portland, OR, United States, 3Surgery, Oregon Health and Science University, Portland, OR, United States
Synopsis
T1 relaxation mapping has been shown to demonstrate significant differences in the pancreas of patients with chronic pancreatitis. However, T2 and T1ρ relaxation times have been largely unexplored in pancreas, due to difficulty acquiring these values in the abdomen. In this study, magnetic resonance fingerprinting (MRF) techniques are applied to simultaneously acquire T1, T2, and T1ρ relaxation times in the pancreas of healthy volunteers and patients with clinically diagnosed chronic pancreatitis (CP). A significant increase in T1 relaxation was found with near significant increases in T2 and T1ρ relaxation times in CP patients.
Introduction
Magnetic resonance fingerprinting (MRF) allows for quantitative mapping of multiple parameters simultaneously, creating inherently co-registered images in the abdomen. Previous work has demonstrated that T1, T2, and T1ρ relaxation times can be acquired within the MRF framework1,2, with some preliminary results in the abdomen of healthy volunteers3. Previous studies have also demonstrated significant differences in the T1 relaxation between patients with chronic pancreatitis (CP) and healthy controls4,5. Since T2 and T1ρ relaxation have been shown to correlate with tissue fibrosis in liver6,7, acquiring these relaxation times may result in a more robust evaluation of the disease, particularly when considering patients for surgery. Therefore, the aim of this study was to acquire MRF T1, T2, and T1ρ relaxation times in healthy controls and patients with clinically diagnosed CP to evaluate the ability of these biomarkers to diagnosis and evaluate CP.Methods
Study Population: Six healthy volunteers with no history of abdominal disease or chronic abdominal pain (4 male, 2 female, 42.3±15.9 years old) and eight patients with diagnosed CP (5 male, 3 female, 54.3±13.2 years old) were recruited under an IRB approved protocol (OHSU #19302).MRI Protocol: A 2D MRF sequence aimed at measuring T1, T2, and T1ρ relaxation times3 was acquired in approximately 6-8 axial slices across the pancreas (each with one breath hold), along with conventional variable flip angle T1 mapping (MapIT) and turbo-spin echo T2 mapping sequences on a 3T Siemens Prisma MR scanner using a 16 channel body array coil and 18 channels of the spine array coil. MRF images were acquired during breath holds and during normal free breathing, without deep breaths.
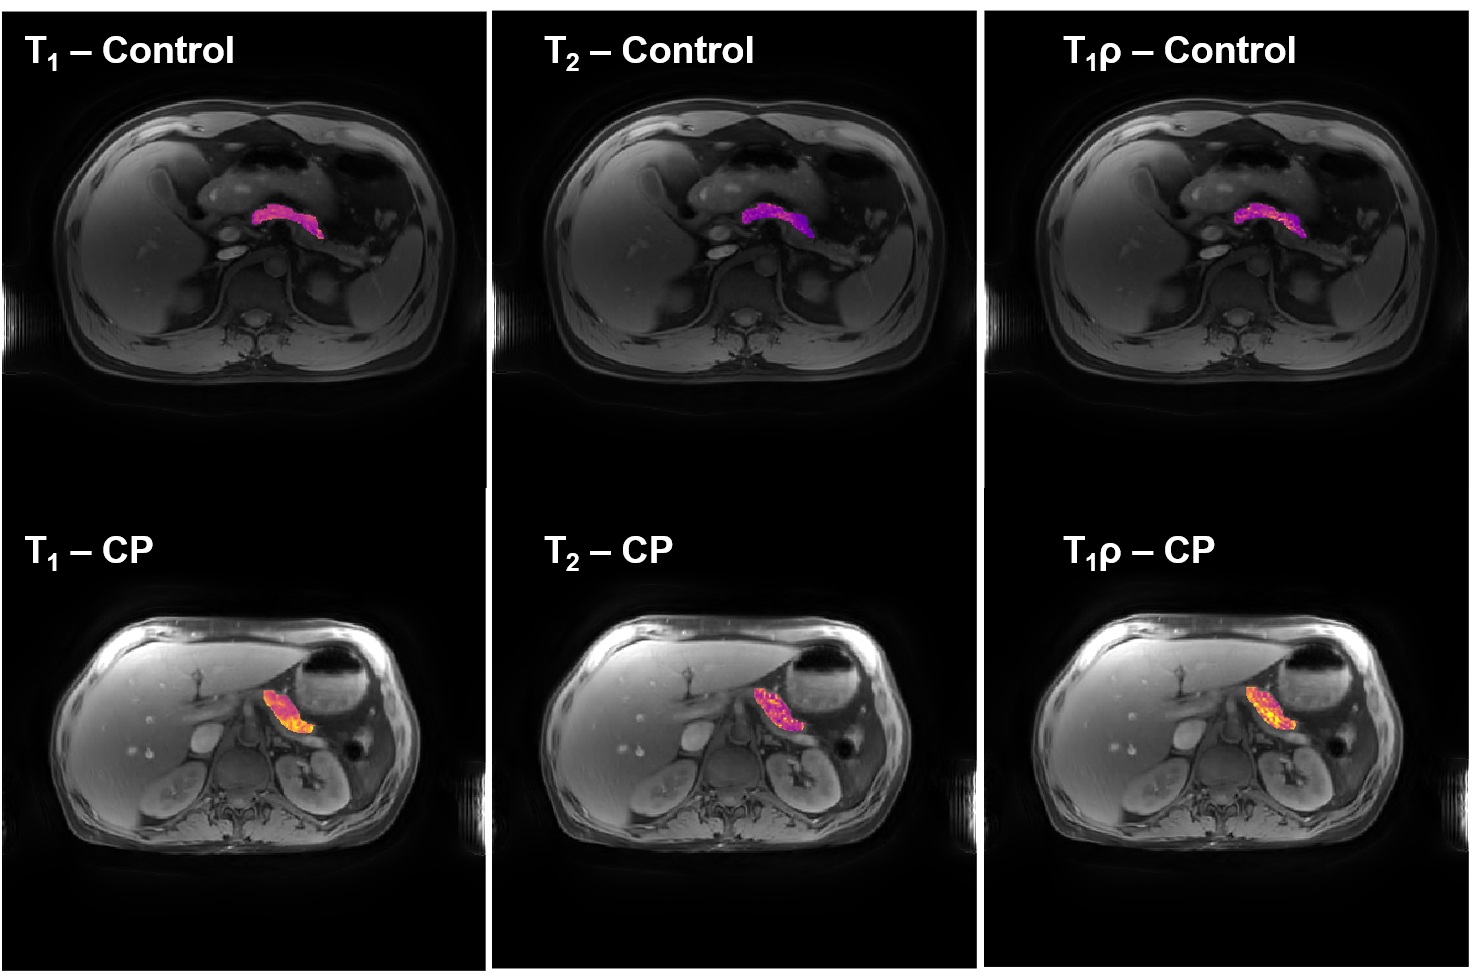
Data Analysis: To fit for the MRF T1, T2, and T1ρ values, a dictionary of possible signals was generated using the Bloch equations previously detailed3. A singular value decomposition (SVD) was performed on the time dimension of the dictionary and the first 5 singular values of the dictionary SVD were chosen and input into the subspace constrained FISTA reconstruction of the Berkeley Advanced Reconstruction Toolbox8 along with the acquired k-space data. The resulting reconstructed singular value images were then compared to the SVD dictionary values to determine the T1, T2, and T1ρ values in each pixel. For each healthy volunteer and patient with CP in our study, the pancreas was segmented in every slice of the MRF first principal component image. For each segmentation, major blood vessels and areas of dilated duct were avoided. Example images of the segmented pancreas and the resulting T1, T2, and T1ρ relaxation maps are shown for a healthy control and patient with CP in Figure 1. A two-tailed student’s t-test was performed between healthy controls and CP patients for the T1, T2, and T1ρ relaxation values.
Results
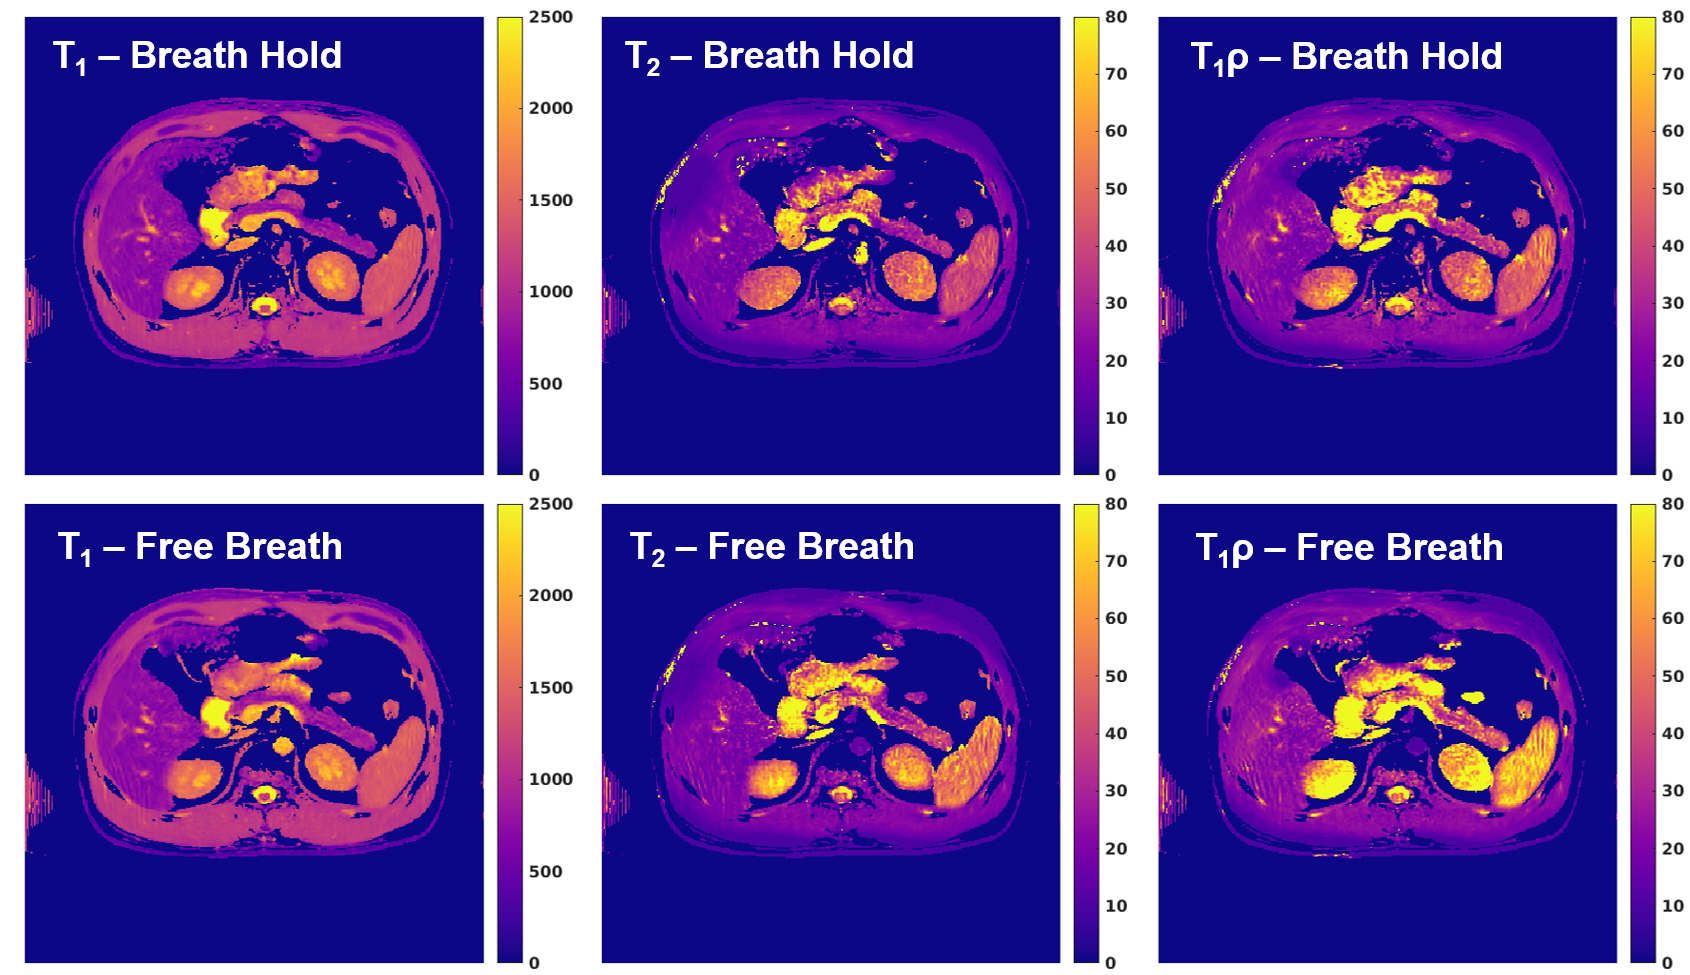
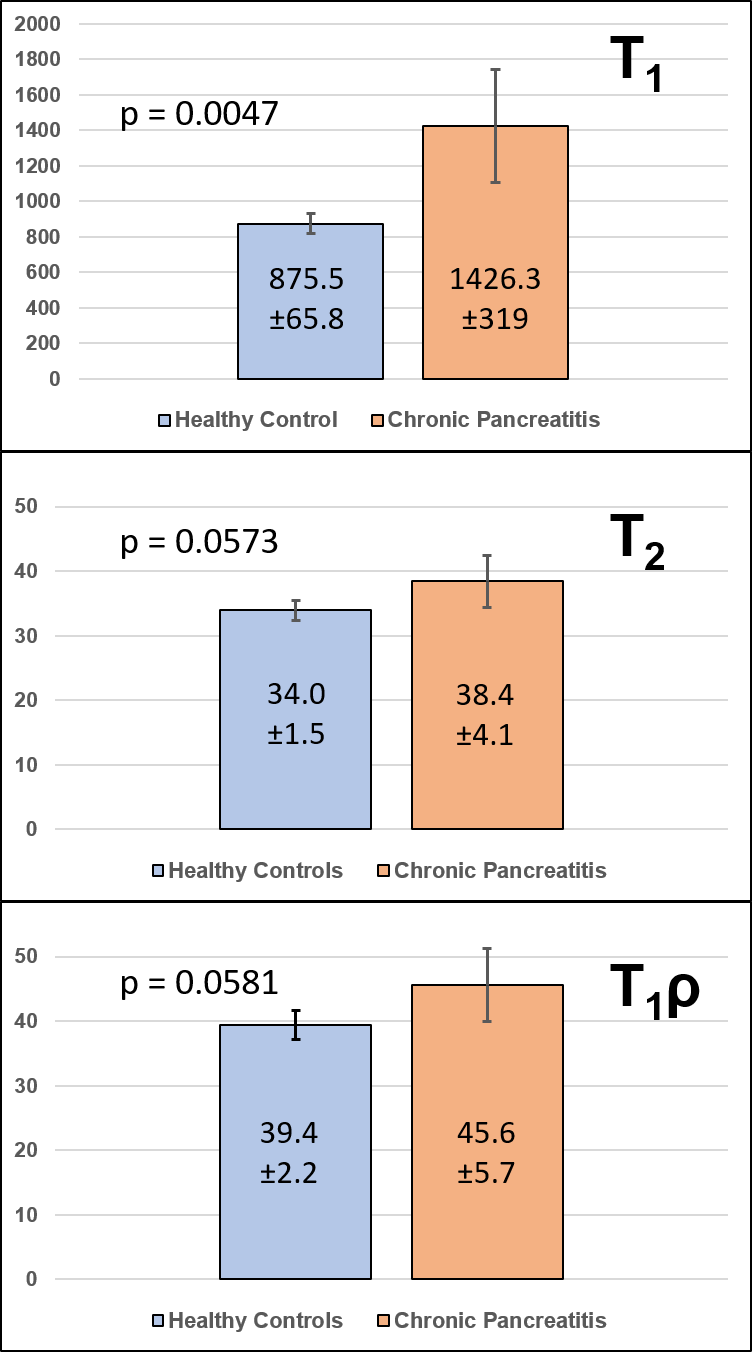
The ages between the two groups (six healthy, eight CP) were similar (p=0.15). Example images of the T1, T2, and T1ρ relaxation maps during breath holding and free breathing are shown for a healthy volunteer in Figure 2. Note the almost identical T1 values and slightly increased T2 and T1ρ values during free breathing, demonstrating the motion insensitivity of the MRF technique in the abdomen. The intraclass correlation coefficient between the free breathing and breath hold MRF values were 0.96, 0.54, and 0.53 respectively. The mean values of T1, T2, and T1ρ of the proposed MRF sequence in healthy controls and in subjects with CP are shown in Figure 3. A significant increase (p=0.0047) in T1 values was found for subjects with CP compared to healthy controls using the student’s t-test. Substantial increases in T2 and T1ρ relaxation times were also seen in CP patients compared to healthy controls (p=0.0573 and p=0.0581, respectively). Conventional T1 and T2 relaxation times were computed for the same patients, with mean T1 and T2 values of 933.3±103ms and 70.3±8.3 for healthy controls, and 1159.1±270ms and 95.9±20.0 for CP subjects.Discussion
These in vivo results show significant (or near significant) increases in the T1, T2, and T1ρ relaxation times in patients with clinically diagnosed CP. Previous studies have also demonstrated significant differences in the T1 relaxation between patients with CP and healthy controls[4, 5], similar to those seen in this study. The T1 relaxation differences using MRF were slightly higher than conventional techniques, owing to the fat saturation present in the MRF and CP subjects with fatty infiltration. This is the first study reporting T2 and T1ρ relaxation in CP, and we speculate that the increase in these relaxation values in CP is due to increases in pancreatic fibrosis, similar to studies in the liver. Lastly, the free breathing MRF values were similar to the breath holding values, with small increases in T2 and T1ρ, suggesting the possibility of free breathing acquisition of these quantitative values in the future.Conclusions
This study demonstrates the ability of MRF techniques to acquire T1, T2, and T1ρ maps quickly for the diagnosis of chronic pancreatitis, with all images co-registered. Future work will focus on correlating the relaxation time measurements with biopsy samples and clinical classifications of CP, as well as comparing different regions of the pancreas.Acknowledgements
Grant Support: This project was supported in part by a training fellowship from the Brenden-Colson Center for Pancreatic Care, NIDDK grant R01DK117459, and a Medical Research Foundation New Investigator grant.References
1. Sharafi, A., et al., MR fingerprinting for rapid simultaneous T1 , T2 , and T1 rho relaxation mapping of the human articular cartilage at 3T. Magn Reson Med, 2020. 84(5): p. 2636-2644.
2. Ma, S., et al., Three-dimensional whole-brain simultaneous T1, T2, and T1rho quantification using MR Multitasking: Method and initial clinical experience in tissue characterization of multiple sclerosis. Magn Reson Med, 2020.
3. Wyatt, C.R., T.M. Barbara, and A.R. Guimaraes, T1rho magnetic resonance fingerprinting. NMR Biomed, 2020: p. e4284.
4. Tirkes, T., et al., T1 mapping for diagnosis of mild chronic pancreatitis. J Magn Reson Imaging, 2017. 45(4): p. 1171-1176.
5. Tirkes, T., et al., Quantitative MR Evaluation of Chronic Pancreatitis: Extracellular Volume Fraction and MR Relaxometry. AJR Am J Roentgenol, 2018: p. 1-10.
6. Guimaraes, A.R., et al., T2 relaxation time is related to liver fibrosis severity. Quant Imaging Med Surg, 2016. 6(2): p. 103-14.
7. Singh, A., et al., T1rho MRI of healthy and fibrotic human livers at 1.5 T. J Transl Med, 2015. 13: p. 292.
8. Uecker M, O.F., Tamir J, Bahri D, Virtue P, Cheng J, Zhang T, Lustig M., Berkeley advanced reconstruction toolbox, in Proceedings of the 23rd annual meeting of ISMRM. 2015: Toronto. p. p. 2486.
Figures