1545
High-resolution myelin-water fraction (MWF) and T1/T2/proton-density mapping using 3D ViSTa-MR fingerprinting with subspace reconstruction1Radiological Sciences Laboratory, Stanford University, Stanford, CA, United States, 2Center for Brain Imaging Science and Technology, College of Biomedical Engineering & Instrument Science, Zhejiang University, Hangzhou, China, 3Techna Institute, University Health Network, Toronto, ON, Canada, 4Department of Imaging Sciences, University of Rochester, Rochester, NY, United States
Synopsis
In this work, we developed ViSTa-MRF, which combined Visualization of Short Transverse relaxation time component (ViSTa) technique with MR Fingerprinting (MRF), to achieve whole-brain myelin-water fraction (MWF) and T1/T2/PD mapping at 1mm isotropic resolution in 10 minutes on a clinical 3T scanner. To achieve this fast acquisition, the ViSTa-MRF sequence also leverages an efficient 3D-spiral-projection acquisition along with spatiotemporal subspace reconstruction. With the proposed ViSTa-MRF method, direct MWF mapping was achieved without a need for multicompartment fitting. In comparison to conventional myelin-water imaging, the ViSTa-MRF method can provide improved-SNR and faster acquisition with high image-quality.
Introduction
Myelin-Water Fraction (MWF) mapping has shown great potential in characterizing brain’s myelination and demyelination. Conventional MWF-mapping utilizes a multi-echo spin-echo(1) or gradient-echo sequence(2) and multi-compartment fitting of the exponential decay to extract the shorter relaxation time of myelin-water. However, such fitting is ill-conditioned and prone to noise. To improve MWF-mapping, the ViSTa technique(3,4) was proposed for direct visualization of myelin-water. Here, a specifically configured double inversion-recovery sequence is employed, where the long T1-component is suppressed and those signals from short T1-components of myelin-water are preserved. The key challenges of ViSTa are the decreased SNR from the signal suppression and the long acquisition time. Recently, MWF-mapping has also been performed using a modified MR Fingerprinting sequence(5,6), specifically designed to provide good signal separability between myelin-water and other tissue types. Nonetheless, multicompartment fitting is still required to extract MWF, which can be challenging, necessitating the use of predefined compartments with fixed T1 and T2 values(7).In this work, we incorporate ViSTa into MR fingerprinting (ViSTa-MRF), to improve the speed and accuracy of MWF-mapping. With the ViSTa inversion-preparation, the first time-point of ViSTa-MRF will contain direct myelin-water signal. By utilizing spatiotemporal subspace reconstruction(8,9), the spatio-temporal encoding information across the whole ViSTa-MRF time-series is employed to reconstruct this direct myelin-water data at high acceleration, providing MWF-mapping without need for multicompartment modeling. Using ViSTa-MRF along with an efficient 3D-spiral-projection acquisition (10), we demonstrate high-quality whole-brain 1mm3 MWF and T1/T2/PD maps in ~10 minutes.
Methods
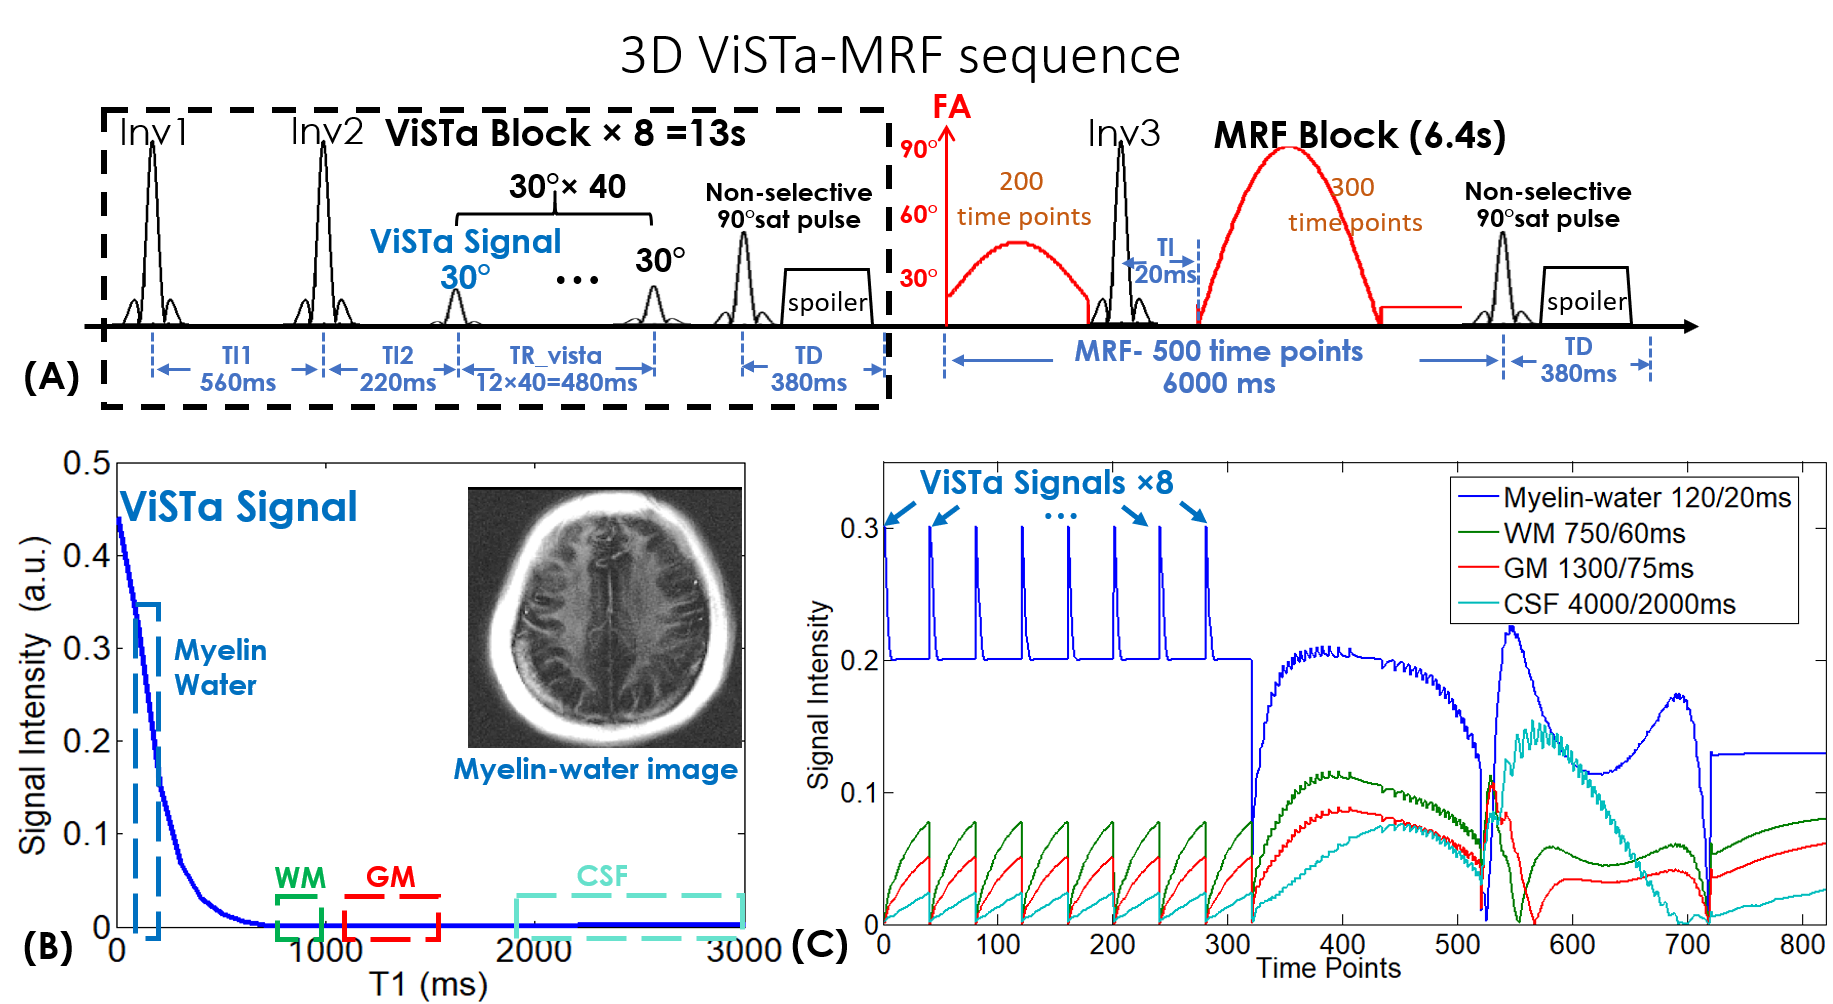
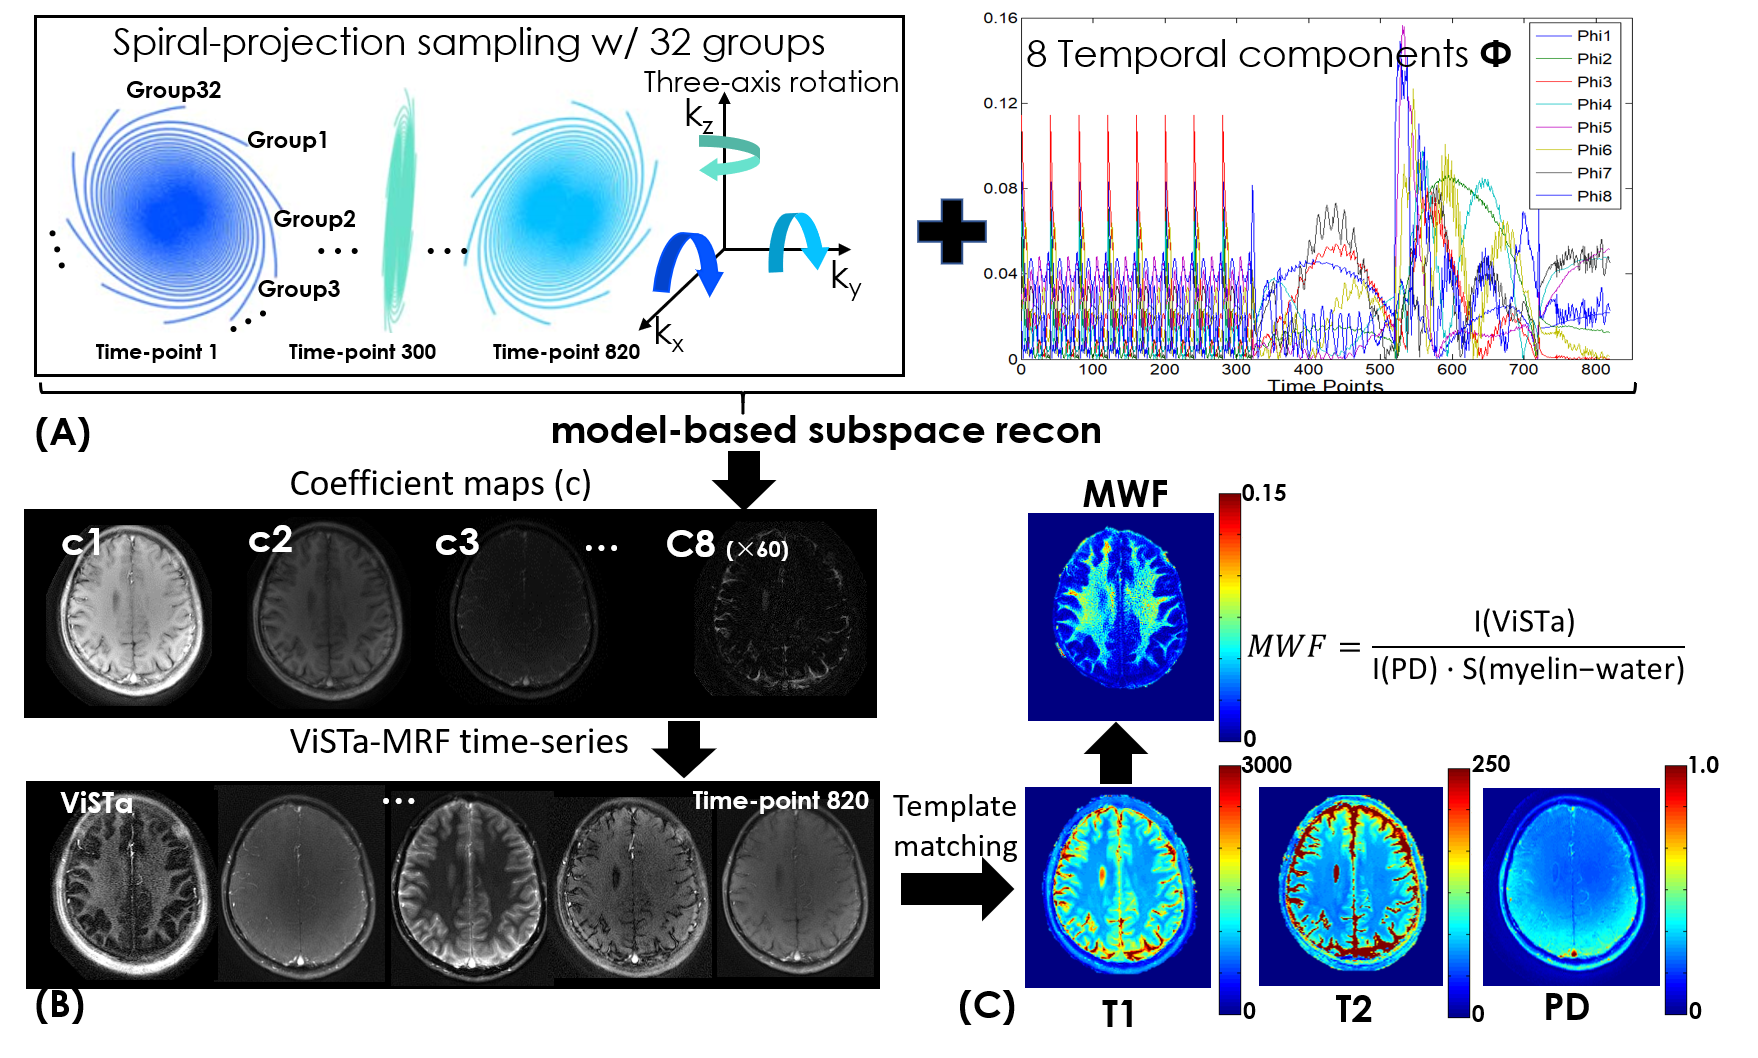
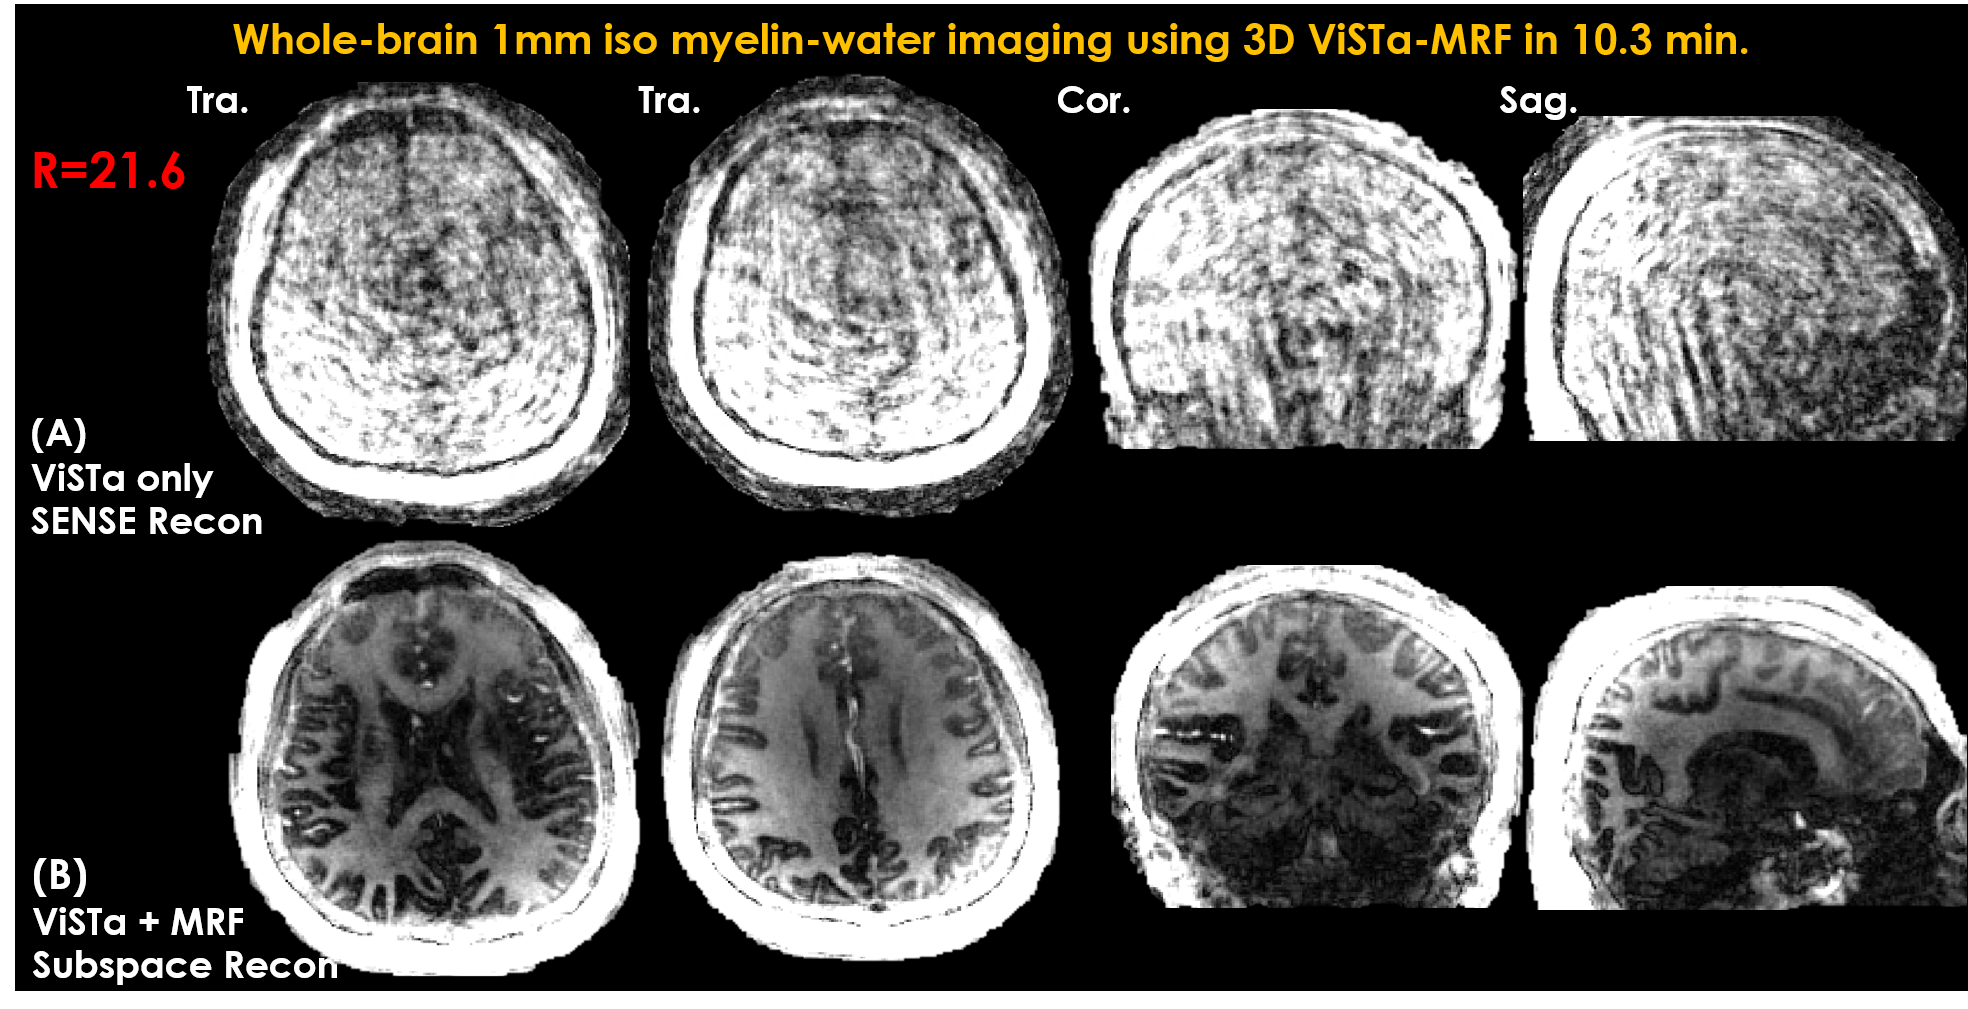
Pulse sequence: Figure1(A) shows the diagram of the proposed ViSTa-MRF sequence, where each acquisition group consists of eight ViSTa blocks and one MRF block. In each ViSTa block, a double inversion-recovery is performed, with the first subsequent signal time-point labeled the “ViSTa signal”. Through extended-phase-graph (EPG) simulation(11), Fig.1(B) shows that the myelin-water signal with short-T1 is preserved in the ViSTa signal, while the white-matter (WM), gray-matter (GM) and CSF are suppressed, which enables direct myelin-water imaging. Figure1(C) shows the ViSTa-MRF signal curves with good signal separability between the different tissue types. To increase the emphasis on the encoding of the short-T1 signal, the ViSTa-MRF sequence acquires forty FISP-readouts with 30° excitations after each ViSTa block and repeat the block eight times with different spatial-encodings, as reflected on the signal curves in Fig1.(C). After the ViSTa blocks, 500-time-point FISP-MRF data are acquired. Between the acquisition blocks, a 90° saturation pulse with a waiting time of 380ms is used to saturate flow effects and achieve steady-state longitudinal magnetization. A total of 820 time points is acquired in each acquisition group across 19.4s.Acquisitions: 3D-spiral-projection trajectory was used for ViSTa-MRF acquisition at 1-mm whole-brain on a 3T Siemens Prisma scanner with a 64 channel head-neck coil: FOV:220×220×220mm3, TR/TE=12/2.5ms with a 7.0ms spiral readout. 32 acquisition groups were acquired, where the in-plane 16x-undersampled spiral interleaves in each group were designed to rotate around kx, ky, and kz axes by tiny-golden-angle to maximize the incoherence between each time point (Fig.2(A)). This resulted in a scan time of 19.4s×32 = 10.3 minutes, where the acceleration factor of each time point is 16×(220/2)×π/32=172.8. With 8 ViSTa blocks, the acceleration factor of the ViSTa signal is 172.8/8=21.6.
Post-processing: Subspace reconstruction was performed, where ViSTa-MRF dictionary was generated and the first eight principal components were selected as the temporal basis Φ shown in Fig2(A). The desired ViSTa-MRF time-series x is expressed as x=Φc, where c are the temporal coefficient maps. Figure2(B) shows the flowchart of the subspace reconstruction, which could be described as:
$$ min_{c}\bf || MFSΦc|| +\lambda_{1}||c||_{2}+\lambda_{1}||c||_{*} , $$
where S are coil sensitivities, F are the non-uniform FFT operators, M are the undersampling patterns, λ1 and λ2 are the regularization parameters. As shown in Fig.2(C), the reconstructed c are used to generate the ViSTa-MRF time-series. Template matching is then applied to extract T1/T2/PD maps, while the quantitative MWF map is derived using the first time-point ViSTa image I(ViSTa) and the PD map I(PD):
$$ MWF =\frac{I_{(ViSTa)}}{I_{(PD)}\cdot S_{(myelin-water)}} , $$
where S(myelin-water) is the EPG-simulated signal intensity in ViSTa image using nominal T1(120ms) and T2(20ms) values of myelin-water. All post-processings were performed using MATLAB and BART(12).
Results
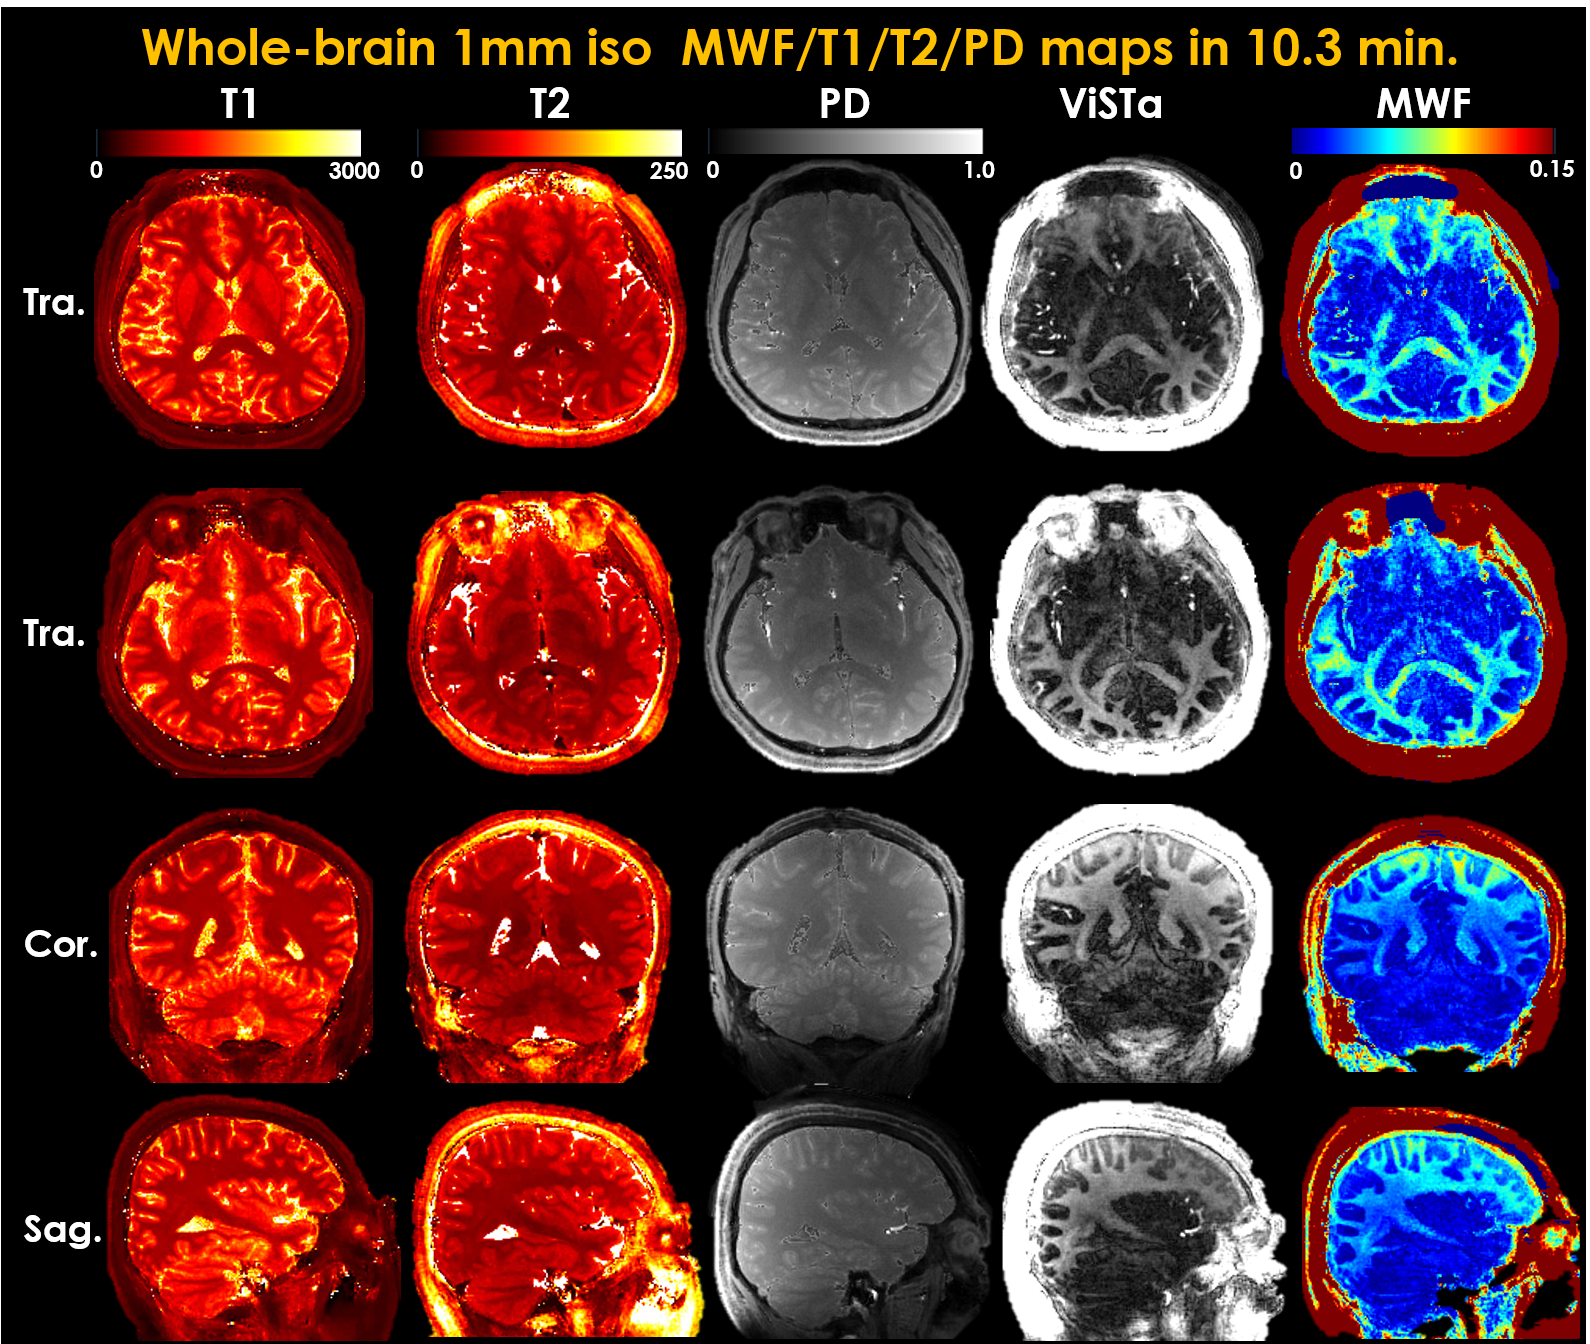
Figure3 shows the ViSTa images reconstructed by parallel imaging and subspace reconstruction at R=21.6. Compared to a direct SENSE reconstruction of the ViSTa data, the joint subspace reconstruction of ViSTa and MRF time-series significantly reduces aliasing artifacts on the ViSTa image, demonstrating the benefit in leveraging the joint spatiotemporal encoding information.Figure4 shows whole-brain 1mm3 T1/T2/PD/ViSTa and MWF maps in three orthogonal views, where high-quality results are observed from this fast acquisition.
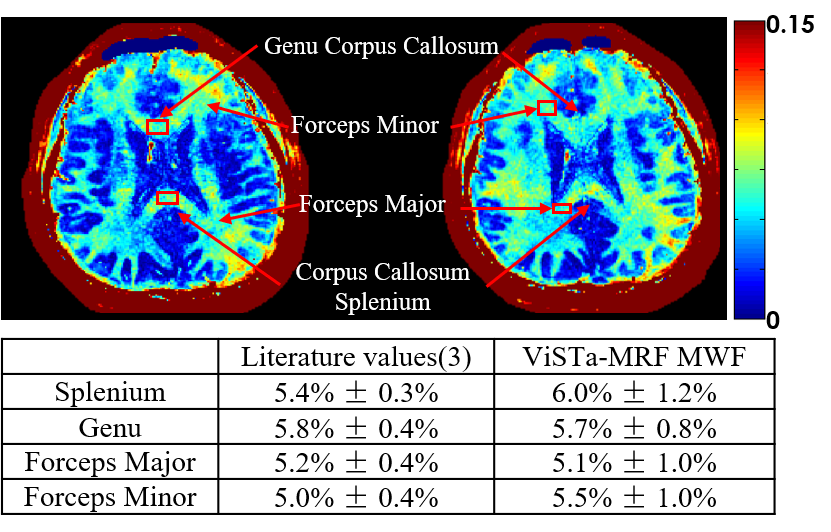
Figure5 shows the MWF maps from two representative slices, where the MWF values from ViSTa-MRF across four WM regions are consistent with the literature results(3). Low-frequency signal bias can be observed in our MWF results, likely from B1+ inhomogeneity and the large FAs used in the MRF-ViSTa sequence (ranged from 10°-82°), which we aim to correct in future work as per(13).
Discussion and conclusion
In this work, we developed a 3D ViSTA-MRF sequence together with subspace reconstruction to achieve rapid high-isotropic-resolution MWF and T1/T2/PD mapping in a single scan. In comparison to conventional myelin-water imaging, the proposed method can provide improved-SNR, faster, and high-quality parametric mapping.Acknowledgements
This work was supported in part by NIH research grants: R01-EB020613, R01-EB019437, R01-MH116173, P41EB030006, and U01-EB025162.References
1. Mackay A, Whittall K, Adler J, Li D, Paty D, Graeb D. In vivo visualization of myelin water in brain by magnetic resonance. Magn. Reson. Med. 1994;31:673–677
2. Du YP, Chu R, Hwang D, et al. Fast multislice mapping of the myelin water fraction using multicompartment analysis of T2* decay at 3T: A preliminary postmortem study. Magn. Reson. Med. 2007;58:865–870.
3. Oh SH, Bilello M, Schindler M, Markowitz CE, Detre JA, Lee J. Direct visualization of short transverse relaxation time component (ViSTa). Neuroimage 2013;83:485–492.
4. Wu Z, Bilgic B, He H, et al. Wave-CAIPI ViSTa: highly accelerated whole-brain direct myelin water imaging with zero-padding reconstruction. Magn. Reson. Med. 2018;80:1061–1073.
5. Chen Y, Chen MH, Baluyot KR, Potts TM, Jimenez J, Lin W. MR fingerprinting enables quantitative measures of brain tissue relaxation times and myelin water fraction in the first five years of life. Neuroimage 2019;186:782–793.
6. Cao P, Cui D, Chan Q, Hui ES. A Multi-Inversion-Recovery (mIR) Myelin Water Mapping (MWF)-MRF Sequence. In: ISMRM. ; 2020. p. 0048.
7. Deshmane A, McGivney DF, Ma D, et al. Partial volume mapping using magnetic resonance fingerprinting. NMR Biomed. 2019;32:e4082.
8. Zhao B, Setsompop K, Adalsteinsson E, et al. Improved magnetic resonance fingerprinting reconstruction with low-rank and subspace modeling. Magn. Reson. Med. 2018;79:933–942.
9. Liang Z. Spatiotemporal Imagingwith Partially Separable Functions. In: 2007 4th IEEE International Symposium on Biomedical Imaging: From Nano to Macro. ; 2007. pp. 988–991..
10. Cao X, Ye H, Liao C, Li Q, He H, Zhong J. Fast 3D brain MR fingerprinting based on multi‐axis spiral projection trajectory. Magn. Reson. Med. 2019;82:289–301.
11. Weigel M. Extended phase graphs: Dephasing, RF pulses, and echoes - Pure and simple. J. Magn. Reson. Imaging 2015;41:266–295.
12. Uecker M, Ong F, Tamir J, et al. Berkeley advanced reconstruction toolbox. ISMRM 2015 p.2486.
13. Hamilton JI, Jiang Y, Ma D, et al. Investigating and reducing the effects of confounding factors for robust T 1 and T 2 mapping with cardiac MR fingerprinting. Magn. Reson. Imaging 2018;53:40–51.
Figures