1541
Reproducibility of 3D MR Fingerprinting with Different Dictionary Resolution in the Healthy Human Brain1Kyoto University, Graduate School of Medicine, Kyoto, Japan
Synopsis
3D MR Fingerprinting was introduced as a rapid quantitative MRI technique, enabling higher SNR efficiency and spatial resolution than the 2D counterpart. As a crucial element of MRF reconstruction, the impact of dictionary resolution on MRF performance is essential to be investigated. Following our phantom study, which determined equivalent accuracy and repeatability of 3D MRF using two different dictionary resolutions, a reproducibility study in healthy volunteers was performed. This study demonstrated a comparable 3D MRF reproducibility from two different dictionary resolutions in most brain parenchyma. Yet, lower reproducibility was evident in CSF measurement, more obviously in a higher resolution dictionary.
Introduction
Since its inception in 20131, MRF’s various clinical application potentials have been studied, including mesial temporal lobe epilepsy2, Parkinson’s disease3, frontotemporal lobe degeneration4, brain tumor5, and brain perfusion6. 3D MRF was recently introduced, facilitating higher SNR efficiency and spatial resolution than the 2D counterpart.7,8 As a crucial MRF reconstruction element, the impact of dictionary resolution on MRF performance is essential to be investigated. Following our phantom study, which determined 3D MRF accuracy and repeatability, we performed this study to evaluate 3D MRF reproducibility using two different dictionary resolutions in healthy volunteers.Methods
The institutional review board approved this prospective study and 39 healthy volunteers were enrolled with written consent. Twenty participants underwent a whole-brain 3D MRF scan in two 3-T MRI (MAGNETOM Prisma; Siemens Healthineers) with 64-channel head/neck coil, and the rest in either scanner.We implemented a 3D Fast Imaging with Steady State Precession (FISP) MRF sequence7 with 1 mm in-plane resolution; field of view (FOV), 240 × 240 × 192 mm3; echo time (TE), 2.7 ms; repetition time (TR), 12-13 ms (varied with a Perlin noise pattern); flip angle (FA), 5-80° (varied sinusoidally); Kz acceleration factor, 3; time points per Kz, 450. Two dictionaries were used for pattern matching. The low-density dictionary (LDD) has 105 T1 entries (0:10:100, 120:20:1000, 1040:40:2000, 2050:100:4500) and 100 T2 entries (0:2:100, 105:5:150, 160:10:300, 350:50:1000, 1100:100:1600, 1800:200:3000), meanwhile the high-density dictionary (HDD) has 1150 entries for both T1 and T2 (0:1:100, 102:2:1000, 1010:10:7000). T1-weighted images were also obtained using 3D-MPRAGE: FOV, 230 × 230 mm; matrix size, 256 × 256; slice thickness, 0.9 mm.
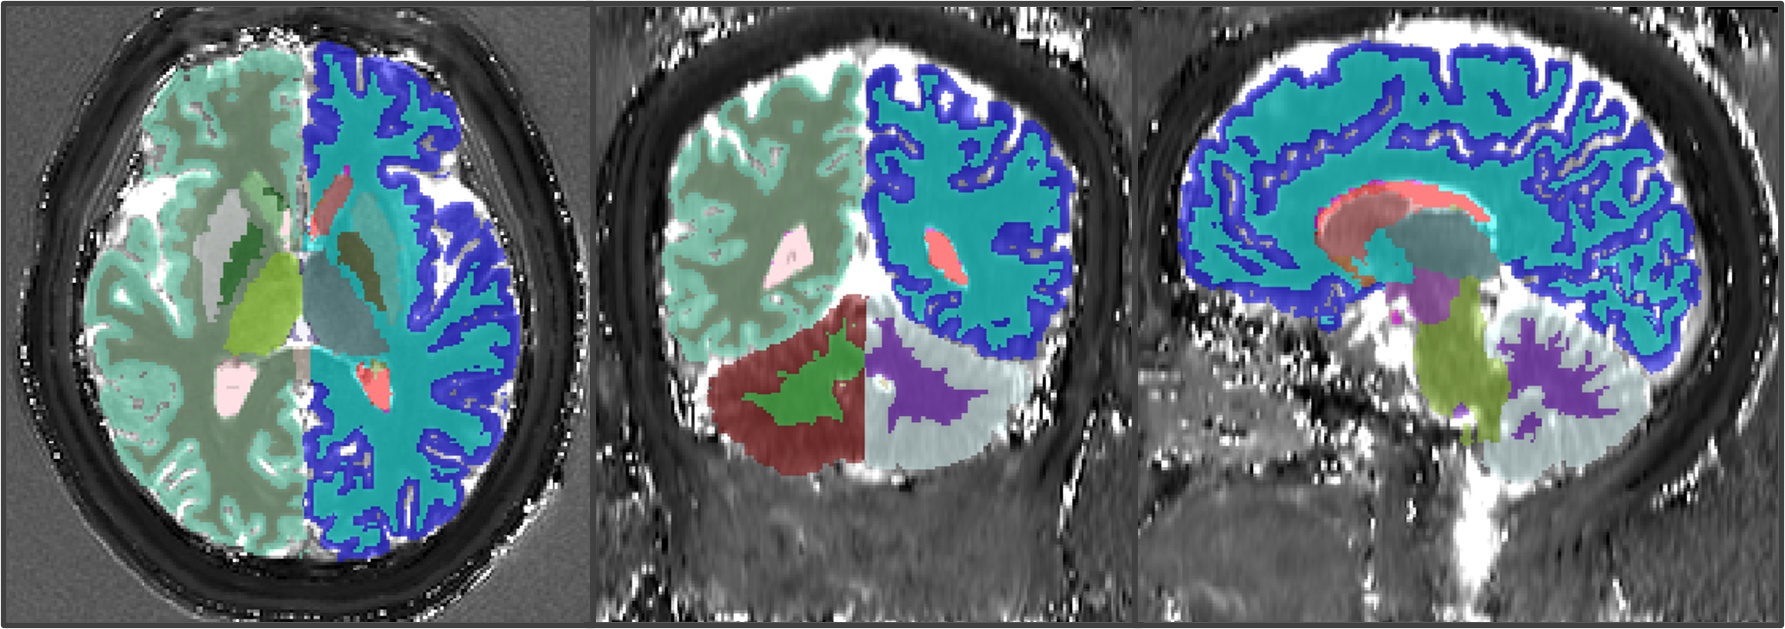
T1 and T2 maps were co-registered with T1-weighted images. Average DARTEL normalized maps were then created in SPM 12 (https://www.fil.ion.ucl.ac.uk/spm/software/spm12/). T1-weighted images were segmented using the default “recon-all” command of Freesurfer 7 (https://surfer.nmr.mgh.harvard.edu/). Several VOIs, including cerebral-cerebellar white and grey matter, thalamus, caudate nucleus, putamen, globus pallidus, hippocampus, and lateral ventricle, were selected. Mean T1 and T2 values were extracted from MRF maps in the native space using the ITK-SNAP (http://www.itksnap.org/), as depicted in Figure 1. We also performed map subtraction between HDD and LDD using ImageJ (https://imagej.nih.gov/ij/).
Reproducibility was determined by calculating the Bland-Altman (BA) plots and intraclass correlation coefficient (ICC) between MRF maps from different scanners. We also performed the ICC analysis and image subtraction to check MRF’s agreement between dictionaries. Root-mean-square error (RMSE) was then calculated based on subtracted images.
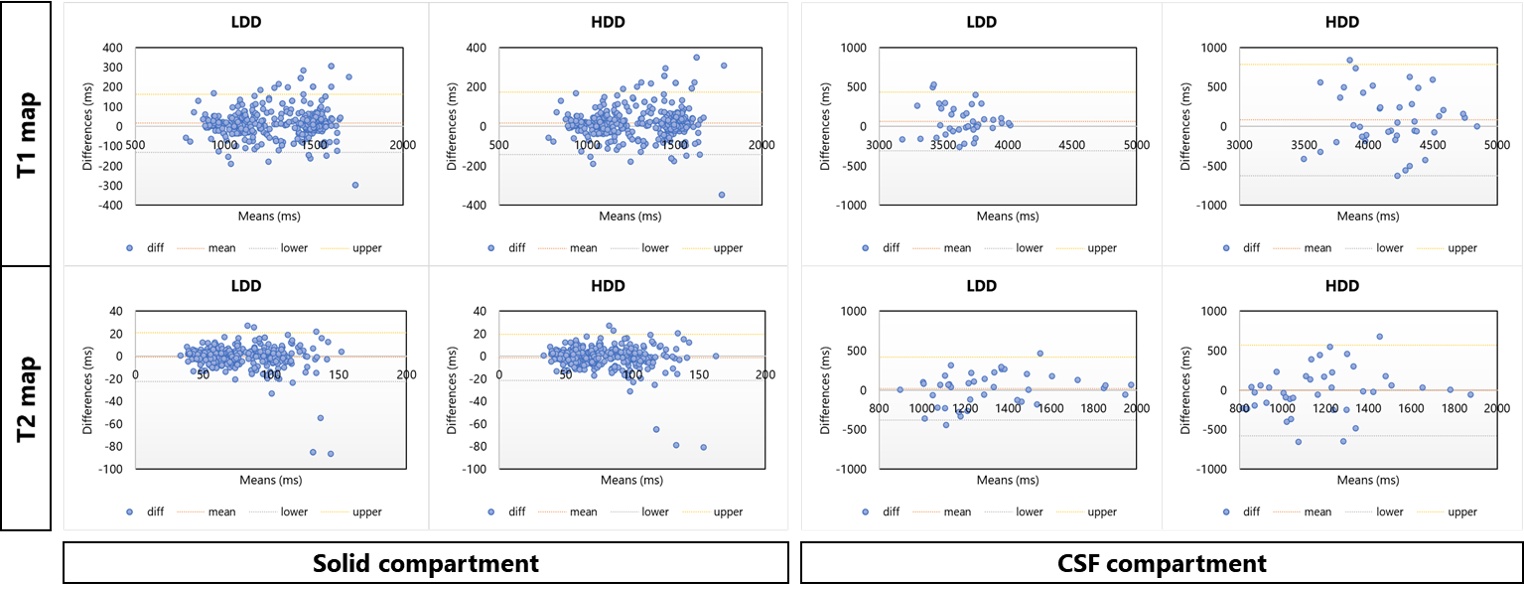
Results
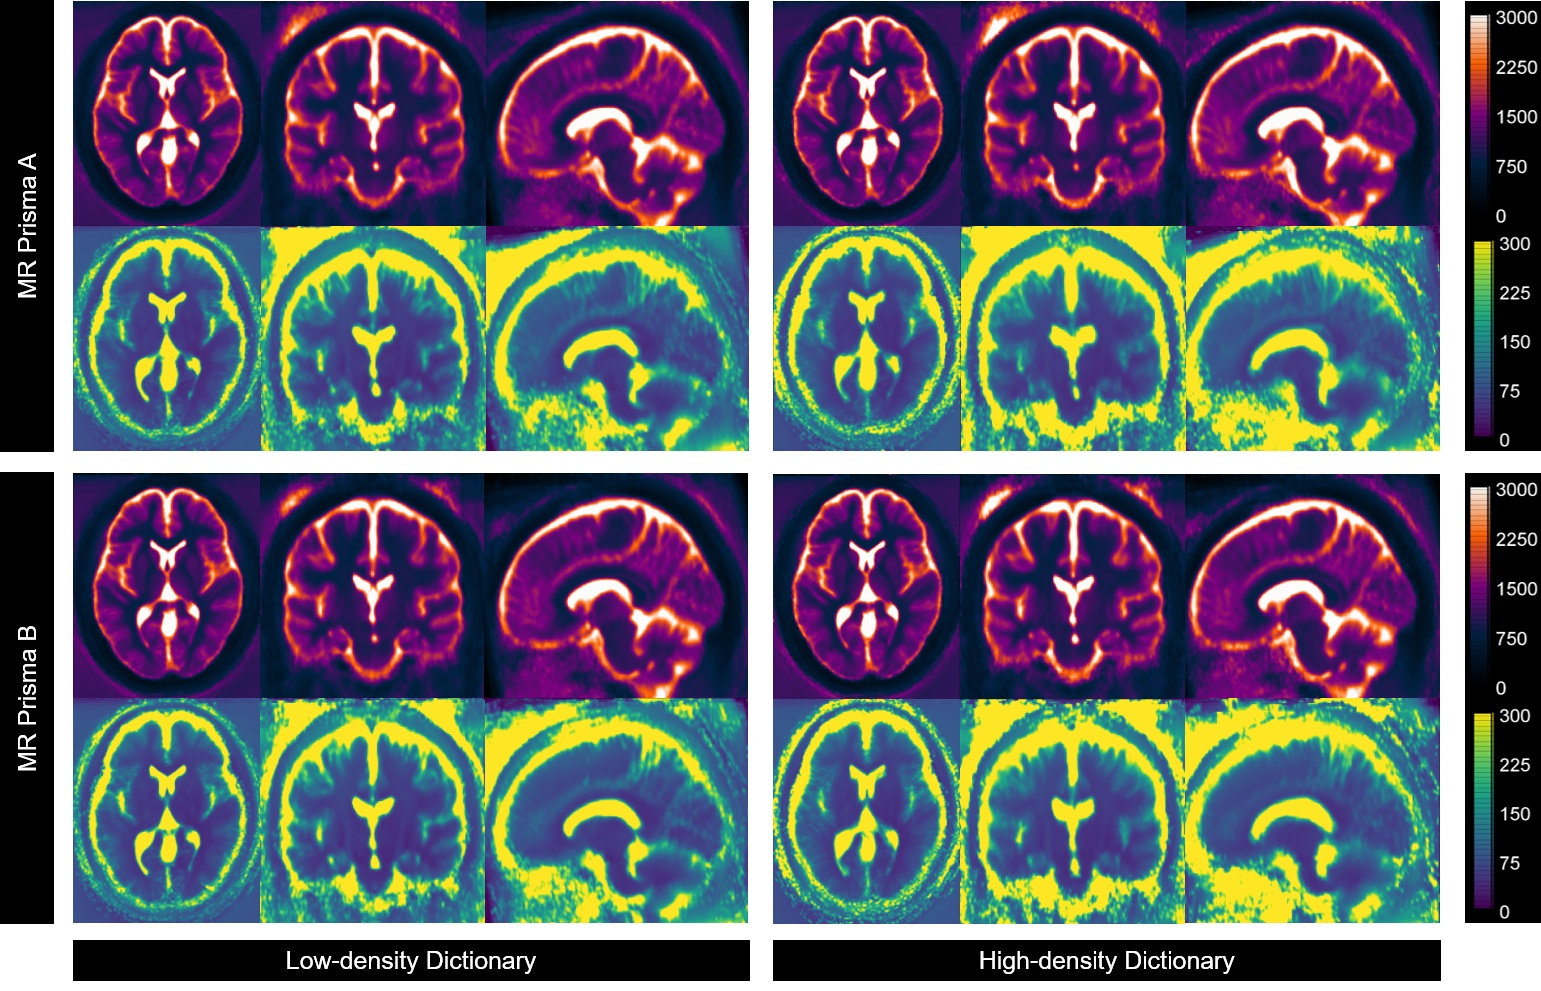
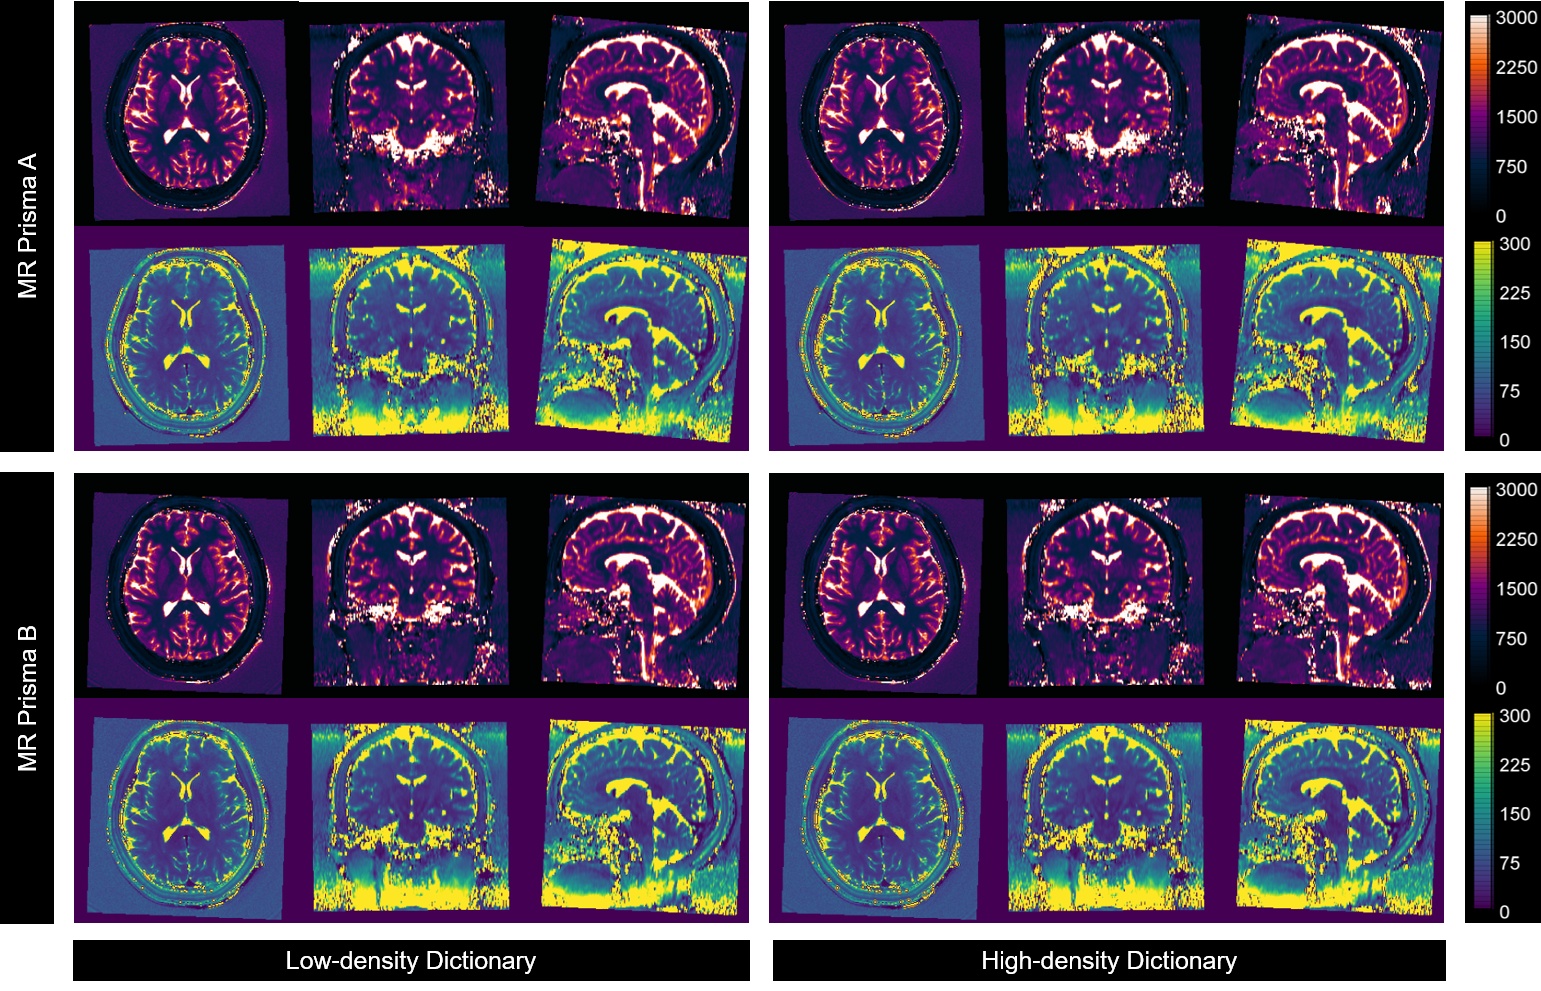
All 39 volunteers (20 women, mean age 26.2 ± 4.1 years) were included in the final analysis. Average normalized T1 and T2 maps reconstructed using both dictionaries from two scanners (Fig. 2) demonstrated consistencies in most brain parenchyma. Figure 3 provides greater details of the original resolution T1 and T2 maps from one representative subject. Inter-scanner reproducibility of 3D MRF measurements from both dictionaries, particularly in the brain parenchyma, was comparable (Fig. 4). In the BA analysis, the mean T1 biases were 15.51 ms (95%CI -131.67 to 162.59 ms) and 16.03 ms (95%CI -141.94 to 173.99 ms), while mean T2 biases were -0.87 ms (95%CI -22.67 to 20.94 ms) and -1.12 ms (95%CI -21.72 to 19.48 ms), for LDD and HDD, respectively.However, higher variabilities were observed in CSF measurements, particularly by using HDD (Fig. 4). HDD T1 mean bias was 82.07 ms with a standard deviation (SD) of 360.06 ms (LDD: mean bias 64.63 ms, SD 189.61 ms), and HDD T2 mean bias was -5.62 ms with 294.17 ms SD (LDD: mean bias 19.89 ms, SD 203.27 ms). Such findings were also evident in the ICC analysis. The ICC of solid compartment measurements were 0.946 and 0.939 (T1); 0.900 and 0.910 (T2), respectively, for LDD and HDD. In the same order, CSF measurements’ ICC were 0.588 and 0.511 (T1); 0.756 and 0.525 (T2).
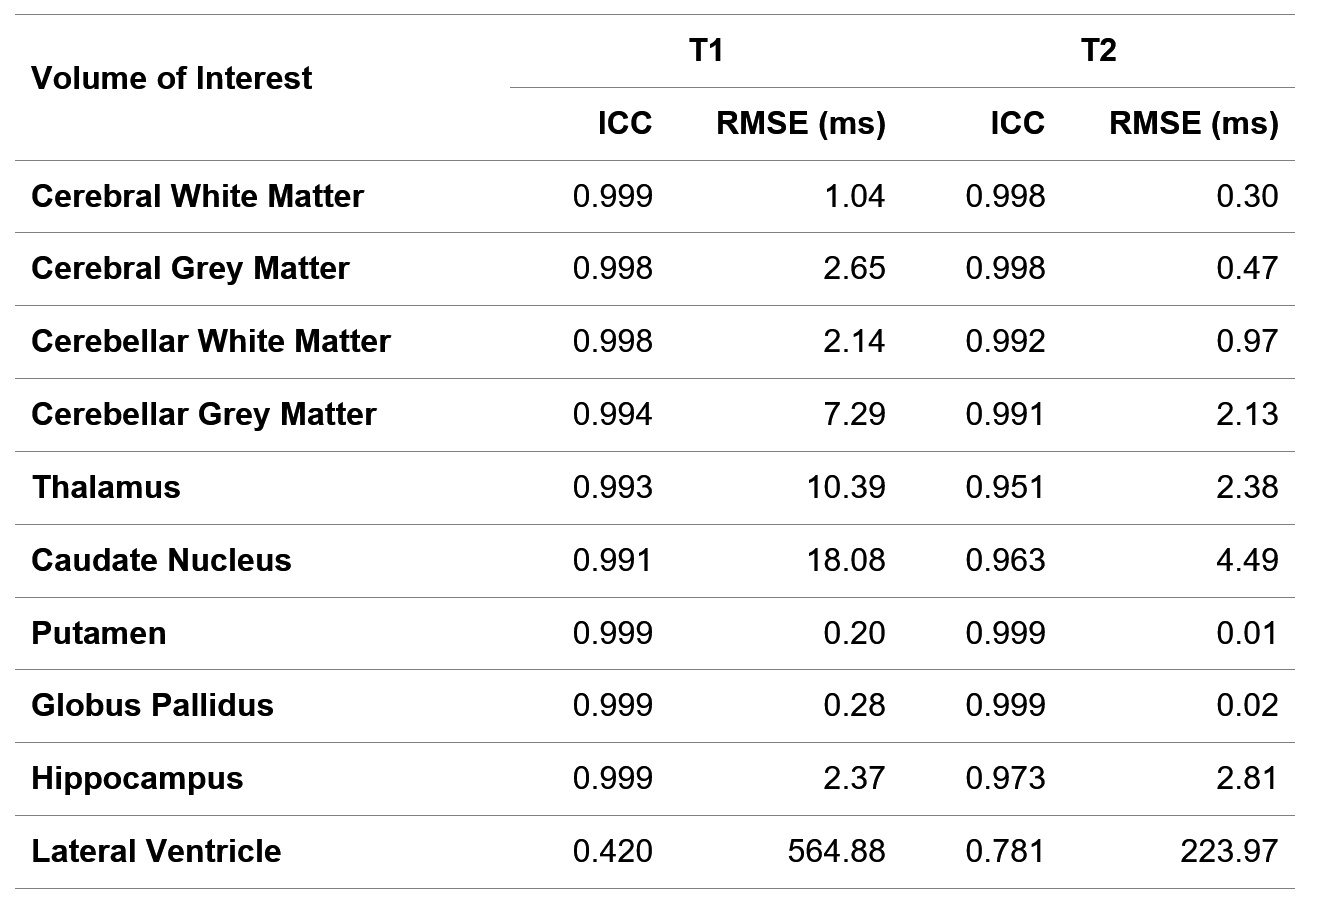
Concordantly, the inter-dictionary agreement was higher in the brain parenchyma than in the CSF compartment. The average ICC among solid compartment VOIs were 0.997 (T1) and 0.985 (T2), with an average RMSE of 4.94 ms (T1) and 1.48 ms (T2). The highest agreement was observed in the putamen and globus pallidus. Meanwhile, the CSF compartment’s ICC was 0.420 and 0.781, with a far higher RMSE of 564.88 ms and 223.97 ms, respectively, for T1 and T2 values (Table 1).
Discussion
The in-vivo reproducibility of 3D MRF reconstructed from two dictionaries with the different resolution was compared. Interscanner reproducibility was equal in most brain parenchyma despite the significant difference in the number of dictionary entries. It was affirmative to Ma et al.’s work in the phantom experiment1, stating that T1 and T2 estimation accuracy were not affected by the different dictionary resolution. However, we captured higher variability in very high T1 and T2 value measurements, as represented by CSF measurement, which was more evident using the higher resolution dictionary. Some possible explanations were thought, including the CSF flow effect9 and CSF physiological inhomogeneity10 that values beyond the lower resolution dictionary range.Conclusion
3D MRF reconstructed using two different dictionary resolutions demonstrated comparable reproducibility in most brain parenchyma. However, lower reproducibility was evident in CSF measurement, more obviously in a higher resolution dictionary, warranting further investigation and particular attention in its clinical implementation.Acknowledgements
No acknowledgement found.References
1. Ma D, Gulani V, Seiberlich N, et al. Magnetic resonance fingerprinting. Nature. 2013;495(7440):187–192.
2. Liao C, Wang K, Cao X, et al. Detection of Lesions in Mesial Temporal Lobe Epilepsy by Using MR Fingerprinting. Radiology. 2018;288(3):804–812.
3. Keil VC, Bakoeva SP, Jurcoane A, et al. A pilot study of magnetic resonance fingerprinting in Parkinson’s disease. NMR Biomed. 2020;33(11):e4389.
4. Keil VC, Bakoeva SP, Jurcoane A, et al. MR fingerprinting as a diagnostic tool in patients with frontotemporal lobe degeneration: A pilot study. NMR Biomed. 2019;32(11):e4157.
5. de Blank P, Badve C, Gold DR, et al. Magnetic Resonance Fingerprinting to Characterize Childhood and Young Adult Brain Tumors. Pediatr. Neurosurg. 2019;54(5):310–318.
6. Su P, Mao D, Liu P, et al. Multiparametric estimation of brain hemodynamics with MR fingerprinting ASL. Magn. Reson. Med. 2017;78(5):1812–1823.
7. Liao C, Bilgic B, Manhard MK, et al. 3D MR fingerprinting with accelerated stack-of-spirals and hybrid sliding-window and GRAPPA reconstruction. Neuroimage. 2017;162:13–22.
8. Cao X, Liao C, Wang Z, et al. Robust sliding-window reconstruction for Accelerating the acquisition of MR fingerprinting. Magn. Reson. Med. 2017;78(4):1579–1588.
9. Körzdörfer G, Kirsch R, Liu K, et al. Reproducibility and Repeatability of MR Fingerprinting Relaxometry in the Human Brain. Radiology. 2019;292(2):429–437.
10. Spijkerman JM, Petersen ET, Hendrikse J, et al. T 2 mapping of cerebrospinal fluid: 3 T versus 7 T. MAGMA. 2018;31(3):415–424.
Figures