1540
In vivo repeatability of Tailored MR Fingerprinting1Columbia Magnetic Resonance Research Center, Columbia University, New York, NY, United States, 2Dayananda Sagar College of Engineering, Bangalore, India
Synopsis
MR fingerprinting(MRF) has an advantage over quantitative MRI as it allows simultaneous acquisition of multi-parametric maps but does not generate multi-contrast images required for routine clinical studies. Tailored MRF(TMRF) allows simultaneous acquisition of two quantitative maps and six qualitative contrasts. A TMRF repeatability study was conducted for four days on one in vivo healthy human brain. Signal-to-noise ratio (SNR) and mean intensity values for grey matter(GM) and white matter(WM) were computed. Standard deviation of SNR for WM and GM were in the range of 0.1 to 0.75 and 0.2 to 1.1 respectively. This narrow range shows the repeatability of TMRF
INTRODUCTION
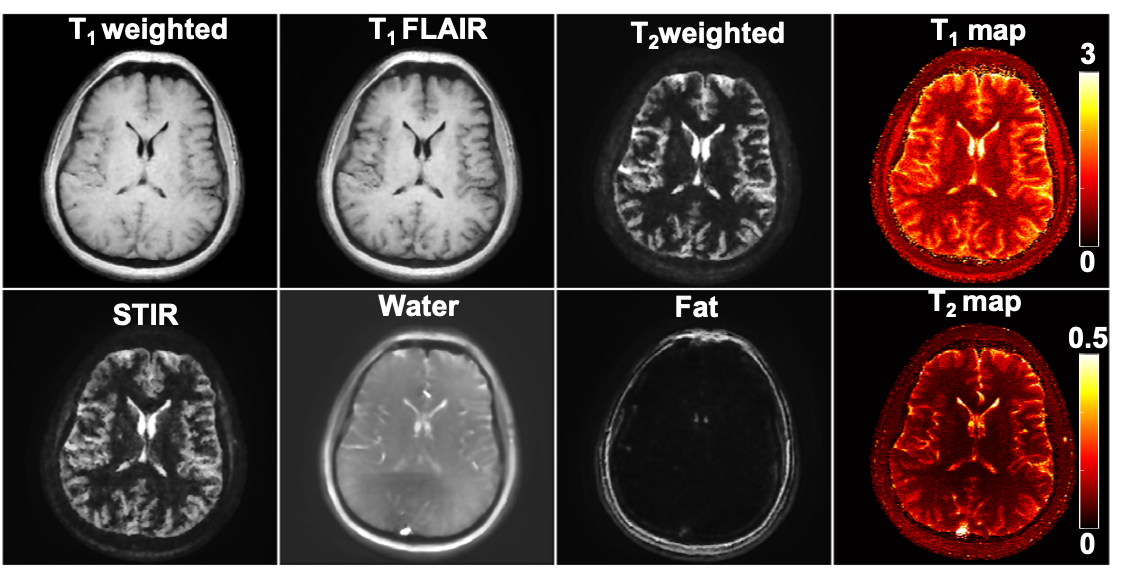
Magnetic resonance fingerprinting (MRF) reduces the long acquisition time of quantitative MRI by simultaneously acquiring multiple parametric maps such as T1, T2, etc. However, MRF does not provide multi-contrast images which are routinely utilized as a part of clinical studies. Though MRF reconstructed parametric maps can provide synthetic contrasts, it is challenging to estimate the phase terms from diffusion, flow, susceptibility, off-resonance, etc. Recently, a deep learning (DL) based MRF reconstruction approach directly reconstructing contrast images from MRF data has been reported1. For brain study, more than one contrast is required to make accurate decisions which leads to longer scan time. Some studies address these issues by acquiring multiple contrasts simultaneously such as EPIMix2 and penta contrast3, etc. Tailored MRF (TMRF) allows simultaneous acquisition of both multi-parametric quantitative (two maps) and qualitative (six contrasts) data4. The six contrasts are T1 weighted, T1 fluid-attenuated inversion recovery (FLAIR), T2 weighted, short tau inversion recovery (STIR), water, and fat images. The quantitative imaging includes T1 and T2 maps. Previously, we demonstrated TMRF on in vivo healthy human brain. In this work, we focus on the repeatability of TMRF which was demonstrated on one in vivo healthy human brain over a period of four days on a 3T GE 750w scanner. The repeatability study was validated by comparing the signal-to-noise ratio (SNR) and grey matter (GM) and white matter (WM) mean intensity values over four days.METHODS
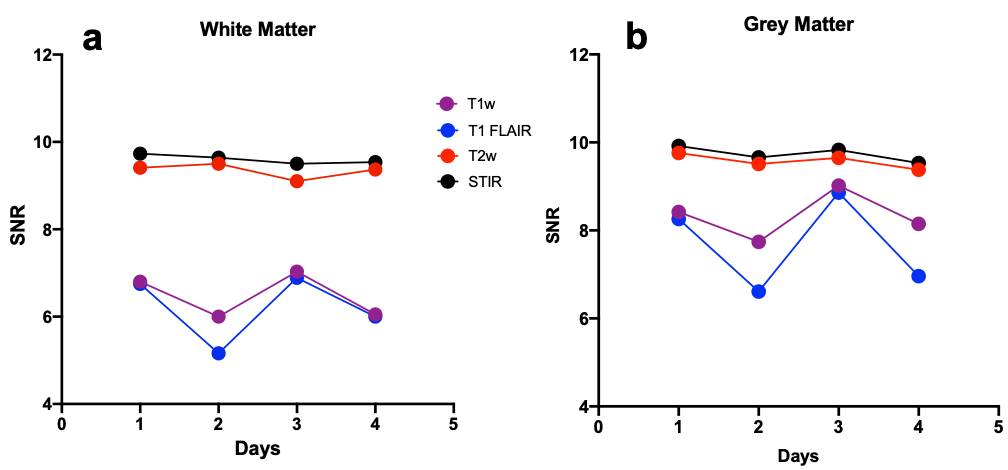
The repeatability study protocol included a gold standard (GS) T1 fast spin-echo sequence and TMRF. The acquisition parameters for the GS sequence were: field of view (FOV) - 22.4x22.4 cm2, matrix size - 224x224, TR - 929 ms, TE - 7.6 ms, and flip angle - 1110. The acquisition parameters for TMRF were: FOV - 22.5x22.5 cm2, matrix size - 225x225, TRmin - 14.7 ms, and TE0 - 1.9 ms (TE1 - 2.3 ms and TE2 - 3.4 ms for Dixon imaging). The number of slices and slice thickness for GS and TMRF were 20 and 5 mm respectively. To calculate the SNR, TMRF was acquired twice with identical conditions on all four days. The acquisition time for TMRF was ~4 minutes and reconstruction time was ~3 minutes for all the six contrasts. The reconstructed images show low SNR due to undersampled k-space data and incoherent noise. This was removed by using a deep learning denoising model by learning the noise pattern from the same images. For quantitative maps, a modified version of the Deep RecOnstruction NEtwork (DRONE)5 method was used to reconstruct T1 and T2 maps. WM and GM of all the contrasts and maps for all the four datasets (scanned for four days) were semi-automatically segmented using the threshold method with the help of 3D slicer software7. The threshold values were the same for all the datasets. The SNR was calculated for all the contrast images with the help of a 3D slicer which uses the “difference image method”. The measured SNR and mean intensity values of GM and WM for all the qualitative data and only mean intensity values of GM and WM for quantitative data were plotted.RESULTS AND DISCUSSION
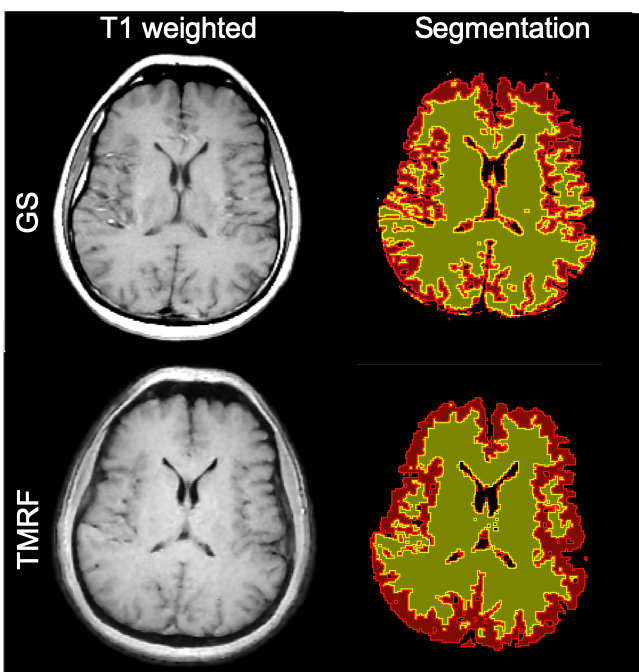
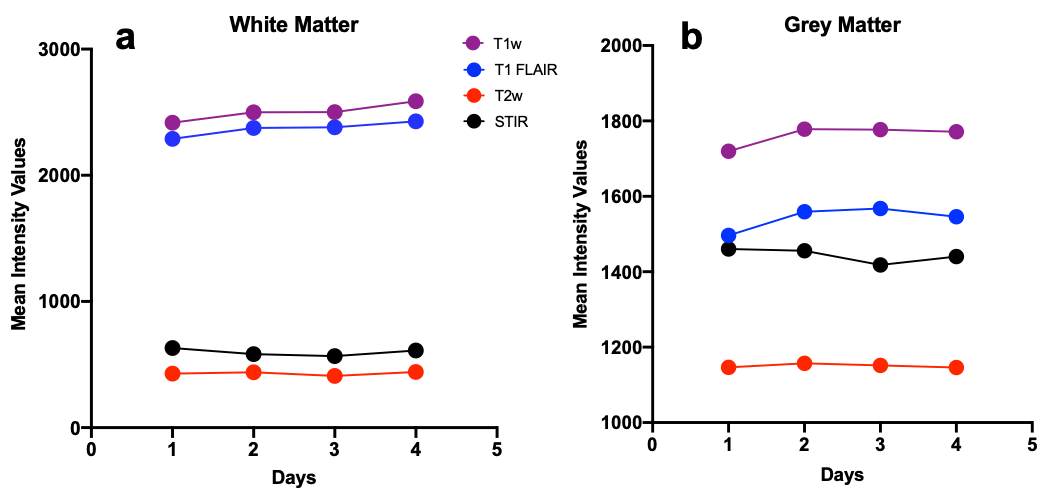
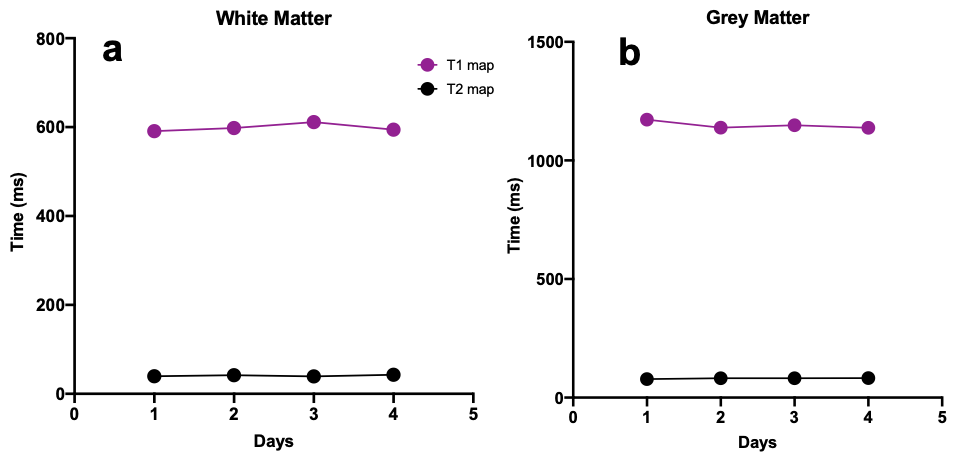
Figure 1 shows the six contrasts along with quantitative data (T1 and T2 maps) which were obtained simultaneously from TMRF. Figure 2 shows the representative gold standard (GS) T1 weighted and TMRF T1 weighted data (first column) and their corresponding segmented masks for one slice are shown in the second column. From figure 2, it can be observed that the TMRF T1 weighted contrast is comparable to GS data. This is representative data and is true for all other contrasts. The plot of SNR of WM and GM for all the four days shown in 3(a) and 3(b) respectively was computed using slicer 3D for four contrasts (T1 weighted, T1 FLAIR, T2 weighted, and STIR). From figure 3, it can be seen that the SNR range for white matter for T1 weighted is between 6 and 7, for T1 FLAIR - 5 and 7, T2 weighted - 9 to 9.5, and for STIR - 9.5 to 9.7. For GM, T1 weighted is between 7.7 and 9, for T1 FLAIR - 6.6 and 8.8, T2 weighted - 9.5 to 9.9, and for STIR - 9.5 to 10. Figure 4 shows the mean intensity values for WM and GM for four TMRF qualitative data (each color indicates one contrast) over four days. The range of mean intensity range for WM for T1w and T1 FLAIR is between 2300 and 2600 and for T2w and STIR, the range is between 400 and 650. The range of mean intensity range for WM for T1w and T1 FLAIR is between 2300 and 2600 and for T2w and STIR, the range is between 400 and 650. Figure 5 shows the WM and GM mean intensity values for TMRF quantitative data (T1 and T2 map). From figures 4 and 5, it can be observed that the mean intensity values for GM and WM of qualitative and quantitative data are for all four days.CONCLUSION
TMRF not only provides six contrasts and two maps simultaneously within 4 minutes but these outputs are also repeatable. Future work is to perform the repeatability study on multi-site MR scanners.Acknowledgements
This work was supported, in part, by GE-Columbia research partnership grant and also performed at Zuckerman Mind Brain Behavior Institute MRI Platform, a shared resource, and Columbia MR Research Center siteReferences
1. Virtue P, Tamir JI, Doneva M, Yu SX, Lustig M. Learning Contrast Synthesis from MR Fingerprinting.
2. Stefan Skare, et.al., 1-Minute Full Brain MR Exam Using a Multicontrast EPI Sequence, MRM 2017
3. Jinhee Jeong, et. al., Penta-contrast imaging: a Novel Pulse Sequence for Simultaneous Acquisition of Proton Density, T1, T2, T2* and FLAIR images, ISMRM 2017
4. Pavan Poojar et. al., Natural, multi-contrast and quantitative imaging of the brain using tailored MR fingerprinting , ISMRM 2020.
5. Cohen, O., Zhu, B., & Rosen, M. S. (2018). MR fingerprinting Deep RecOnstruction NEtwork (DRONE). Magnetic Resonance in Medicine.
Figures