1539
Validity and repeatability of MRF in glioma and normal appearing contralateral brain tissue at 3T1Department of Surgery and Cancer, Imperial College London, London, United Kingdom, 2Department of Radiotherapy and Imaging, Institute of Cancer Research, London, United Kingdom, 3Department of Imaging, Imperial College Healthcare NHS Trust, London, United Kingdom, 4Department of Bioengineering, Imperial College London, London, United Kingdom, 5Medical Research Council, London Institute of Medical Sciences, Imperial College London, London, United Kingdom, 6Computational Oncology group, Institute for Global Health Innovation, Imperial College London, London, United Kingdom, 7John Fulcher Neuro-oncology Laboratory, Department of Brain Sciences, Imperial College London, London, United Kingdom, 8Radiotherapy Department, Charing Cross Hospital, London, United Kingdom, 9Department of Radiology, Royal Marsden Hospital, London, United Kingdom
Synopsis
MR Fingerprinting (MRF) was found to give highly repeatable T1 and T2 measurements in glioma and normal appearing contralateral brain tissue. Validity was investigated via comparison to standard mapping techniques: variable flip angle for T1 and multi-echo spin echo for T2. Biases were found between MRF and standard relaxometry methods, as in previous healthy volunteer studies. Statistically significant strong and moderate correlations were found between the MRF and standard mapping methods for T1 and T2 respectively, indicating MRF is comparably sensitive to changes in T1 and T2 as established mapping techniques in both cancerous and normal appearing contralateral brain tissue.
Introduction
In conventional T1 and T2 weighted MR images, the absolute signal intensity depends on multiple relaxation mechanisms and cannot be used quantitatively for diagnosis. Quantitative relaxometry could improve tissue classification and clinical assessment of brain tumours. However, long acquisition times mean quantitative relaxometry is currently clinically infeasible[1]. Magnetic Resonance Fingerprinting (MRF) is a rapid quantitative imaging framework, and has been shown to give reliable and reproducible quantities in phantom[2] and healthy volunteer[3] studies. In this study, we assess the validity and repeatability of relaxation maps from an MRF prototype sequence in tumour regions and normal appearing contralateral (NAC) grey matter (GM) and white matter (WM).Methods
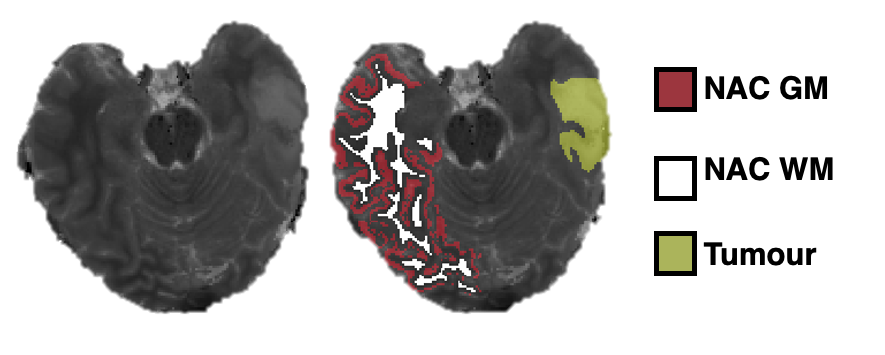
11 patients (6 female, 5 male, 28-75 years, mean 57 years) with a radiological primary brain tumour diagnosis (6 low grade glioma, 5 high grade glioma) were recruited to this study following ethical approval and informed consent. MRI scans were performed pre-treatment on a 3T MAGNETOM Prisma (Siemens Healthcare, Germany). The protocol included: 3D MPRAGE (1x1x1mm3), 2D multi-echo spin echo (MESE: TR 3520ms, TE: 24, 48, 72, 96, 120, 144 and 168ms, 1x1x5mm3 voxels), 3D VIBE with variable flip angles (VFA: TR 10ms, TE 1.43ms, six FA: 2°, 8°,12°,15°, 20° and 26°, 1x1x5mm3 voxels), two repeats of a 2D spiral FISP MRF prototype sequence with 1500 repetition periods and 1x1x5 mm3 voxels[4] generating T1, T2 and M0 maps. T1 and T2 maps were also produced by fitting standard equations[5,6] to VFA and MESE images respectively.Brain extraction and contralateral tissue segmentation was performed on the high resolution MRPAGE in FreeSurfer using the Desikan-Killiany brain atlas. MRF, VFA and MESE relaxometry maps were registered to the segmented MPRAGE using FSL. T1 and T2 values in 11 of the normal appearing brain regions contralateral to each tumour were extracted. Tumour regions were outlined from hyperintense FLAIR signal by a neuroradiologist. ROI pixels not surrounded by other ROI pixels in each dimension were eroded, and analysis was carried out in Python and MATLAB. An example segmentation is shown in Figure 1. MRF data per voxel were compared to the established methods and the repeatability of MRF assessed using Bland-Altman (BA) statistics.
Results
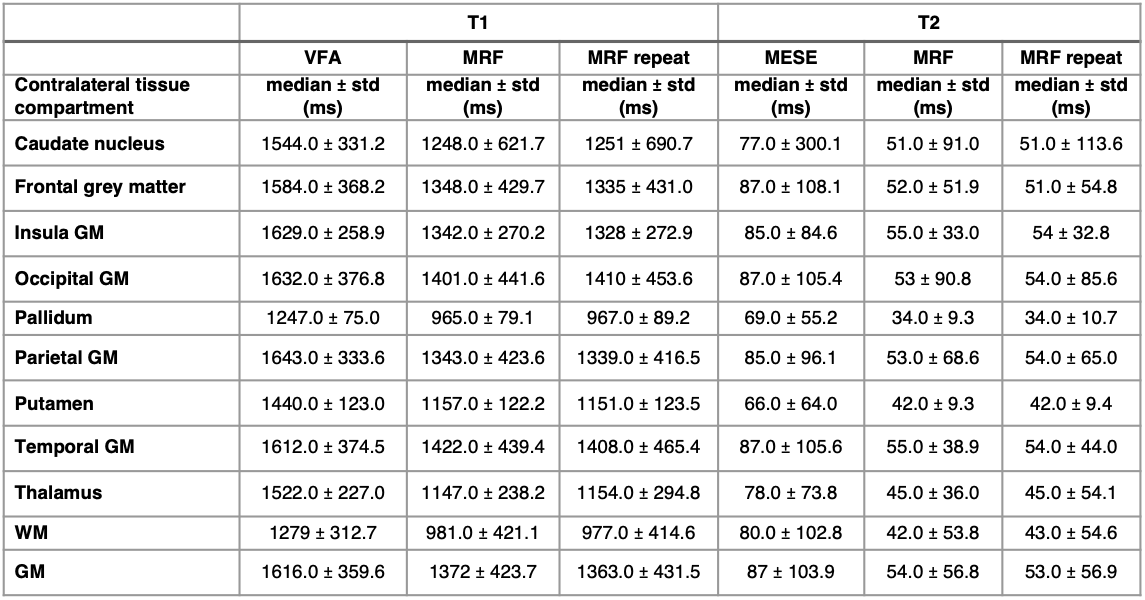
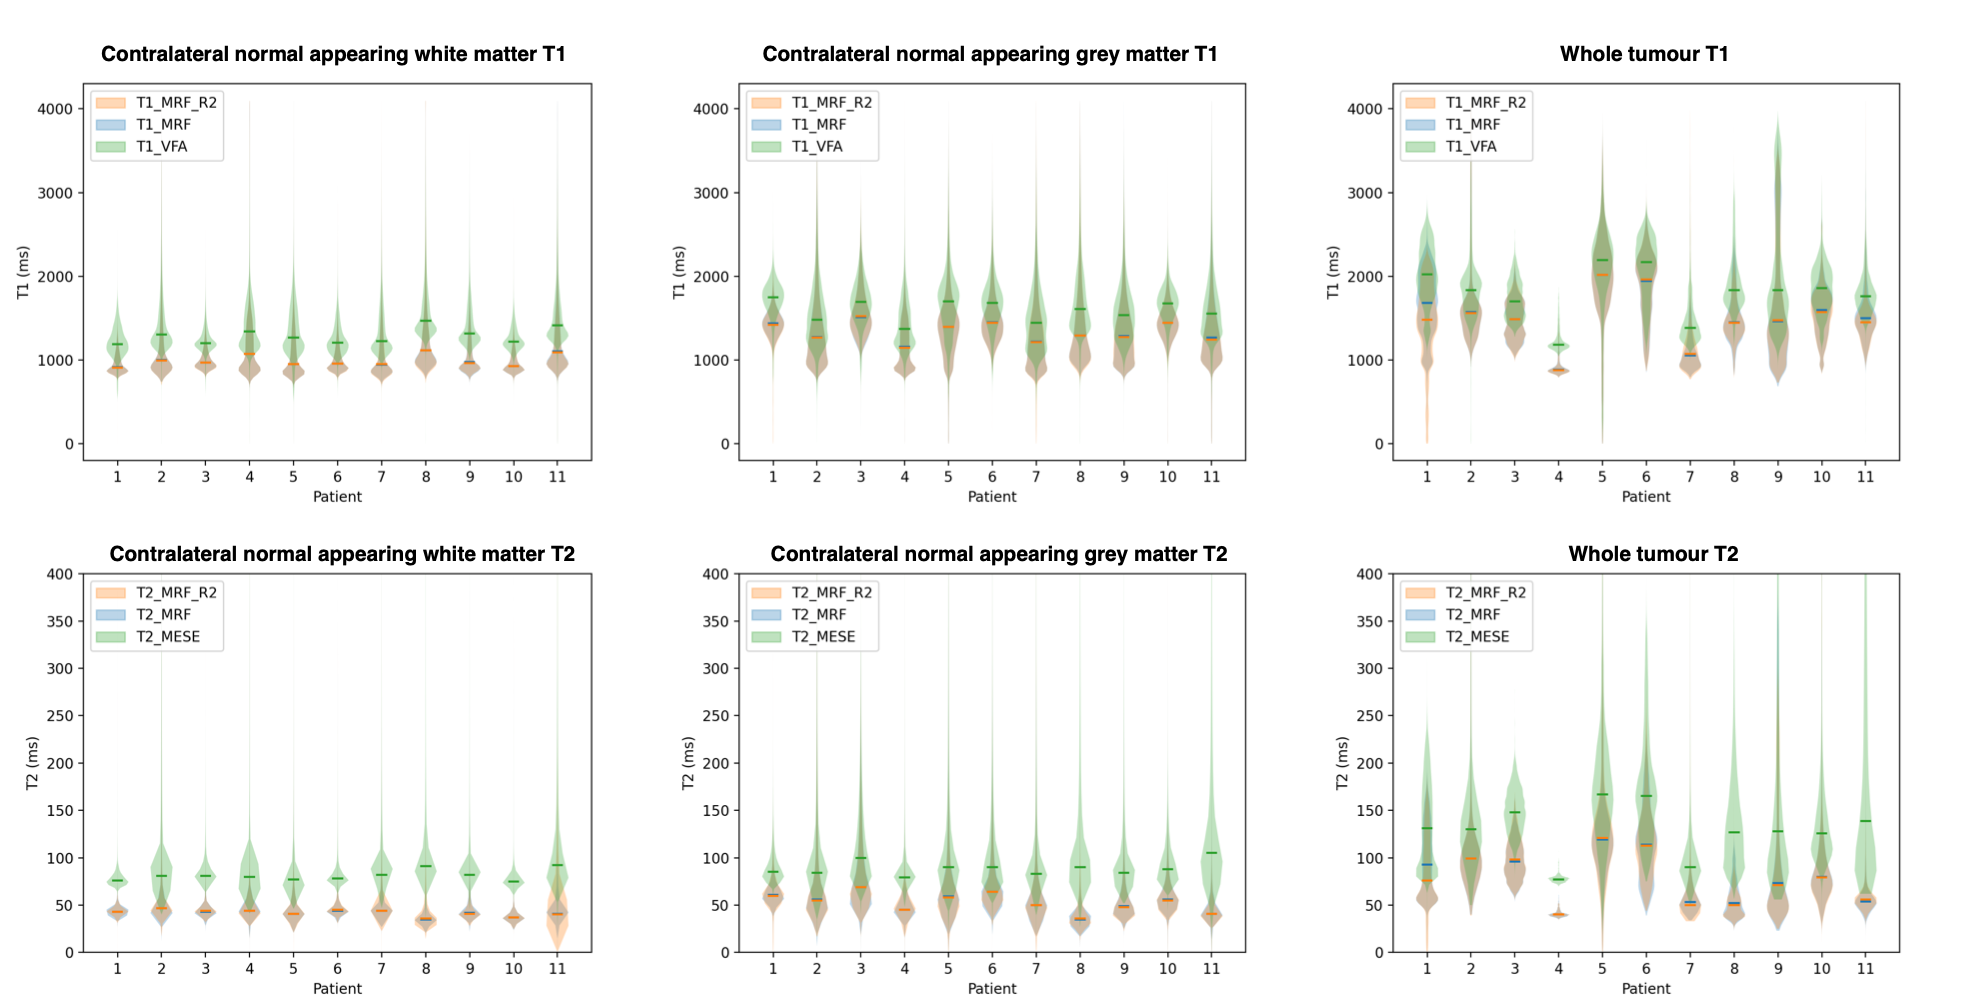
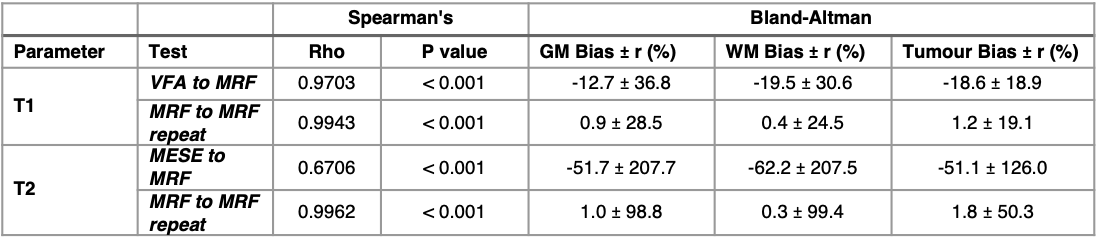
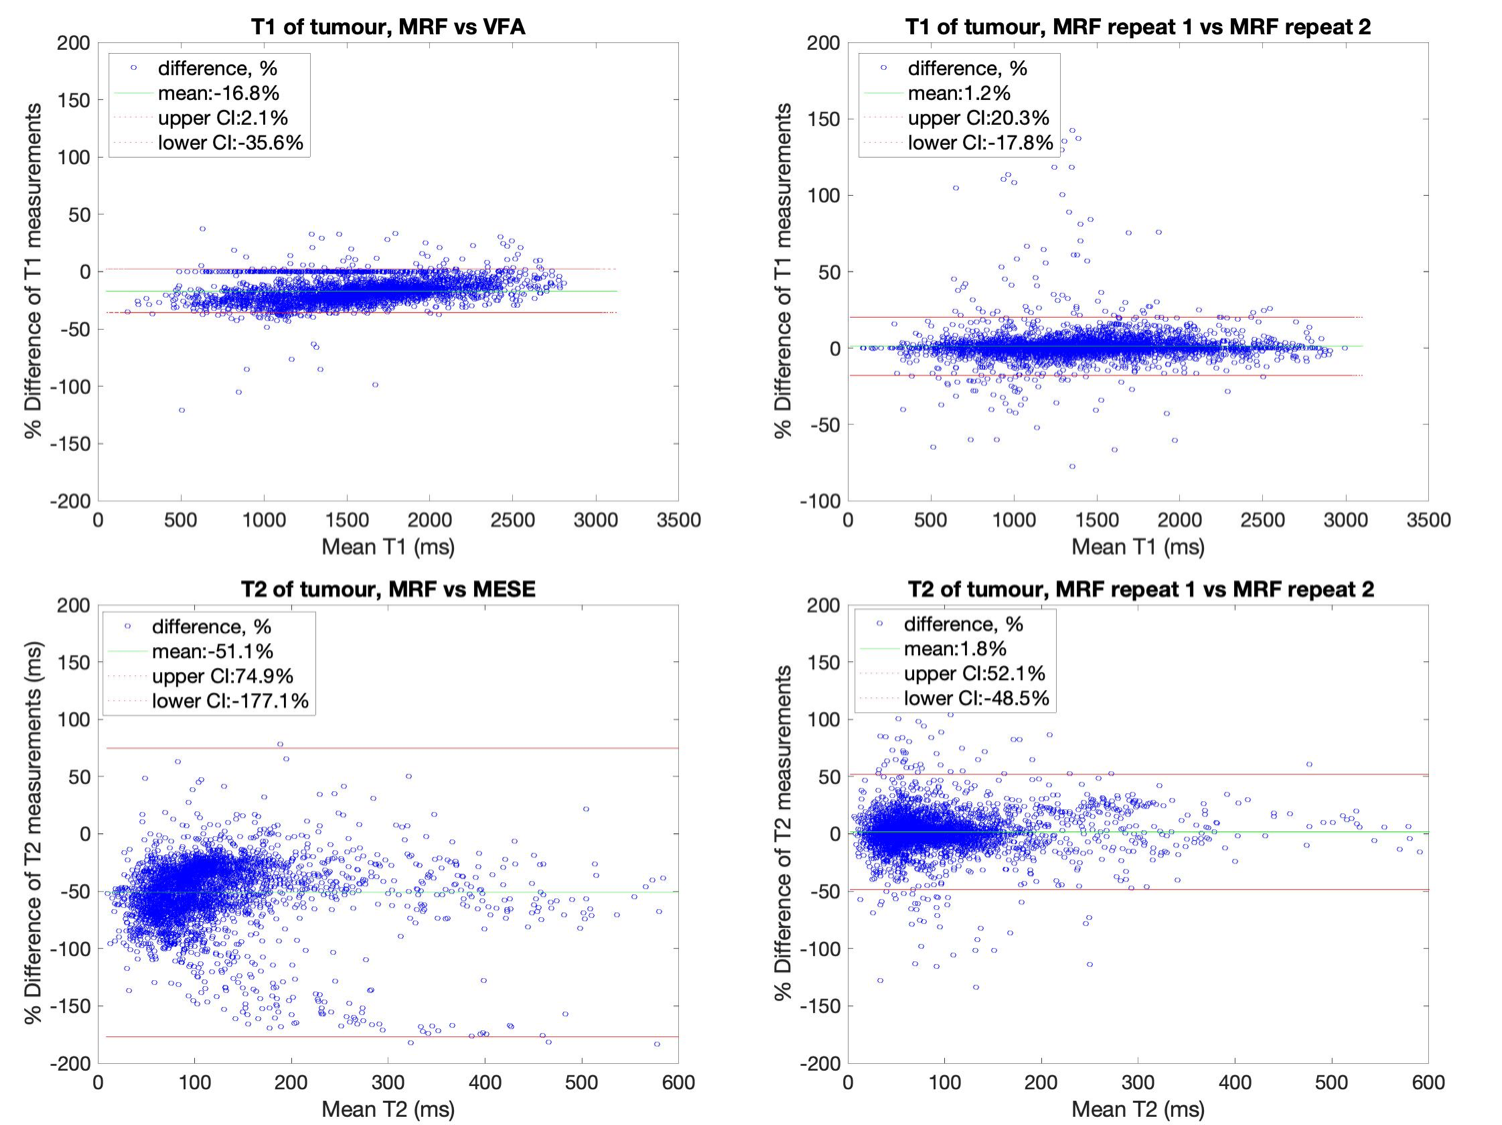
Median relaxation times in the NAC brain regions across all 11 patients are shown in Table 1. Violin plots for NAC GM and WM, as well as tumour regions are shown in Figure 2. In all ROIs, T1 and T2 values measured by MRF were lower than those obtained from established mapping techniques. Violin plots for repeat MRF measurements were mostly indistinguishable. Spearman’s Rho correlation testing of median values for each patient showed a strong and significant positive correlation between repeated MRF measurements, and a significant strong-to-moderate correlation between established mapping techniques and MRF (Table 2). Repeatability coefficients and biases were smaller for MRF repeats than MRF/VFA and MRF/MESE comparisons (Table 2). BA plots for tumour regions are shown in Figure 3.Discussion
Median MRF T1 and T2 values in NAC tissue were in agreement with those measured for healthy volunteers[3]. As expected, the range of values in cancerous regions seen in Figure 2 were highly varied across patients due to intra- and inter-tumour heterogeneity. There was a high-to-moderate significant positive correlation between T1 and T2 values from standard and MRF methods (T1: ρ=0.9703, p<0.001, T2: ρ=0.6706, p<0.001), and between MRF repeats (T1: ρ=0.9943, p<0.001, T2: ρ=0.9962, p<0.001), similar to a previous healthy volunteer study[3]. The bias was <2% for repeat MRF T1 and T2 measurements (Table 2). The variability between patients in this study were greater than that of healthy volunteers[3]. This could be due to the older age of the brain tumour patient cohort compared to the healthy volunteers, or tumours affecting contralateral tissue properties.Pixelwise BA comparison between VFA and MRF T1 values in NAC GM and WM showed T1 MRF values were lower than T1 VFA values with biases of 12.7% and 19.5% respectively (Table 2). This is broadly consistent with findings from phantom[2] and healthy volunteer studies[3]. A similar bias was found in tumour regions (18.6%) indicating consistency in measurement validity in cancerous regions.
Pixelwise BA comparison between MESE and MRF T2 values in NAC GM and WM showed T2 MRF values were lower than T2 MESE values with biases of 51.7% and 52.6% respectively, broadly consistent with findings from phantom[2] and healthy volunteer[3] studies. A similar bias was found in tumour regions (51.1%) indicating consistency in measurement validity in cancerous regions.
Limitations included some T2 violins (Figure 2) truncated at a threshold, indicating mapping had failed below this value. Due to the high intra-tumour heterogeneity, tumour subregions need to be analysed separately and this will be included in future work. Analysis of normal appearing lateral tissue and peritumoural regions is also ongoing. Only one scanner was used, in future a cross-site MRF study is required to assess inter-site and inter-scanner reproducibility.
Conclusion
MRF was shown to be highly repeatable, and significantly correlated with standard quantitative mapping techniques in both overall tumour regions and NAC brain tissue regions.Acknowledgements
The authors would like to thank the volunteers who participated in the study; Funding from the Imperial CRUK Centre and the Imperial NHS Imaging Department; the Imperial NHS ImRes Group; the Imperial MRI Physics Collective; Iulius Dragonu and Mathias Nittka, Siemens Healthineers, UK and Germany.References
1. Margaret Cheng, H. L., Stikov, N., Ghugre, N. R. & Wright, G. A. Practical medical applications of quantitative MR relaxometry. J. Magn. Reson. Imaging 36, 805–824 (2012).
2. Statton, B., Finnegan, M., Quest, R. & Grech-Sollars, M. Accuracy, reproducibility and temperature variability of T1 and T2 MR Fingerprinting measurements on the ISMRM/NIST phantom. in Proceedings of the 28th Annual Meeting of the International Society of Magnetic Resonance in Medicine (2020).
3. Smith, J., Statton, B., Cardona, S., Finnegan, M., Quest, R. & Grech-Sollars, M. Validity and reproducibility of Magnetic Resonance Fingerprinting in the healthy human brain at 3T. in Proceedings of the 28th Annual Meeting of the International Society of Magnetic Resonance in Medicine (2020).
4. Jiang, Y., Ma, D., Seiberlich, N., Gulani, V. & Griswold, M. A. MR fingerprinting using fast imaging with steady state precession (FISP) with spiral readout. J. Magn. Reson. Med. 74, 1621–1631 (2015).
5. Liberman, G., Louzoun, Y. & Ben Bashat, D. T1 Mapping using variable flip angle SPGR data with flip angle correction. J. Magn. Reson. Imaging 40, 171–180 (2014).
6. Pei, M., Nguyen, T., Thimmappa N., Salustri C., Dong, F., Cooper, M., Li, J., Prince, M. & Wang Y. Algorithm for fast monoexponential fitting based on Auto-Regression on Linear Operations (ARLO) of data. J. Magn. Reson. Med. 73, 843–850 (2015).
Figures