1537
Exploring cyto-architecture of Brodmann areas with High-resolution 3D MR Fingerprinting1Epilepsy Center, Neurological Institue, Cleveland Clinic, Cleveland, OH, United States, 2Biomedical Engineering, Case Western Reserve University, Cleveland, OH, United States, 3Imaging Institute, Cleveland Clinic, Cleveland, OH, United States, 4Neuropathology, University of Erlangen, Erlangen, Germany, 5Radiology, Case Western Reserve University, Cleveland, OH, United States
Synopsis
We demonstrate in this study the sensitivity of multi-parametric magnetic resonance fingerprinting (MRF) results at 3T to differentiate cortical regions with different cyto- or myelo-architecture. The study investigated the quantitative T1 and T2 values in various Brodmann areas to verify the sensitivity of MRF in probing tissue properties of the human cortex. Additionally, the study explores the relationship between quantitative T1 and T2 values of gray and white matter in Brodmann areas.
Introduction
Recently, 3D magnetic resonance fingerprinting (MRF) has been proposed, which can generate multiple, perfectly coregistered parametric maps (e.g. quantitative T1 and T2 maps) in 10 minutes or less, making clinical use highly feasible1,2. The quantitative MRF T1 and T2 tissue property maps have shown improved sensitivity, specificity and repeatability in various in vivo clinical applications. MRF T1 and T2 maps are sensitive to age and gender differences in healthy subjects3. MRF T1 and T2 maps can differentiate brain tumor types4. However, to date, there is no study to demonstrate the sensitivity of multi-parametric MRF to differentiate cortical regions with different cyto- or myelo-architecture. In this study, we explored quantitative T1 and T2 values among Brodmann areas (BAs) to test the sensitivity of MRF to variations across human cortex.Methods
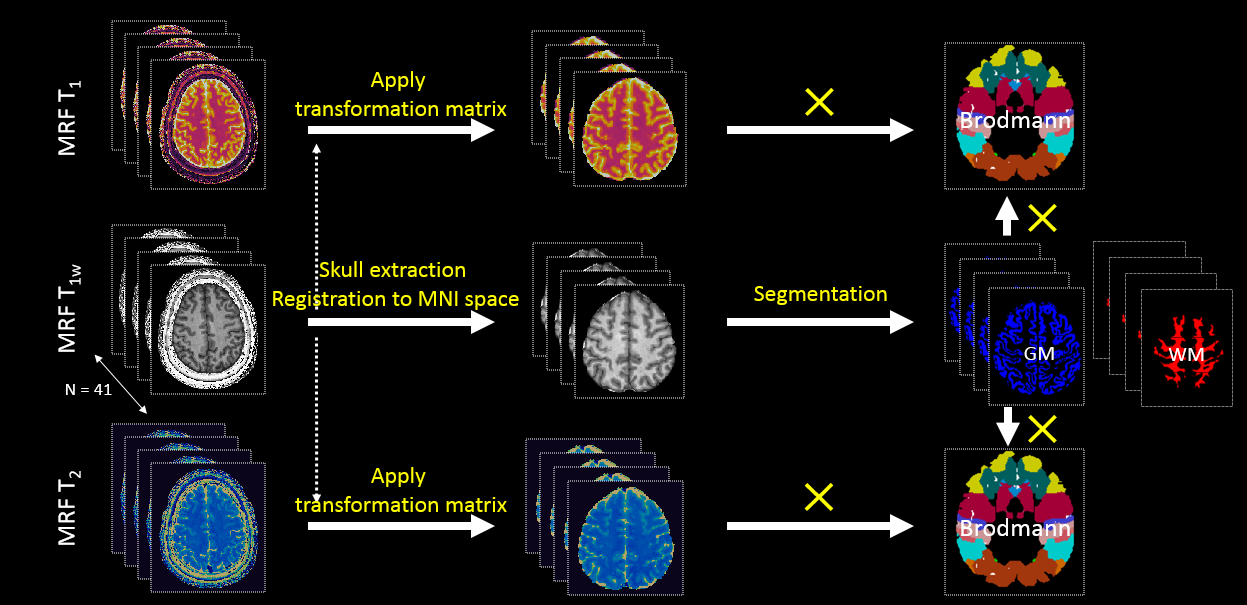
MRI acquisition: 3D whole-brain MRF scans were acquired from 41 healthy subjects on a Siemens 3T Prisma scanner (FOV = 300 x 300 x 144 mm3, 1.0 mm3 isotropic voxels, T = 10 minutes 24 seconds)1,2. In addition to the MRF sequence, a 3D B1 mapping sequence was acquired with the same FOV and resolution as the MRF to compensate for B1 inhomogeneity in MRF results (scan time = 1 minute 50 seconds)5. T1 and T2 maps were then generated based on matching of the data to a predefined dictionary2. T1-weighted (T1w) maps were synthesized from the MRF maps.MRF values in Brodmann areas: The data processing workflow of this study is shown in Figure 1. For brain extraction, we combined skull stripping6 of synthetic T1w and quantitative T1 maps to improve the accuracy of skull stripping especially in the occipital regions. After skull stripping, the T1w maps were normalized to the MNI T1w template (resolution = 1 mm3)7 using SyN in ANTS8. The warping information was directly applied to the T1 and T2 maps to normalize them to the MNI T1w template space. Gray matter (GM) and white matter (WM) masks were segmented from the normalized T1w maps using fsl9. The GM and WM masks were then applied on the Brodmann atlas (BA)10 to calculate the average T1 and T2 values for a given BA. The WM masks on the BAs only included the WM voxels that were adjacent to the cortex.
Data analysis: Paired t-test was performed to test significant differences between BAs. We selected BA 8 as a reference for the initial statistical tests. We additionally performed Spearman’s correlation analyses 1) between T1 and T2 values in GM and WM to explore the variation of T1 and T2 in BAs and 2) between MRF values of GM and those of WM in each BA to investigate the relationship of GM and its adjacent WM.
Results
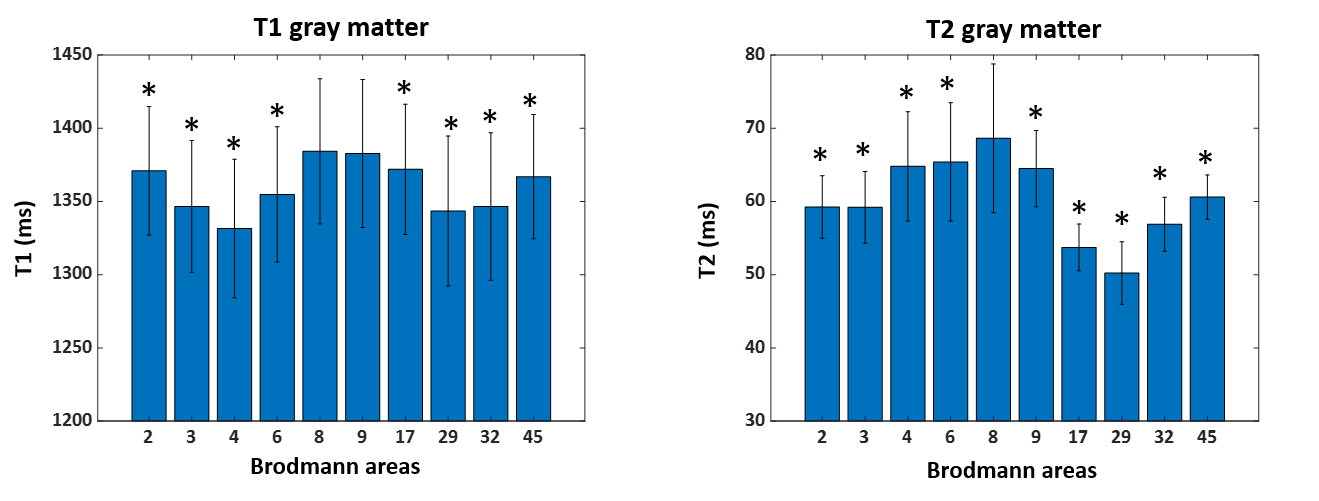
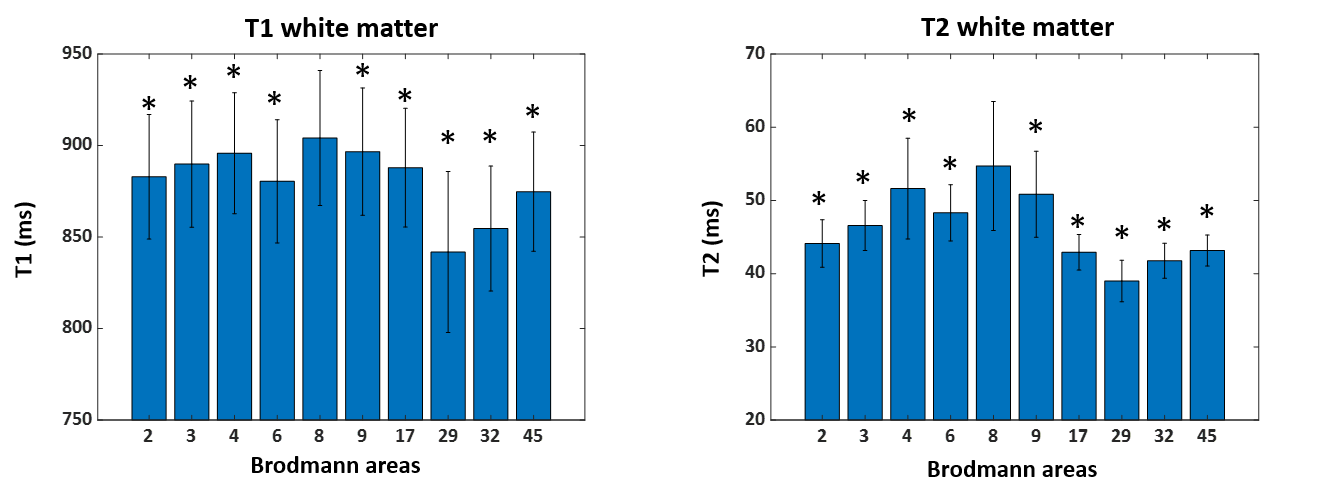
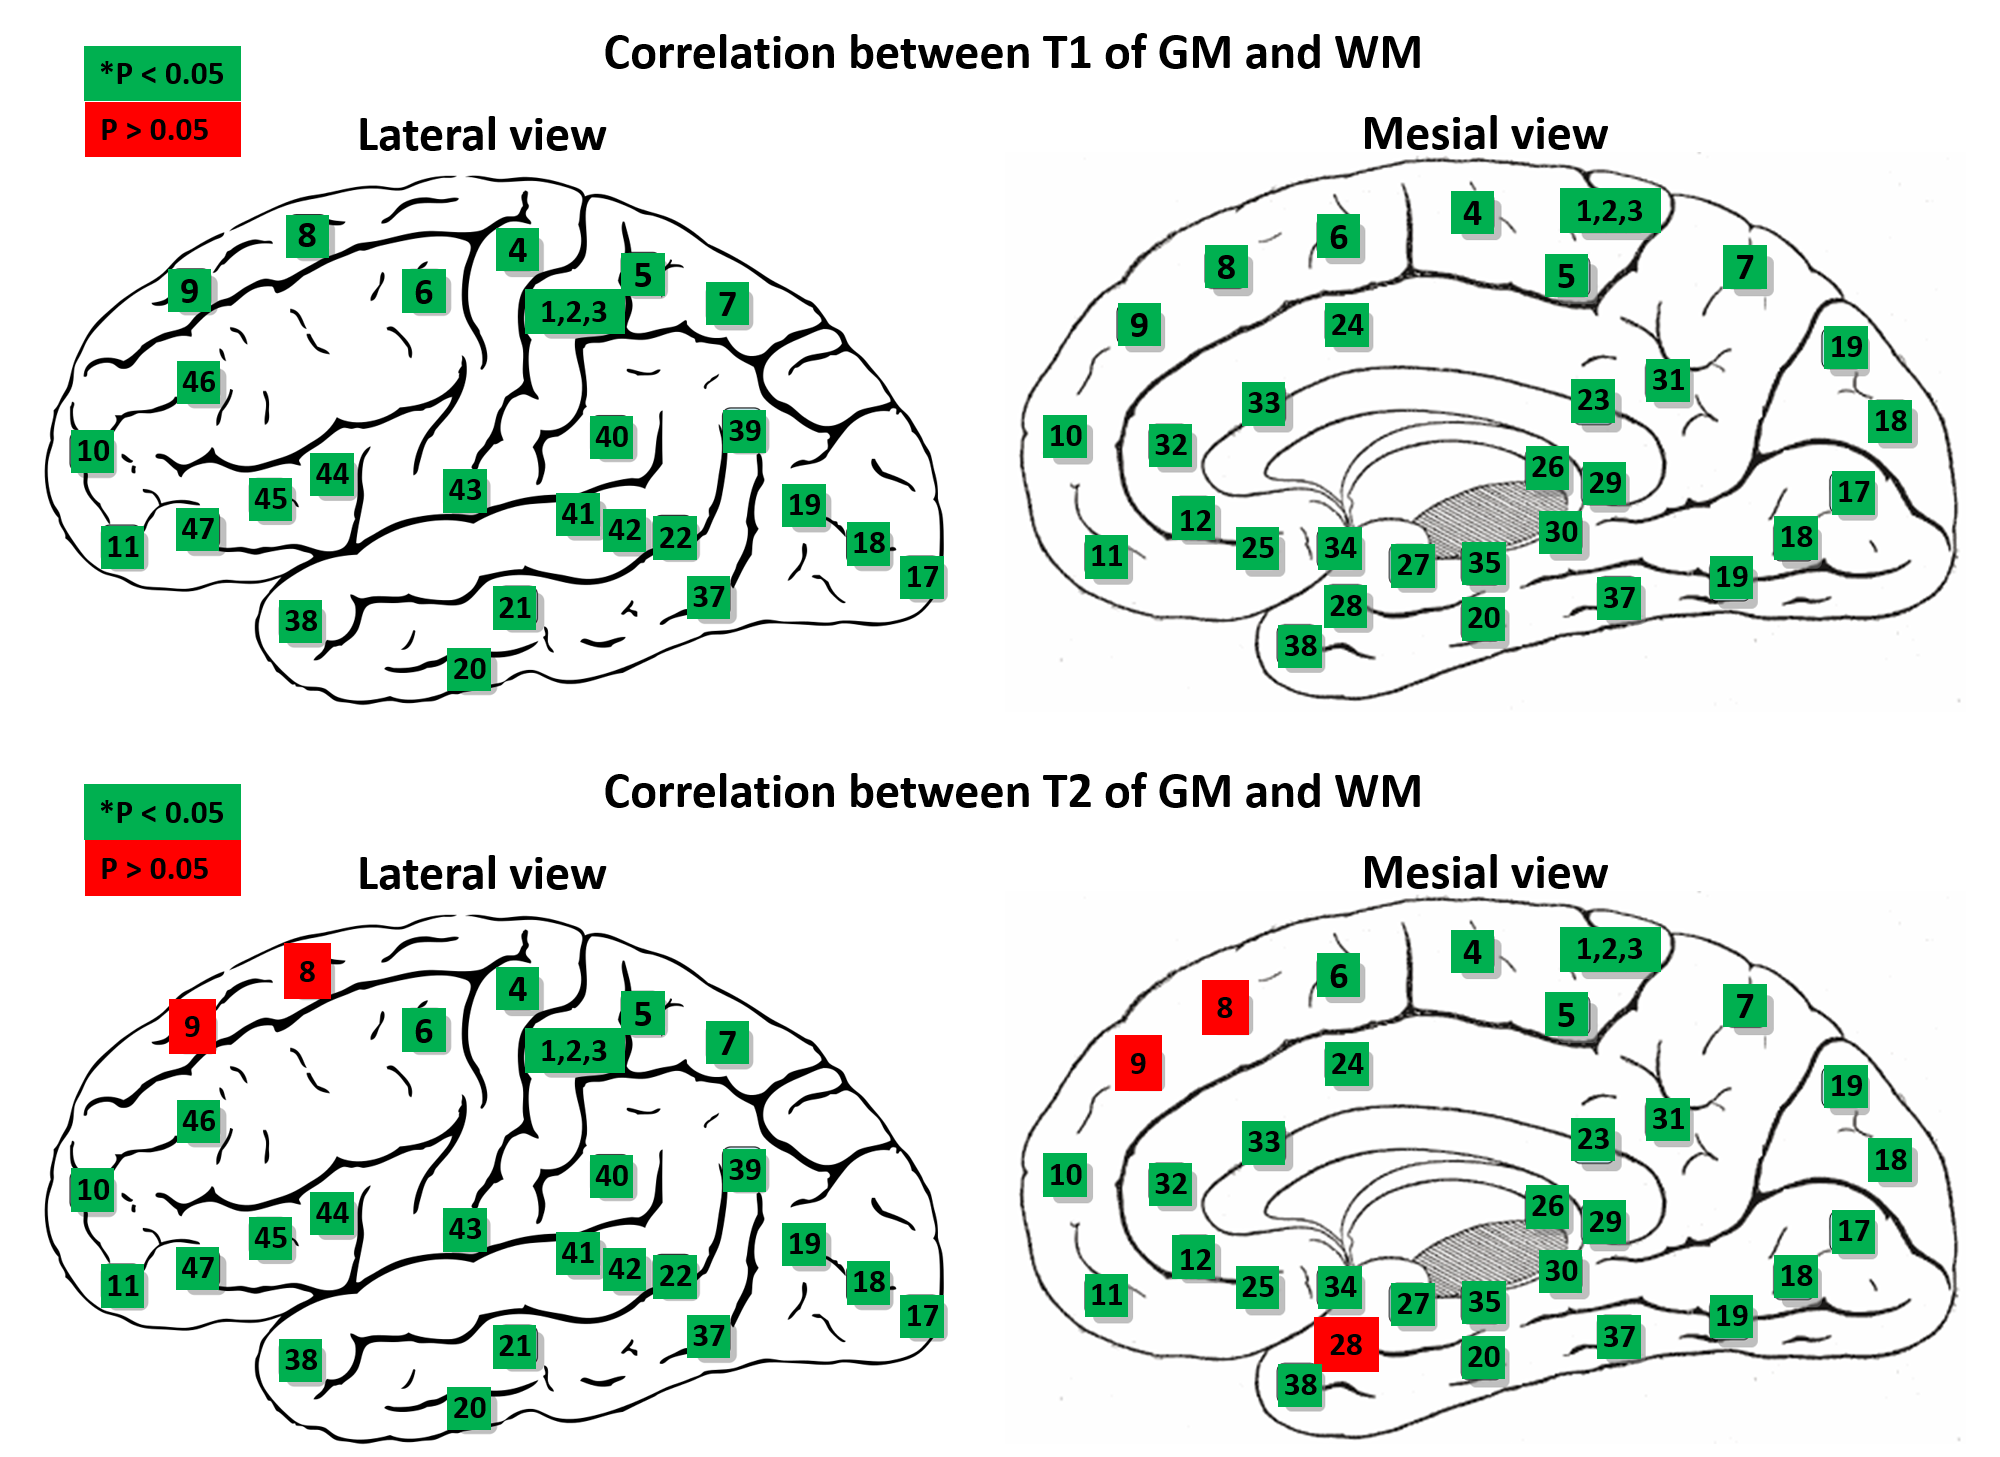
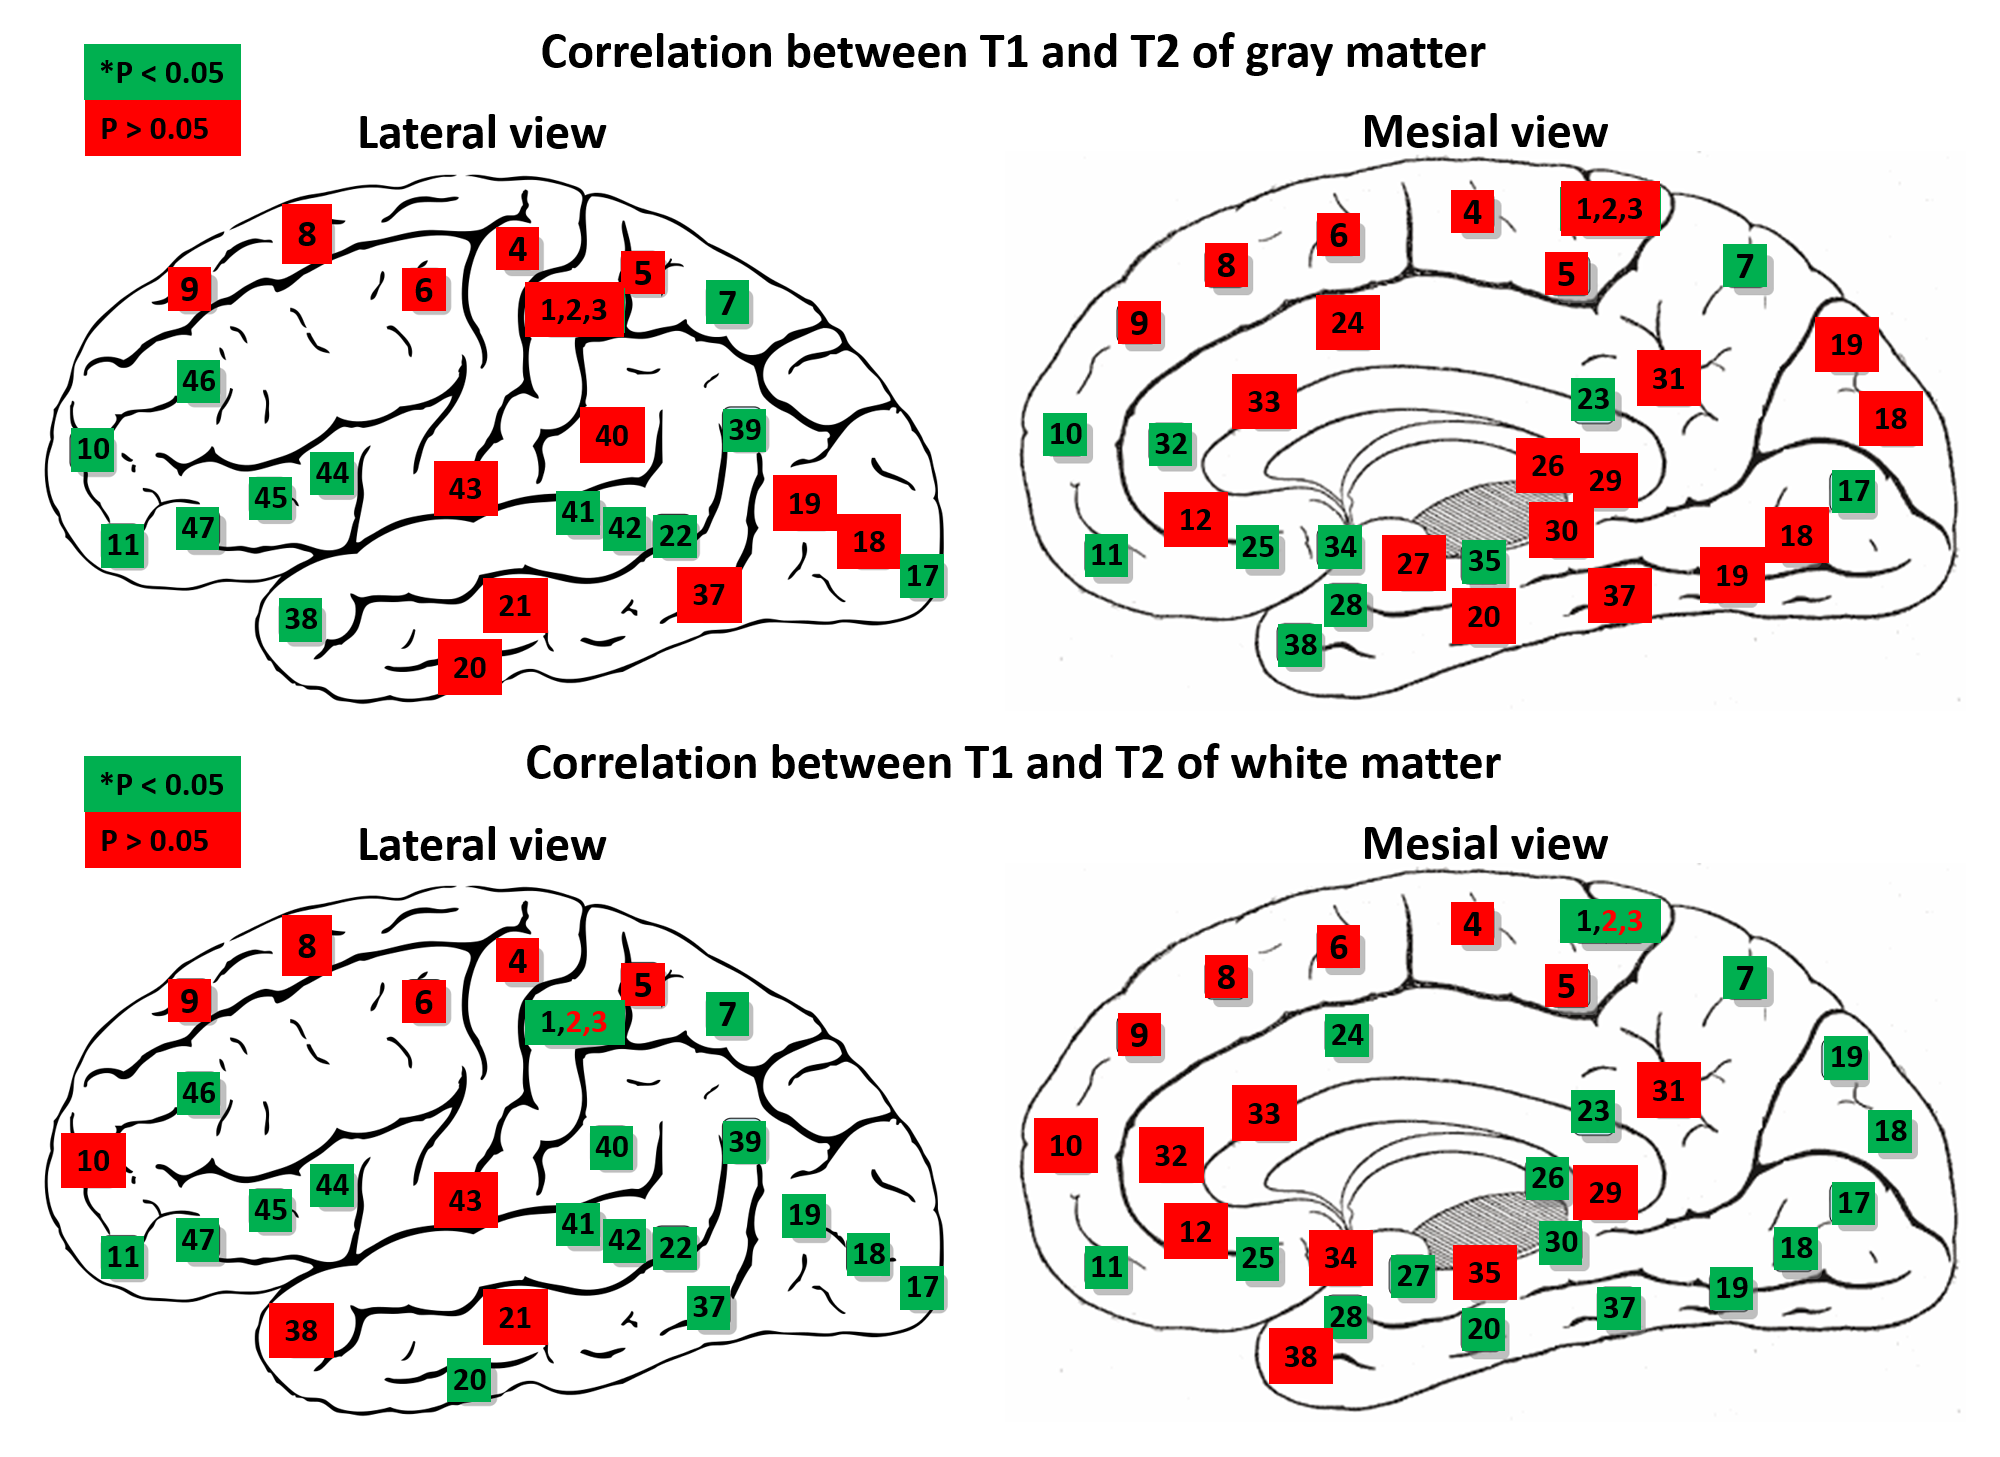
Figure 2 shows the mean and standard deviation of the T1 and T2 values of GM from selected 11 BAs. The quantitative value changes among different regions are in good agreement with previous literature10. Highlighted are the T1 and T2 values in BAs 3 (primary somatosensory cortex) and 17 (primary visual), which are both significantly lower than those in BA 8 (frontal) (p < 0.05), corresponding to the different cytoarchitecture of these cortices. BA 29 (retrosplenial) has a significantly low T2 value, due to its rich myelin content (p < 0.05). Figure 3 shows the mean and standard deviation of the T1 and T2 values of the WM adjacent to the cortex from 11 BAs. Results of WM have similar trends as GM. T1 and T2 of all BAs are significantly lower than those of BA 8 (p < 0.05). Interestingly, a significant correlation between T1 or T2 of GM and WM adjacent to the cortex was found in almost all BAs as shown in Figure 4 (p < 0.05). When compared between T1 and T2 values in each BA (Figure 5), T1 and T2 are correlated in about half of the BAs, suggesting T1 and T2 reflects different cyto- and myelo-architecture of the human cortex.Conclusion
Our results demonstrate the sensitivity of multi-parametric MRF results at 3T to differentiate cortical regions with different cyto- or myelo-architecture. The significant correlation between MRF values of GM and adjacent WM may support the notion that they reflect function-related cyto- or myelo-architectures11. Additionally, the location-dependent correlation between T1 and T2 further support that these two tissue property values reflect different cyto- and myelo-architectures of the human cortex, which is variable across different BAs.Acknowledgements
This study is supported by NIH R01 NS109439.References
1. Ma D, Gulani V, Seiberlich N. et al. Magnetic resonance fingerprinting. Nature. 2013; 4;495(7440):187-192.
2. Ma D, Jones SE, Deshmane A. et al. Development of high resolution 3D MR fingerprinting for detection and characterization of epileptic lesions. J Magn Reson Imaging. 2019; 49(5):1333-1346.
3. Badve C, Yu A, Rogers M. et al. Simultaneous T1 and T2 Brain Relaxometry in Asymptomatic Volunteers using Magnetic Resonance Fingerprinting. Tomography, 2015; 1(2):136-144.
4. Badve C, Yu A, Dastmalchian S. et al. MR Fingerprinting of Adult Brain Tumors: Initial Experience. AJNR Am J Neuroradiol. 2017; 38(3):492-499.
5. Ma D, Jiang Y, Chen Y. et al. Fast 3D magnetic resonance fingerprinting for a whole-brain coverage. Magn Reson Med. 2018; 79(4):2190-2197.
6. Smith SM. Fast robust automated brain extraction. Hum Brain Mapp. 2002;17(3):143-155.
7. Mazziotta J, Toga A, Evans A. et al. A probabilistic atlas and reference system for the human brain: International Consortium for Brain Mapping (ICBM). Philos Trans R Soc Lond B Biol Sci. 2001; 356(1412): 1293–1322.
8. Avants B and Gee JC. Geodesic estimation for large deformation anatomical shape averaging and interpolation. Neuroimage. 2004;23 Suppl 1:S139-50.
9. Zhang, Y. and Brady, M. and Smith, S. Segmentation of brain MR images through a hidden Markov random field model and the expectation-maximization algorithm. IEEE Trans Med Imag, 20(1):45-57, 2001.
10. Marques JP, Khabipova D, Gruetter R. Studying cyto and myeloarchitecture of the human cortex at ultra-high field with quantitative imaging: R1, R2* and magnetic susceptibility. Neuroimage. 2017;147:152-163.
11. Scholz J, Klein MC, Behrens T. et al. Training induces changes in white matter architecture, Nat Neurosci. 2009; 12(11): 1370–1371.
Figures