1536
Differentiation of Peritumoral White Matter in Glioblastomas and Metastases using Magnetic Resonance Fingerprinting1Case Western Reserve University School of Medicine, Cleveland, OH, United States, 2Department of Biomedical Engineering, Case Western Reserve University, Cleveland, OH, United States, 3Departments of Neurosurgery and Pathology, University Hospitals Cleveland Medical Center, Cleveland, OH, United States, 4Seidman Cancer Center and Case Comprehensive Cancer Center, Cleveland, OH, United States, 5Department of Radiology, University Hospitals Cleveland Medical Center, Cleveland, OH, United States, 6Department of Population and Quantitative Health Sciences, University Hospitals Cleveland Medical Center, Cleveland, OH, United States
Synopsis
The utility of MR fingerprinting (MRF) in characterization of non-enhancing tumor (NET) region in brain tumors has not been demonstrated. Quantitative characterization of NET (aka peritumoral white matter) in glioblastomas (GBM) is essential to identify imaging surrogates for tumor infiltration and predict future recurrence. Here we demonstrate the utility of pre and post contrast MRF to characterize and compare the NET region surrounding GBMs and metastases (METS). We identify NET radiomic features that are unique to each tumor type as well as features that can differentiate near (within 1 cm) versus far (beyond 1 cm) NET regions within each group.
Introduction
MR Fingerprinting (MRF) is a quantitative imaging framework that allows simultaneous rapid measurements of multiple tissue properties such as T1 and T2. In our previous work, we have demonstrated the utility of MRF and MRF-radiomics to differentiate between various brain tumor types as well as survival prediction (1, 2). However, previous studies have not been able to differentiate between the NET region (defined as area of T2/FLAIR hyperintense signal) surrounding the enhancing tumor (ET) of METs and GBMs. The aim of this study was to compare NET region in glioblastomas and metastases using radiomics analysis of magnetic resonance fingerprinting (MRF) to identify potential imaging surrogates for areas of tumor infiltration.Methods
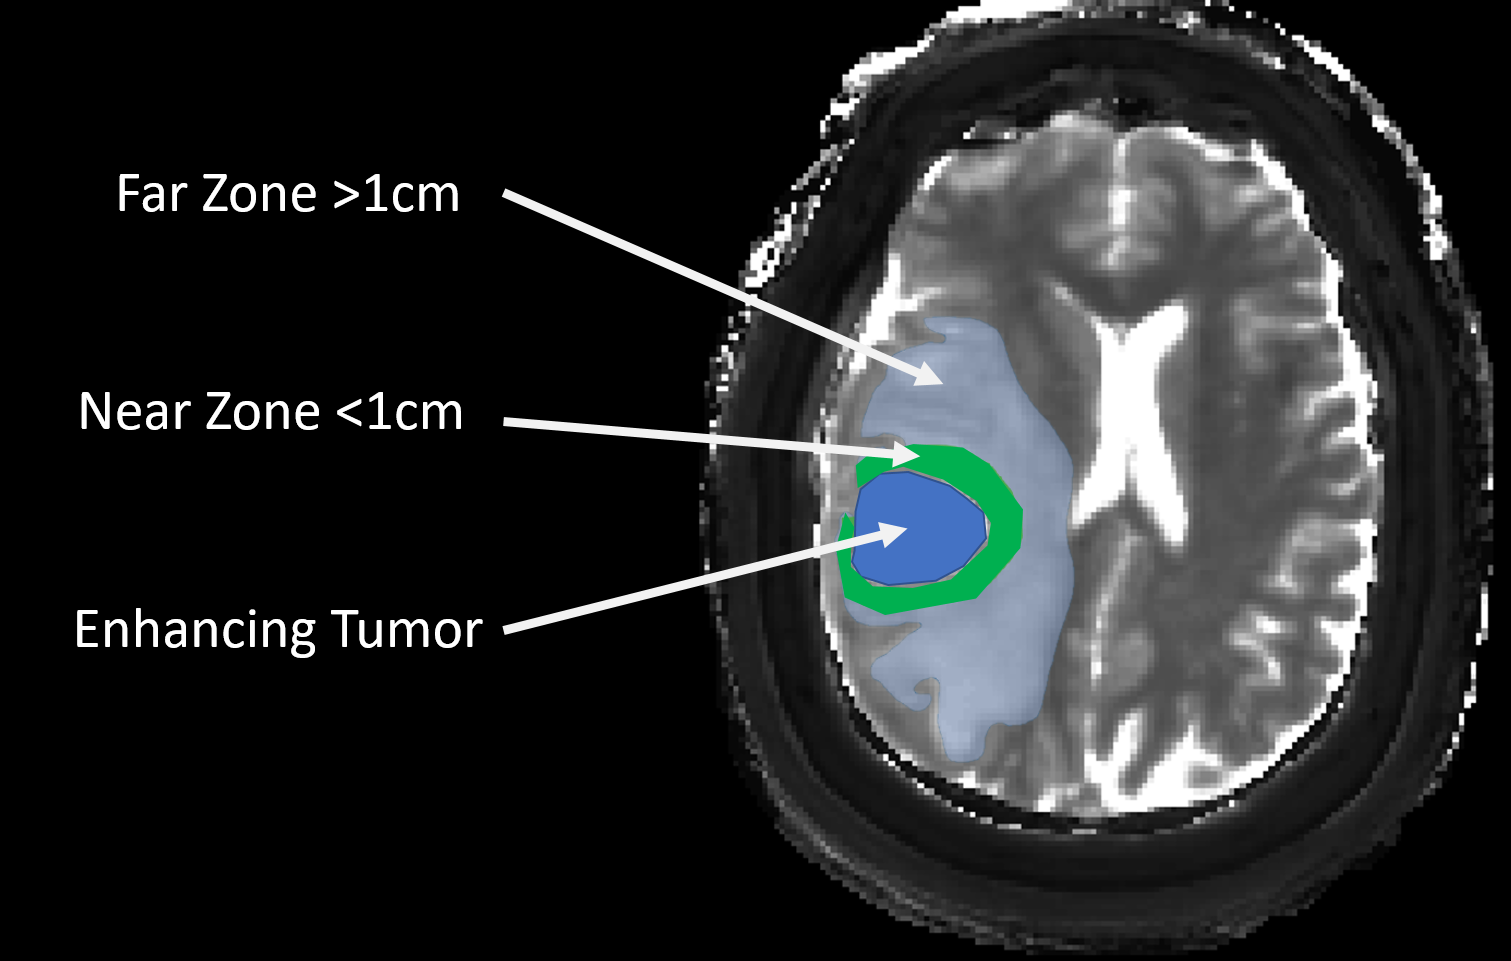
MRF imaging was performed in untreated GB patients and untreated brain metastases (primary cancers involving lung, breast, esophagus) patients in an IRB approved study. A 3D FISP based MRF sequence with 1.2x1.2x3 mm3 resolution and scan time of 5-6 minutes was acquired during a clinical MRI scan. B1 mapping was acquired separately (3). Pre contrast MRF maps were acquired in 24 GBMs and 25 METs, pre and contrast MRF was available in 9 GBMs and 10 METs. The pre and post contrast MRF maps were processed and used for further analysis after coregistration. For each subject the entire T2/FLAIR hyperintense region surrounding the enhancing tumor was segmented. This NET region was further segmented into near zone (within 1 cm of enhancing tumor margin) and far zone (all signal abnormality beyond near zone) regions (see Fig 1). Using GLCM and GLRLM techniques, 38 different texture features were calculated for each region. Students t-tests were used to compare radiomics features in near zone across the two tumor types. Paired t-tests were used to compare near and far zones within each tumor type. P value of less than 0.05 was considered significant. Bonferroni multiple comparison correction was performed for the number of groups tested.Results
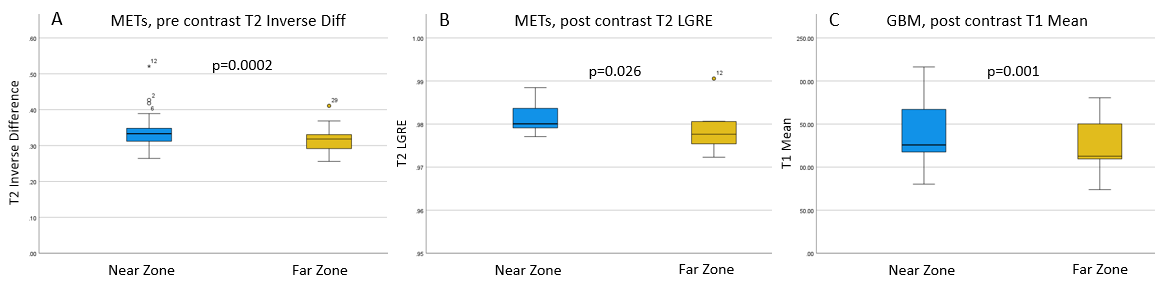
A total of 41 features were analyzed across two tumor groups and near and far regions. We found 10 features were significantly different between near and far zones of NET region in GBMs and 19 features were significantly different in METs. A distinct set of 3 radiomic features based on post contrast MRF maps was identified that could uniquely separate the near and far zones in GBMs. Additionally, a unique group of 14 texture features derived from post contrast MRF T1 and T2 maps was able to differentiate between near zones of GBMs versus METs and a set of 13 texture features were able to differentiate between far zones of the two tumor groups. Fig. 3 and 4 demonstrate box plots with most significant p-values for near versus far and GBM versus METs analyses.Discussion
T2/FLAIR hyperintense NET region in GBs consists of a combination of edema and tumor infiltration while metastases are surrounded by edema without tumor infiltration. In GBMs, it is known that the probability of tumor infiltration is higher closer to the margins of the enhancing tumor. Tumor infiltration in the NET region cannot be identified based on current clinical imaging techniques. This study demonstrates that several MRF based radiomics features can differentiate between near and far zones in NET region in GBMs as well as METs. The results suggest that the near and far zones within NET region surrounding GBMs have distinct radiomic signatures, particularly on post contrast MRF mapping. Interestingly, radiomic features from post contrast T2 maps provide the best differentiation between near NET regions of GBMs and METs, a finding challenging the conventional role of T2 weighted images in brain tumor imaging. Even within GBMs, there are differences in near and far zone which suggest an underlying regional heterogeneity and may be at least in part affected by areas underlying tumor infiltration. As tumor infiltration is a key cause of subsequent tumor recurrence and increased mortality, the results suggest that MRF has the potential to offer a quantitative biomarker to evaluate peritumoral region characteristics.Conclusion
Non-enhancing tumor regions surrounding GBMs and METs have unique tissue properties that can be effectively captured by MRF-radiomic analysis, particularly with post contrast MRF imaging. The results from this study suggest that MRF has the potential to be a quantitative imaging biomarker for characterization of peritumoral edema in GBs and potentially identify areas of tumor infiltration.Acknowledgements
The authors would like to acknowledge support by National Institutes of Health 1R01BB017219, 1R01EB016728, the Clinical and Translational Science Collaborative (CTSC) of Cleveland, Cristal Award from Case Comprehensive Cancer Center and Siemens Healthineers.References
1. Badve C, Yu A, Dastmalchian S, Rogers M, Ma D, Jiang Y, et al. MR Fingerprinting of Adult Brain Tumors: Initial Experience. Am J Neuroradiol. 2017;38:492–9.
2. Dastmalchian S, Kilinc O, Onyewadume L, Tippareddy C, McGivney D, Ma D, et al. Radiomic analysis of magnetic resonance fingerprinting in adult brain tumors. Eur J Nucl Med Mol Imaging [Internet]. 2020 [cited 2020 Nov 30]; Available from: https://doi.org/10.1007/s00259-020-05037-w
3. Ma D, Jiang Y, Chen Y, McGivney D, Mehta B, Gulani V, et al. Fast 3D magnetic resonance fingerprinting for a whole-brain coverage. Magn Reson Med. 2018;79:2190–7.
Figures
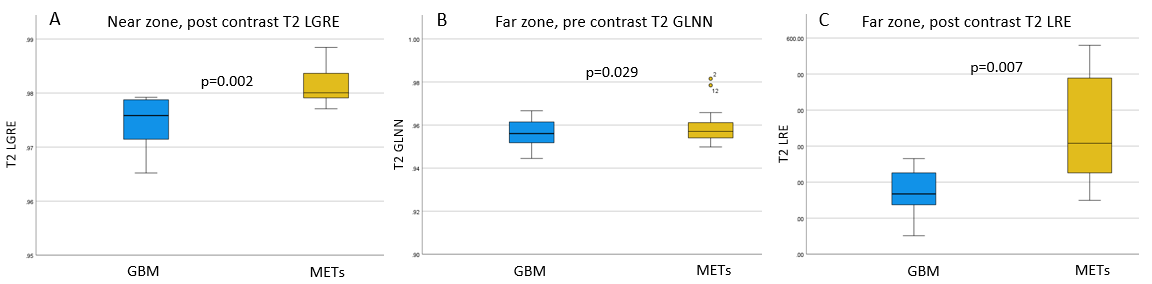
Boxplots of significant pre and post contrast T2 texture features from near and far zones showing GBM vs METs