1534
Noise Considerations for Accelerated MR Vascular Fingerprinting
Gregory J. Wheeler1 and Audrey P. Fan1,2
1Biomedical Engineering, University of California Davis, Davis, CA, United States, 2Neurology, University of California Davis, Davis, CA, United States
1Biomedical Engineering, University of California Davis, Davis, CA, United States, 2Neurology, University of California Davis, Davis, CA, United States
Synopsis
Magnetic resonance vascular fingerprinting (MRvF) enables the simultaneous measurement of quantitative oxygen saturation, cerebral blood volume, and microvascular radii maps from a single scan. Accelerating image acquisition for MRvF would enable new dynamic investigations into cerebrovascular diseases. Acquisition acceleration will result in tradeoffs between parameter map accuracy, time resolution, and noise. We performed a simulation study in which five signal-to-noise ratios and five echo train lengths were used to generate 25 simulated datasets to assess limits required for accurate matching. Vascular parameter matching accuracy increases with increased SNR and echo train length and requires an SNR above at least 20.
Introduction
Magnetic resonance fingerprinting (MRF) represents a paradigm shift in MR acquisition and reconstruction1. Through simulation of MR signals with a known set of parameters and a carefully constructed sequence, one can match their acquired signal to the predefined dictionary and extract the quantitative parameters utilized to generate the simulated signal. MR vascular fingerprinting (MRvF) was developed to extract vascular parameters from quantitative BOLD signals using the fingerprinting method2. Parameter maps of oxygen saturation (SO2), cerebral blood volume (CBV), and microvascular vessel radii are reconstructed using a pattern matching algorithm between the images and dictionary, generated using a biophysical model of brain tissue microvasculature with known magnetic susceptibility within each voxel (Figure 1).Previous MRvF studies2,3 have used a gradient echo sampling of the free induction decay and spin echo (GESFIDE) sequence to investigate models of stroke and brain tumors. Our ultimate goal is to accelerate the image acquisition used for MRvF by utilizing a highly accelerated spin and gradient echo (SAGE) pulse sequence4,5 for dynamic parameter mapping. This acceleration is expected to result in a tradeoff between noise and acquisition time, so the simulations here examine the robustness of this technique to varying levels noise and echo train lengths.
Methods
Vascular fingerprinting dictionaries for the simulated SAGE sequence were generated using the MRVox6 toolkit in MATLAB. The dictionary contained 64,000 signal entries through simulating combinations of 40 values of SO2 from 0 to 100%, 40 values of CBV from 0.1 to 25%, and 40 values of radius from 1 to 24 microns.Complex gaussian noise was added to this dictionary to create five simulated datasets with signal-to-noise ratios (SNR) of 80, 40, 20, 10, and 5. An example combination of parameters (SO2 = 82.5%, CBV = 5%, and radii = 4.25 μm) with levels of added noise is shown in Figure 2a. The six datasets (one noise free, five of varying SNR levels) were then subsampled in the time dimension to generate subsampled datasets with 80, 40, 20, 10, and 5 timepoints to mimic accelerated acquisitions with fewer acquired echo times (TE). A schematic of the subsampled echo spacings is shown in Figure 3a.
Ten representative vascular parameter combinations were selected and the corresponding signal from each of the 25 noisy datasets (5 SNR levels, 5 TEs) was matched to the entire noise-free dictionary to determine the predicted vascular parameters. Matching was performed by finding the maximum coefficient of determination (R2) between the sample and each dictionary entry. This was repeated 1000 times with different random noise to calculate the average root-mean-square error (RMSE) between the predicted and actual vascular parameters for each SNR/TE combination.
Results
The ability of the matching algorithm to distinguish the best match from other dictionary entries at different SNRs was assessed by generating R2 maps. The example combination of parameters (SO2 = 82.5%, CBV = 5%, and radii = 4.25 μm, Fig. 2a) was used to generate simulated data curves at different levels of SNR, which were correlated with all 64,000 dictionary entries to calculate R2 maps (Fig. 2b). As SNR increases the R2 values also increase, and the reconstructed parameter values are closer to the ground truth values. When subsampling the number of echoes used for matching, a decreasing number of TE did not visually lead to decreasing R2 values (Fig. 3b), as was seen with SNR.Figure 4 shows an example of reconstructed radii maps at different combinations of SNR and TE. The ability to reconstruct the original image improves with increasing SNR and number of TEs. A decreased accuracy of radius estimates can also be seen at the right edge of each figure, which corresponds to the signals generated with higher SO2 values. The accuracy of parameter predictions was quantitatively assessed by calculating RMSE between predicted and actual parameters (Fig. 5). Increasing SNR led to lower RMSE for all parameters, and in cases with sufficient SNR (20, 40, and 80), increasing number of TEs also resulted in a decrease in RMSE for all parameters.
Discussion and Conclusion
The proposed accelerated SAGE sequence collects five volumes of the brain per repetition time5 (Fig. 3a). This means that the number of times to repeat the sequence and produce high SNR through averaging or generate an adequate echo train for accurate fingerprint matching dictates the possible time resolution of the technique with this sequence. The simulation results indicate that an increased number of timepoints benefit reconstruction accuracy if images have adequate SNR. The results also indicate that the ability to accurately map vessel radii is highly dependent on SNR.This study used simulations with known parameters to generate noisy data, but with future in vivo studies it will be important to validate MRvF generated maps to parameter maps generated through established sequences. Upon this further validation in vivo, the accelerated MRvF acquisition will allow us to generate vascular parameter maps dynamically and investigate various pathologies in functional settings.
Acknowledgements
The project described was supported by the National Center for Advancing Translational Sciences, National Institutes of Health, through grant number UL1 TR001860 and linked award TL1 TR001861. The content is solely the responsibility of the authors and does not necessarily represent the official views of the NIH.References
- Ma D, Gulani V, Seiberlich N, et al. Magnetic resonance fingerprinting. Nature. 2013;495(7440):187-192.
- Christen T, Pannetier NA, Ni WW, et al. MR vascular fingerprinting: A new approach to compute cerebral blood volume, mean vessel radius, and oxygenation maps in the human brain. Neuroimage. 2014;89:262-270.
- Lemasson B, Pannetier N, Coquery N, et al. MR
Vascular Fingerprinting in Stroke and Brain Tumors Models. Sci Rep.
2016;6(1):37071.
- Schmiedeskamp H, Straka M, Newbould RD, et al. Combined spin- and gradient-echo perfusion-weighted imaging: Spin- and Gradient-Echo PWI. Magn Reson Med. 2012;68(1):30-40.
- Manhard MK, Bilgic B, Liao C, et al. Accelerated whole‐brain perfusion imaging using a simultaneous multislice spin‐echo and gradient‐echo sequence with joint virtual coil reconstruction. Magn Reson Med. 2019:mrm.27784.
- Pannetier NA, Debacker CS, Mauconduit F, Christen T, Barbier EL. A Simulation Tool for Dynamic Contrast Enhanced MRI. PLoS ONE. 2013;8(3):e57636.
Figures
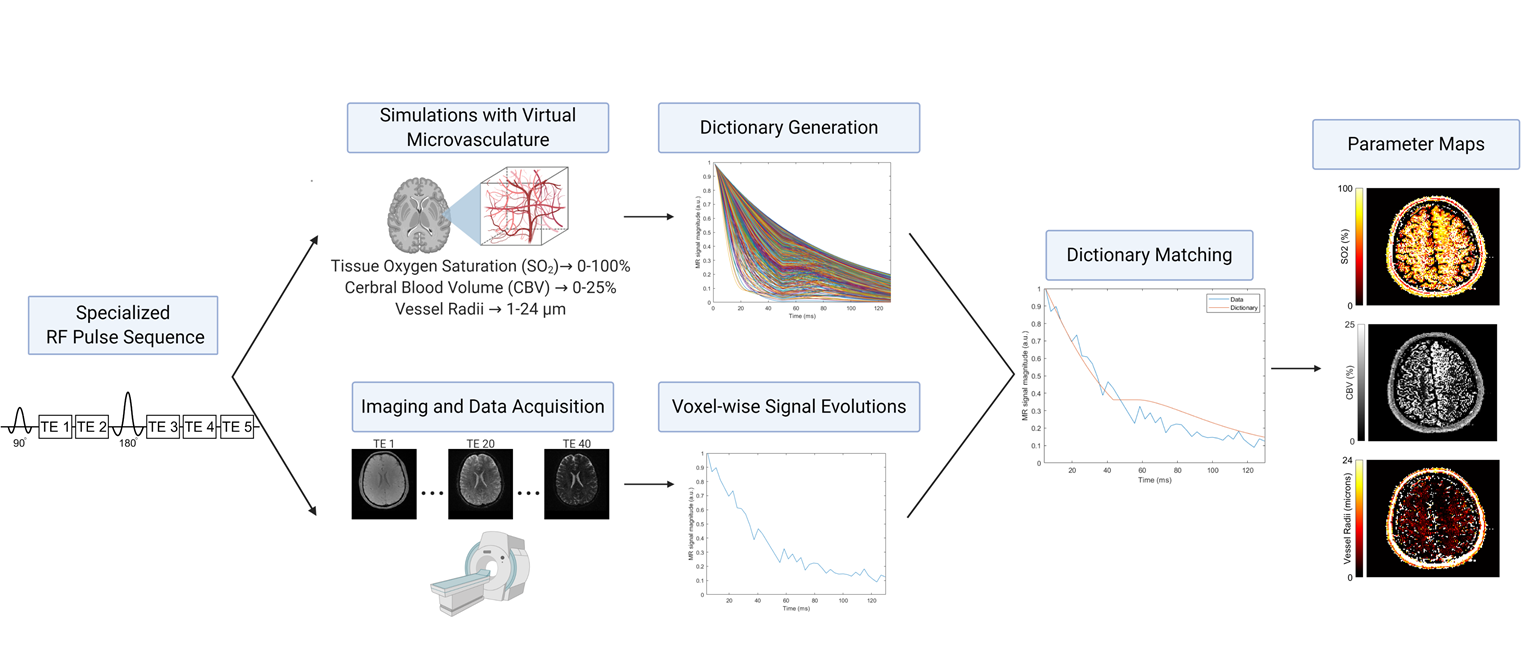
Figure 1. Overview of the MR vascular
fingerprinting technique. A pulse sequence sensitive to the vascular parameters
of interest is utilized for both imaging and MR physics simulations. Physiological
ranges of SO2, CBV, and vessel radii
are used to simulate the MR signal in a virtual voxel with each combination of
those parameters. After the images are acquired, the time-course signal
evolution of each voxel is compared to all dictionary entries. The closest
match between the fingerprint and dictionary allows for the extraction of the underlying
parameters for quantitative mapping.
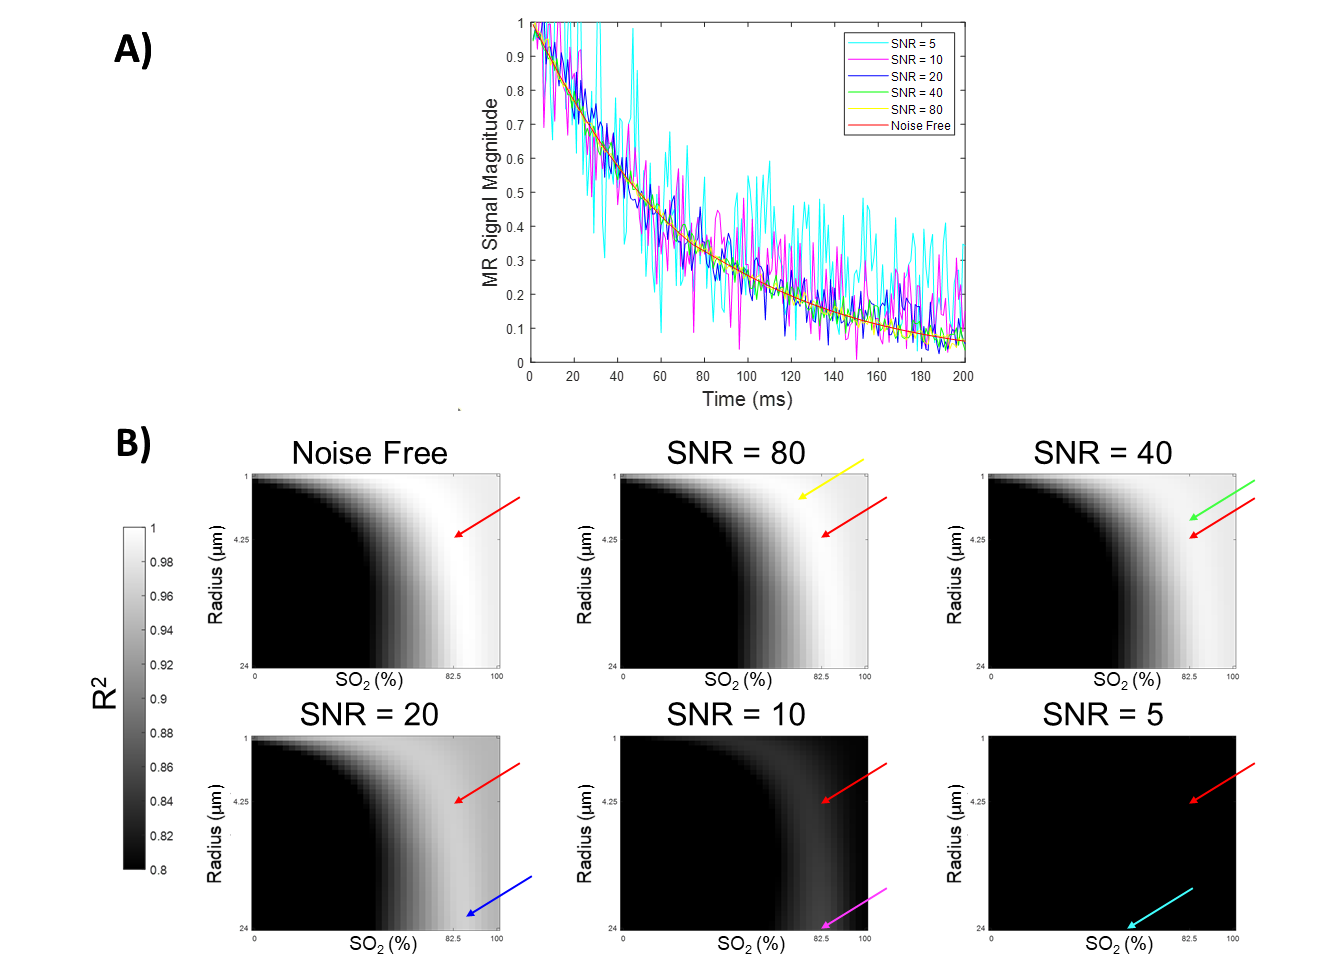
Figure 2. A) The signal evolution of a simulation with SO2, CBV, and vessel radii of 82.5%, 5%, and 4.25 μm
respectively (red line) as well as the signal with added noise as labelled. B) The
R2 values obtained by matching each
dictionary entry to the example noise-free and noisy signals. The maps show where CBV =
5% with all combinations of SO2 and
radius. The red arrow indicates the true parameters underlying the signal and
each color represents the parameters predicted at that noise level for SO2 and radius with fixed CBV.
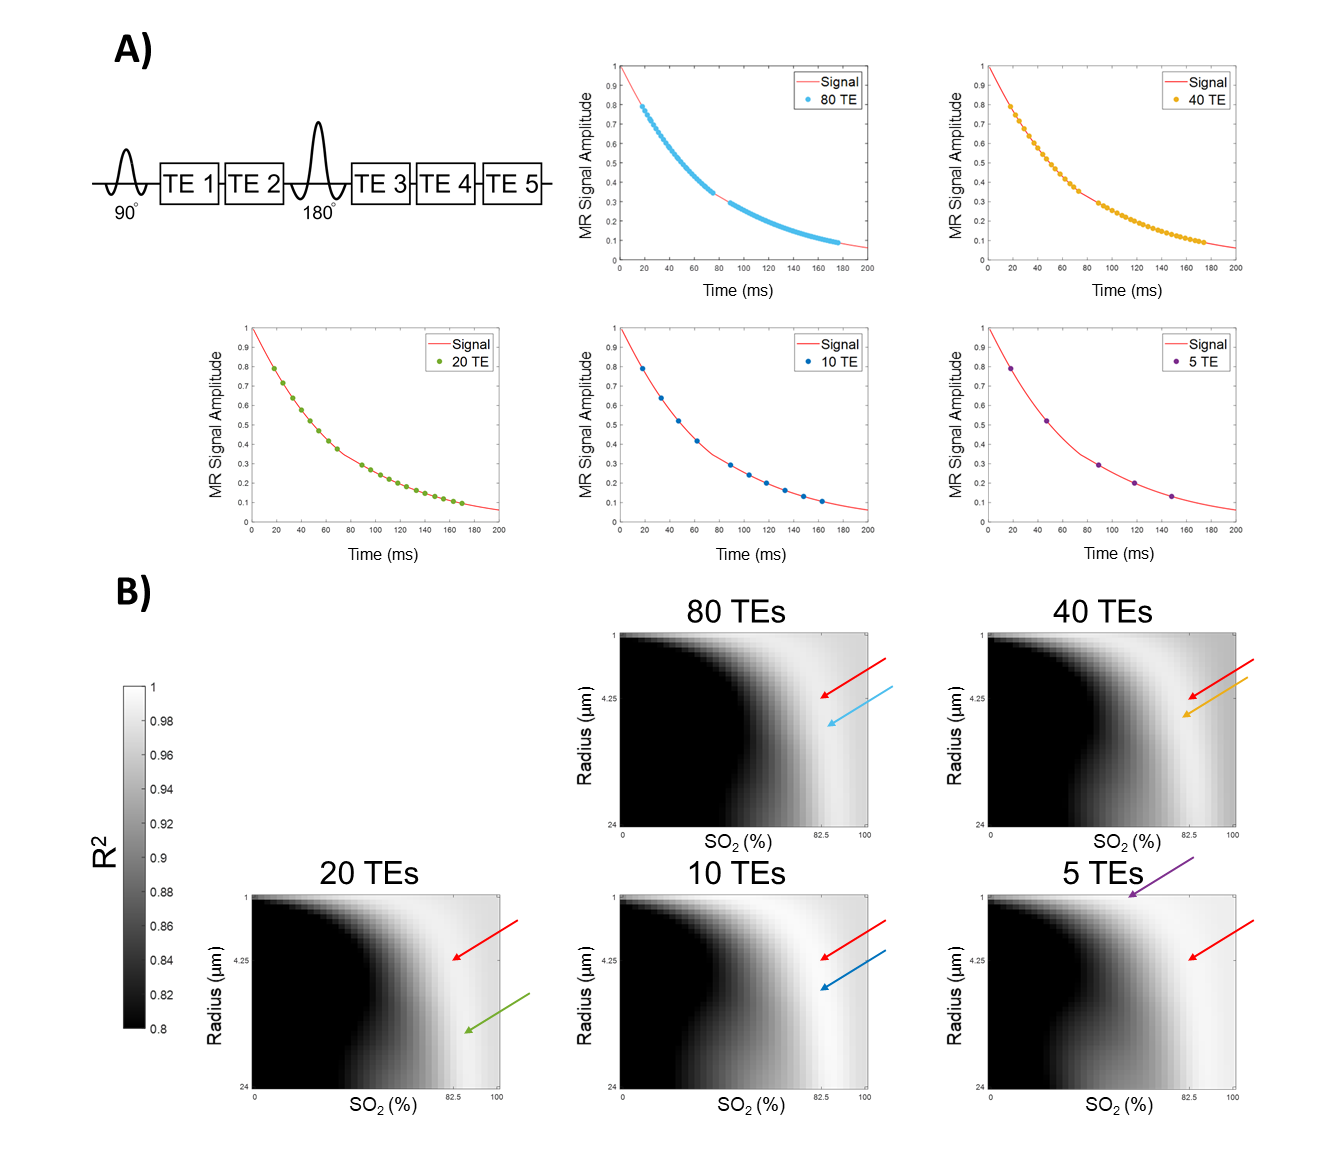
Figure 3. A) The points in the signal
time-course at which each TE is acquired for the different train lengths. B) The
R2 values obtained by matching each
dictionary entry to the example signal with the various number of echoes at an SNR of 40. The
maps show where CBV = 5% with all combinations of SO2 and radius. The red arrow indicates the true
parameters of the signal and each color represents the parameters predicted with
the displayed number of TE at this SNR.
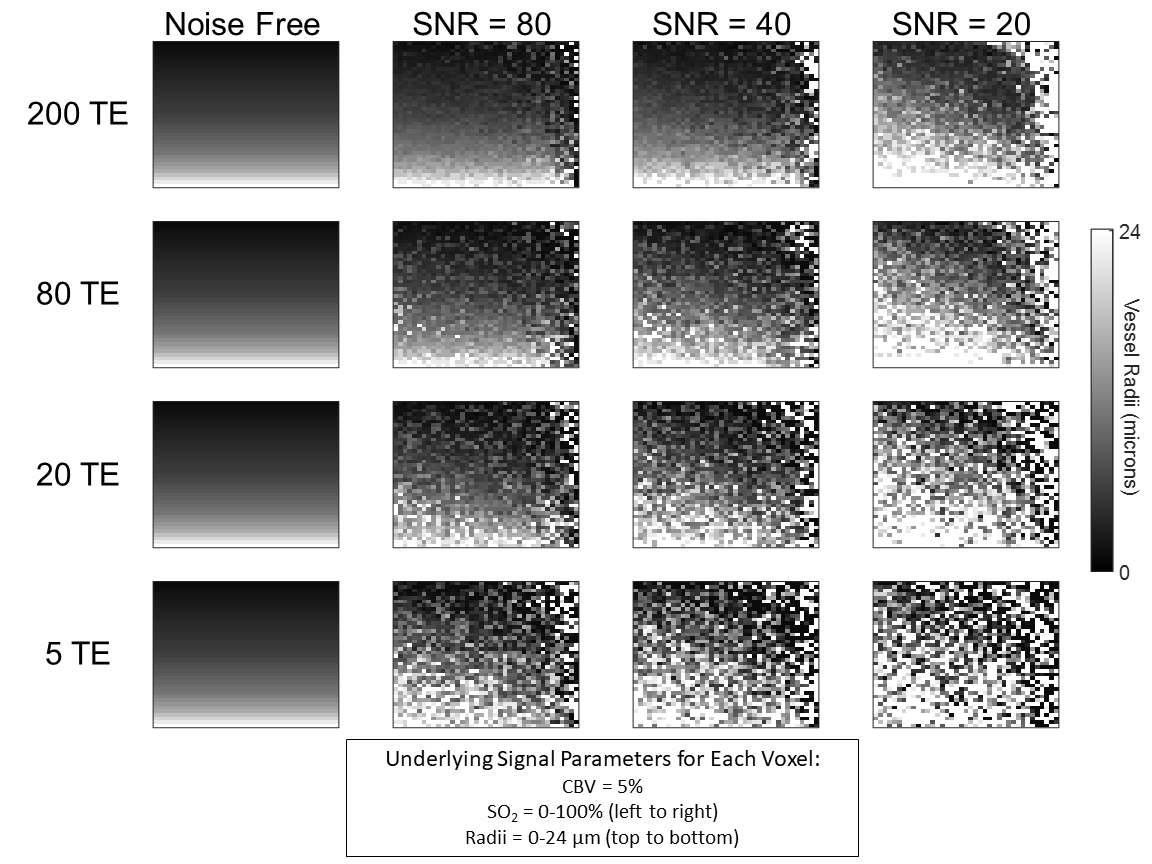
Figure 4. Vessel radii maps reconstructed from simulations at three SNR
levels and in a noise-free setting with four different number of TEs. The noise free
column represents the true radii maps used to generate the signals prior to the
addition of noise. The underlying parameters used to generate each pixel had
CBV = 5%, SO2 increasing from 0-100%
(left to right), and radius increasing from 1-24 μm (top to bottom).
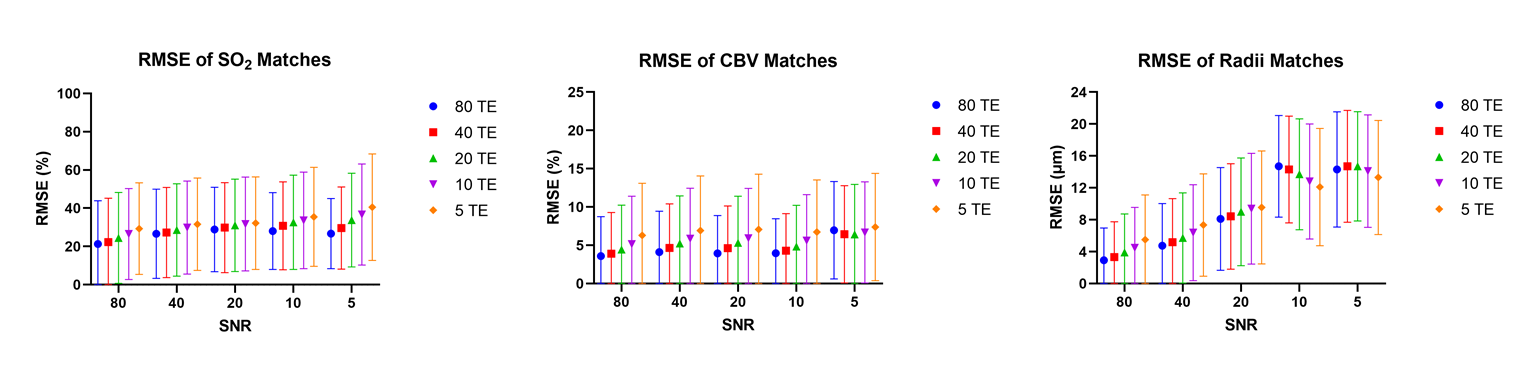
Figure 5. Mean RMSE of vascular parameters predicted from matching
algorithm and the signals true underlying parameter values at five SNRs and
with five echo train lengths. The RMSE for each parameter was calculated by
taking 10 random parameter combinations and finding the RMSE at each SNR/TE
combination. This was repeated 1000 times resulting in 10,000 total RMSE values
for each SNR/TE combination tested. The means and standard deviations were calculated
and plotted as the dots and error bars in the graphs.