1533
Vascular fingerprinting using DSC MRI for quantification of microvasculature in glioma1Radiology and Nuclear Medicine, Erasmus MC, Rotterdam, Netherlands, 2Radiology, Leiden University Medical Center, Leiden, Netherlands
Synopsis
This study uses a DSC based fingerprinting approach, monitoring the time evolution of a Hybrid (H) EPI sequence (HEPI) that simultaneously acquires GRE and SE. HEPI properties are incorporated from the scanner into a simulation of contrast agent extravasation and MR signal evolution. Signals simulated during bolus passage are used to construct GRE, SE and combined GRE-SE dictionaries in which vessel permeability (k), vessel radius (R), and cerebral blood volume fraction (rCBV) are varied. The dictionary is matched to in-vivo data of a brain tumor patient to retrieve information on the underlying microvasculature.
INTRODUCTION
Dynamic Susceptibility Contrast (DSC) MRI has emerged as a powerful tool for characterization of brain tumor vasculature, commonly with a gradient echo (GRE) EPI sequence to trace the passage of an intravenously injected exogenous contrast agent (CA)1,2. Hybrid EPI (HEPI)3 is a recent technique that has the advantage of simultaneous acquisition of GRE & spin echo (SE), allowing vessel architecture imaging with one bolus. Biomarkers that can be obtained from vessel architecture imaging are influenced by numerous parameters including blood volume fraction, vessel permeability and vessel radius. To best disentangle these parameters, we propose a fingerprinting approach4 to analyse the DSC HEPI acquisition for which accurate simulation of the acquisition and CA leakage into brain tissue is relevant.In this work we integrate the exact properties of the HEPI sequence as played out on the GE scanner into a Bloch based DCE simulation tool5 that also simulates CA extravasation and diffusion. The drop in T2* (GRE) or T2 (SE) signal due to tracer passage is modelled and intensity-time curves are simulated. The aim of the study was to retrieve quantitative information about the underlying microvasculature using a dictionary specific for this DSC technique.
METHODS
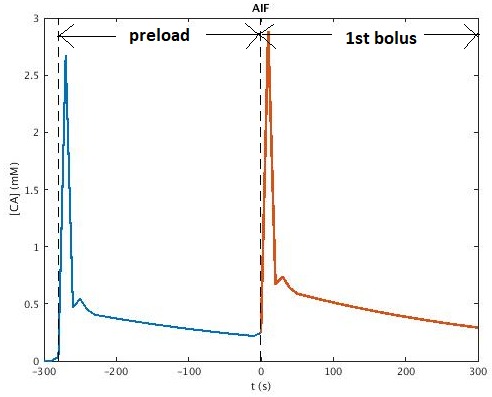
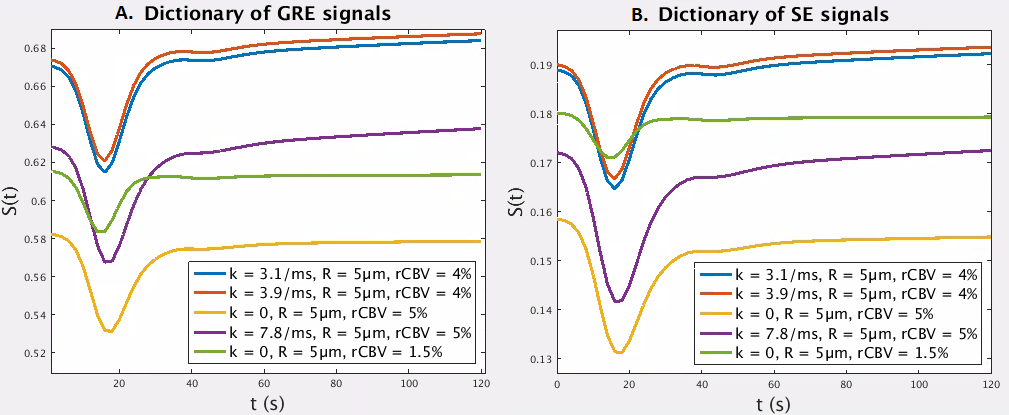
MRI data was acquired in a patient (67-year-old, male) with confirmed diagnosis of grade III anaplastic astrocytoma (IDH wildtype) at 3T (MR750, General Electric, Chicago, USA). A 2D HEPI acquisition was used (122 TRs, TR/TEGRE/TESE 1500ms/20ms/70ms, 15 slices, voxel size: 1.875 x 1.875 x 4 mm3) in which a bolus of 7.5ml of gadolinium-based CA (Gadovist, Bayer, Leverkussen, GE) was injected. rCBV maps were calculated based on the GRE time courses according to previously described methods6. Identical pre- and post-contrast T1-weighted FSPGR scans (TR/TE 6ms/2ms, voxel size 1x1x1 mm3, matrix 256 x 256, 350-370 slices for full brain coverage) were acquired. Normal appearing white and grey matter masks (NWM, NGM) were generated from the pre-contrast T1-weighted high resolution structural scan (fast, FSL v. 6.01.1, Oxford, UK). Non-enhancing tumor tissue was semi-automatically delineated as hyperintense area on the T2-FLAIR (ITK-SNAP), excluding enhancing tissue as delineated on the post-contrast T1-weighted scan. A preload bolus of equal size was given approximately 5 minutes prior to DSC imaging to compensate for T1 CA leakage effects7.We recorded details of the HEPI sequence on the same scanner, which was imported into the simulator5,8. A dictionary of signals is obtained by simulating the sequence for 5 vessels of varying permeability (k: 0 - (10) - 7ms-1), vessel radius (R: 5 - (10) - 100µm6) and cerebral blood volume fraction (rCBV: 0.5% - (10) - 20%). The simulation of 600 seconds includes a baseline of 20 seconds followed by the preload of CA 280 seconds before the used bolus. The Parker function9 is used as Arterial Input function (AIF, see Figure 1). From the combined dictionary GRE only (Figure 2A) and SE only (Figure 2B) dictionaries were extracted. Each dictionary is matched correspondingly to the GRE only, SE only, or combined time courses from the patient data by finding the atom with maximum correlation.
RESULTS AND DISCUSSION
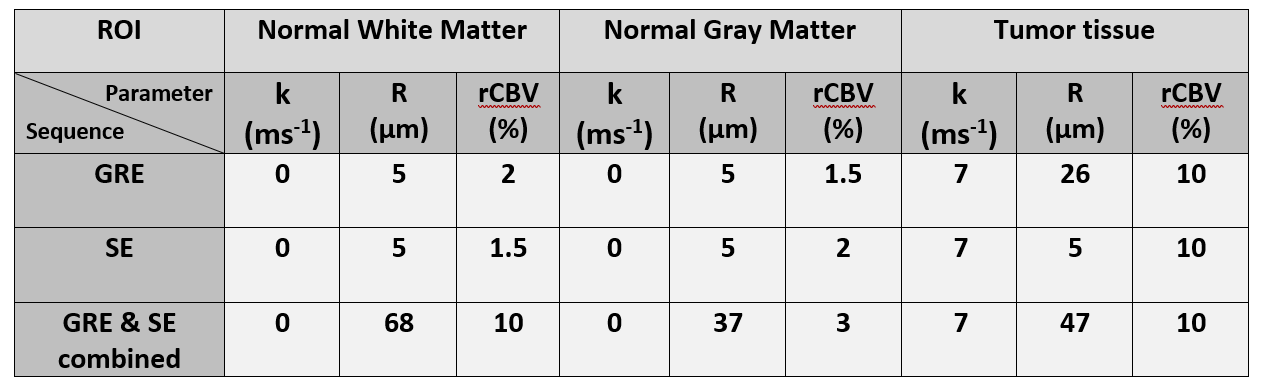
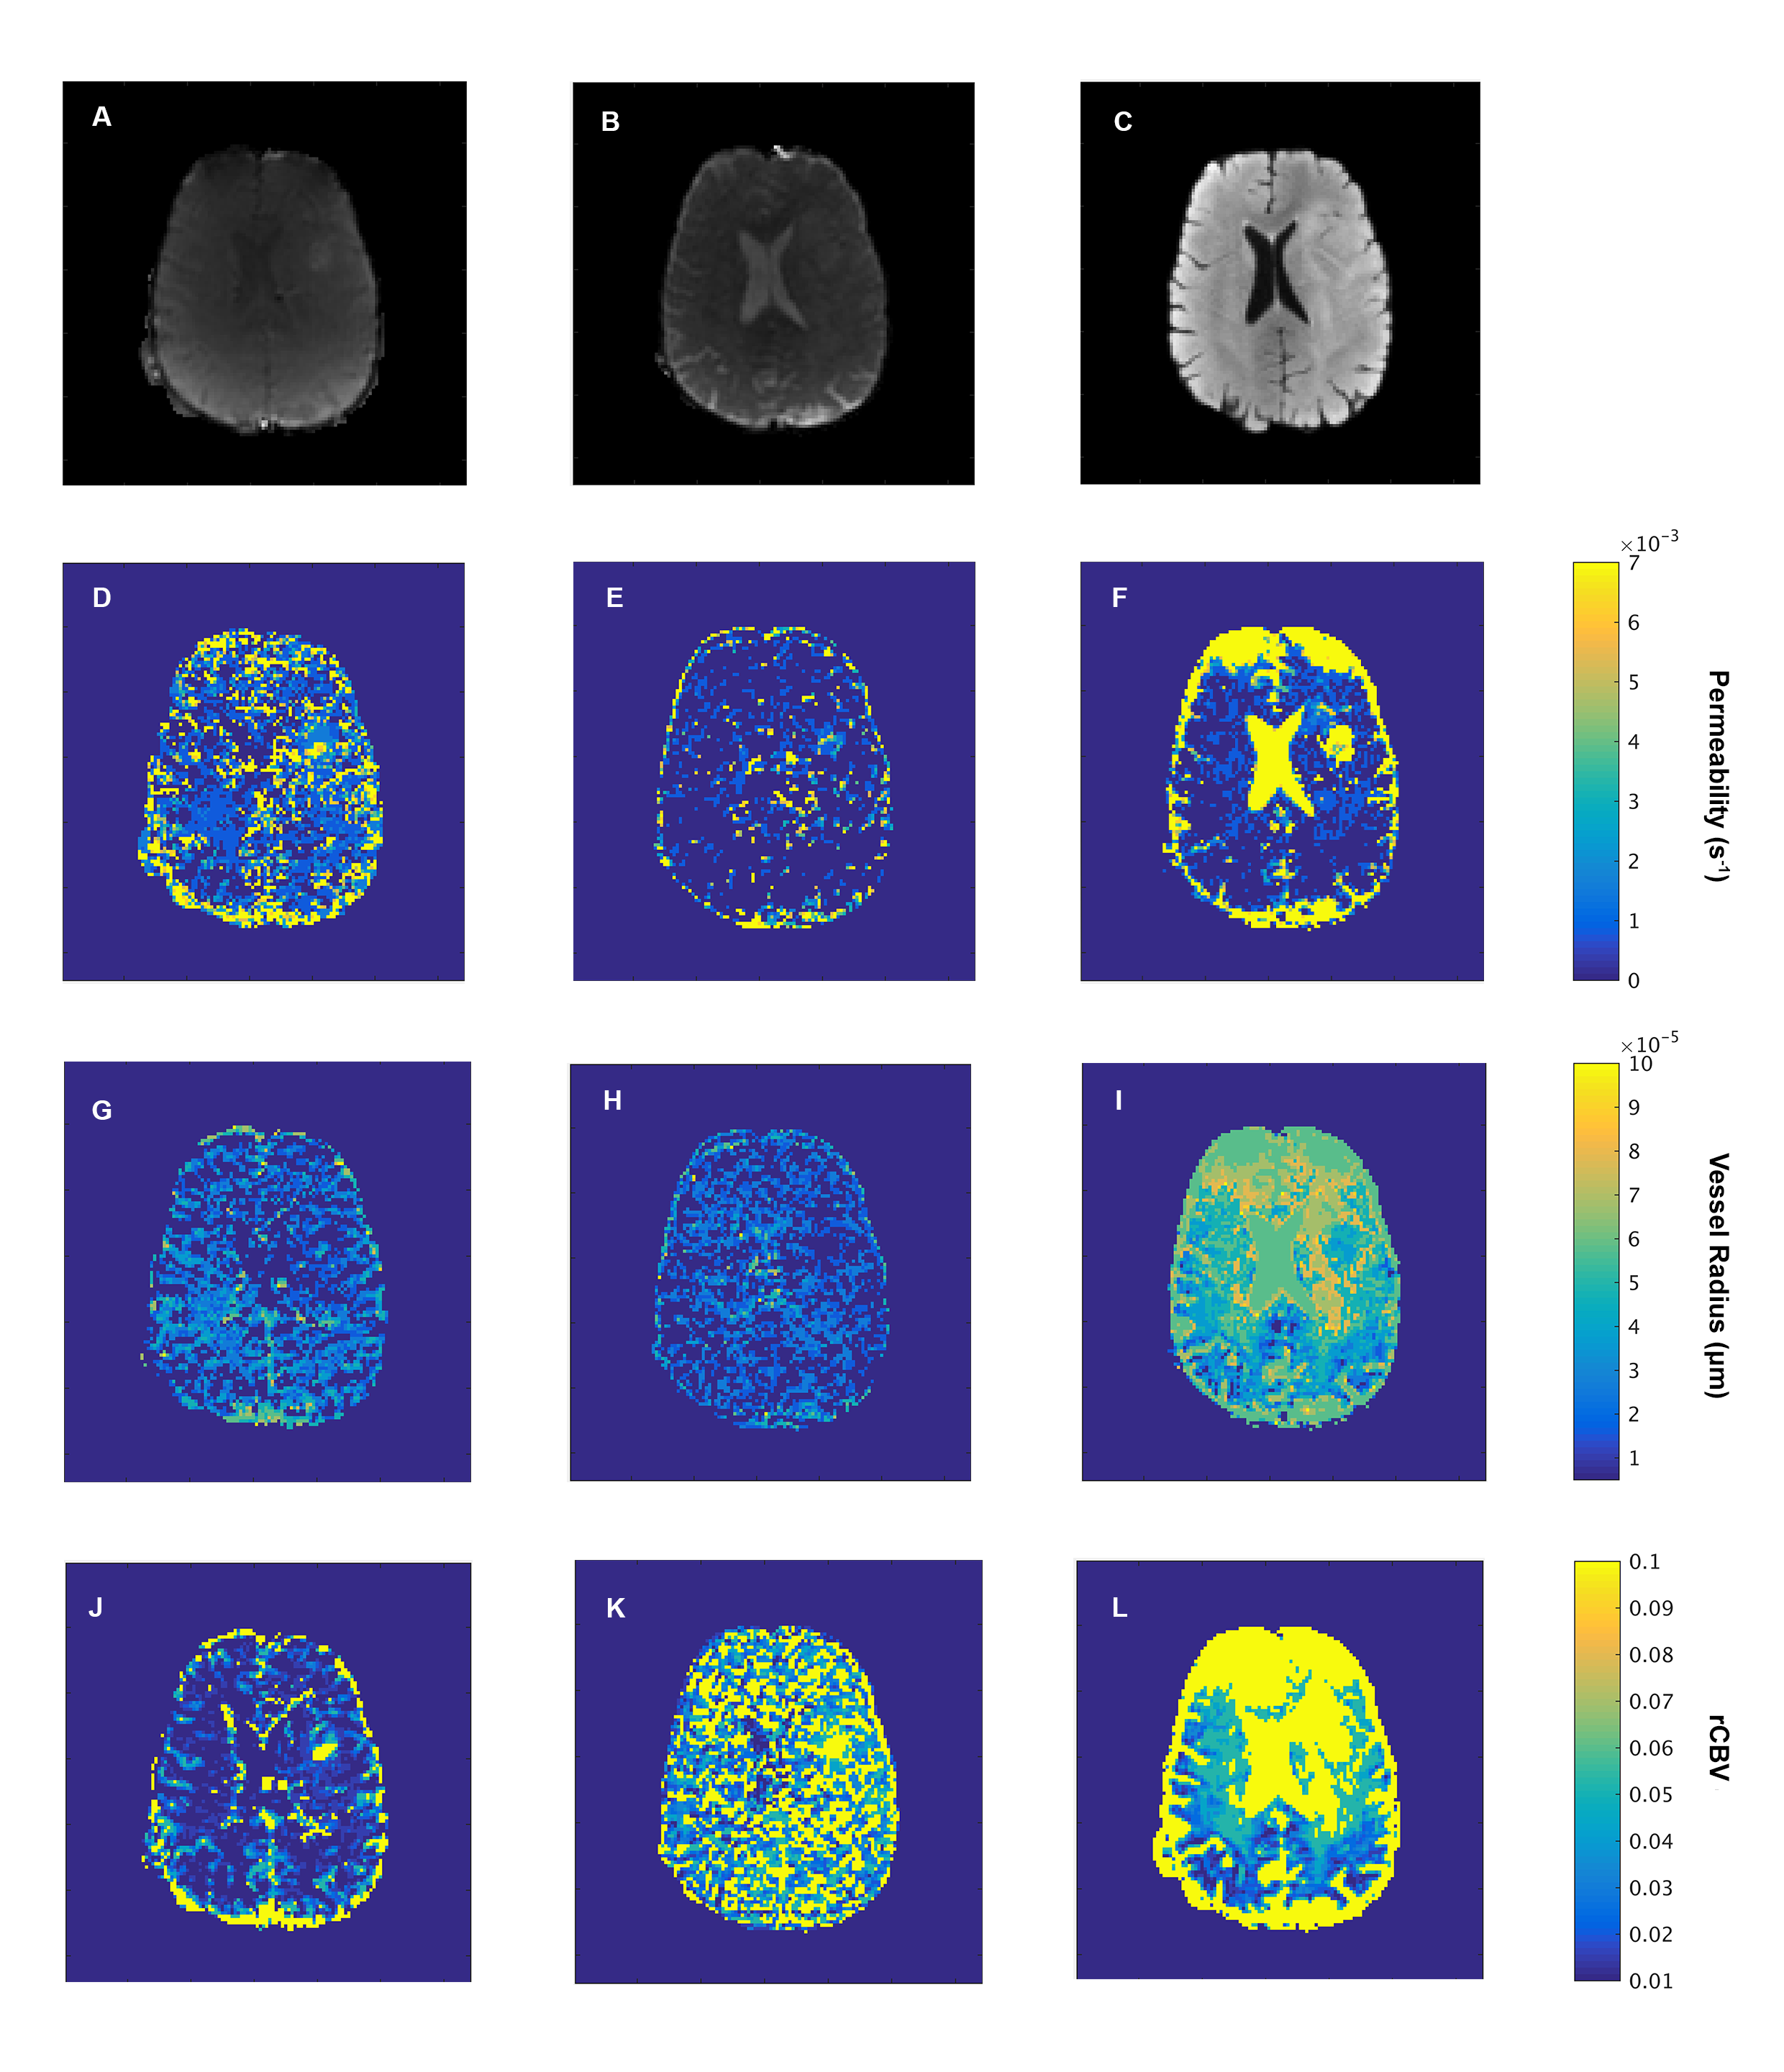
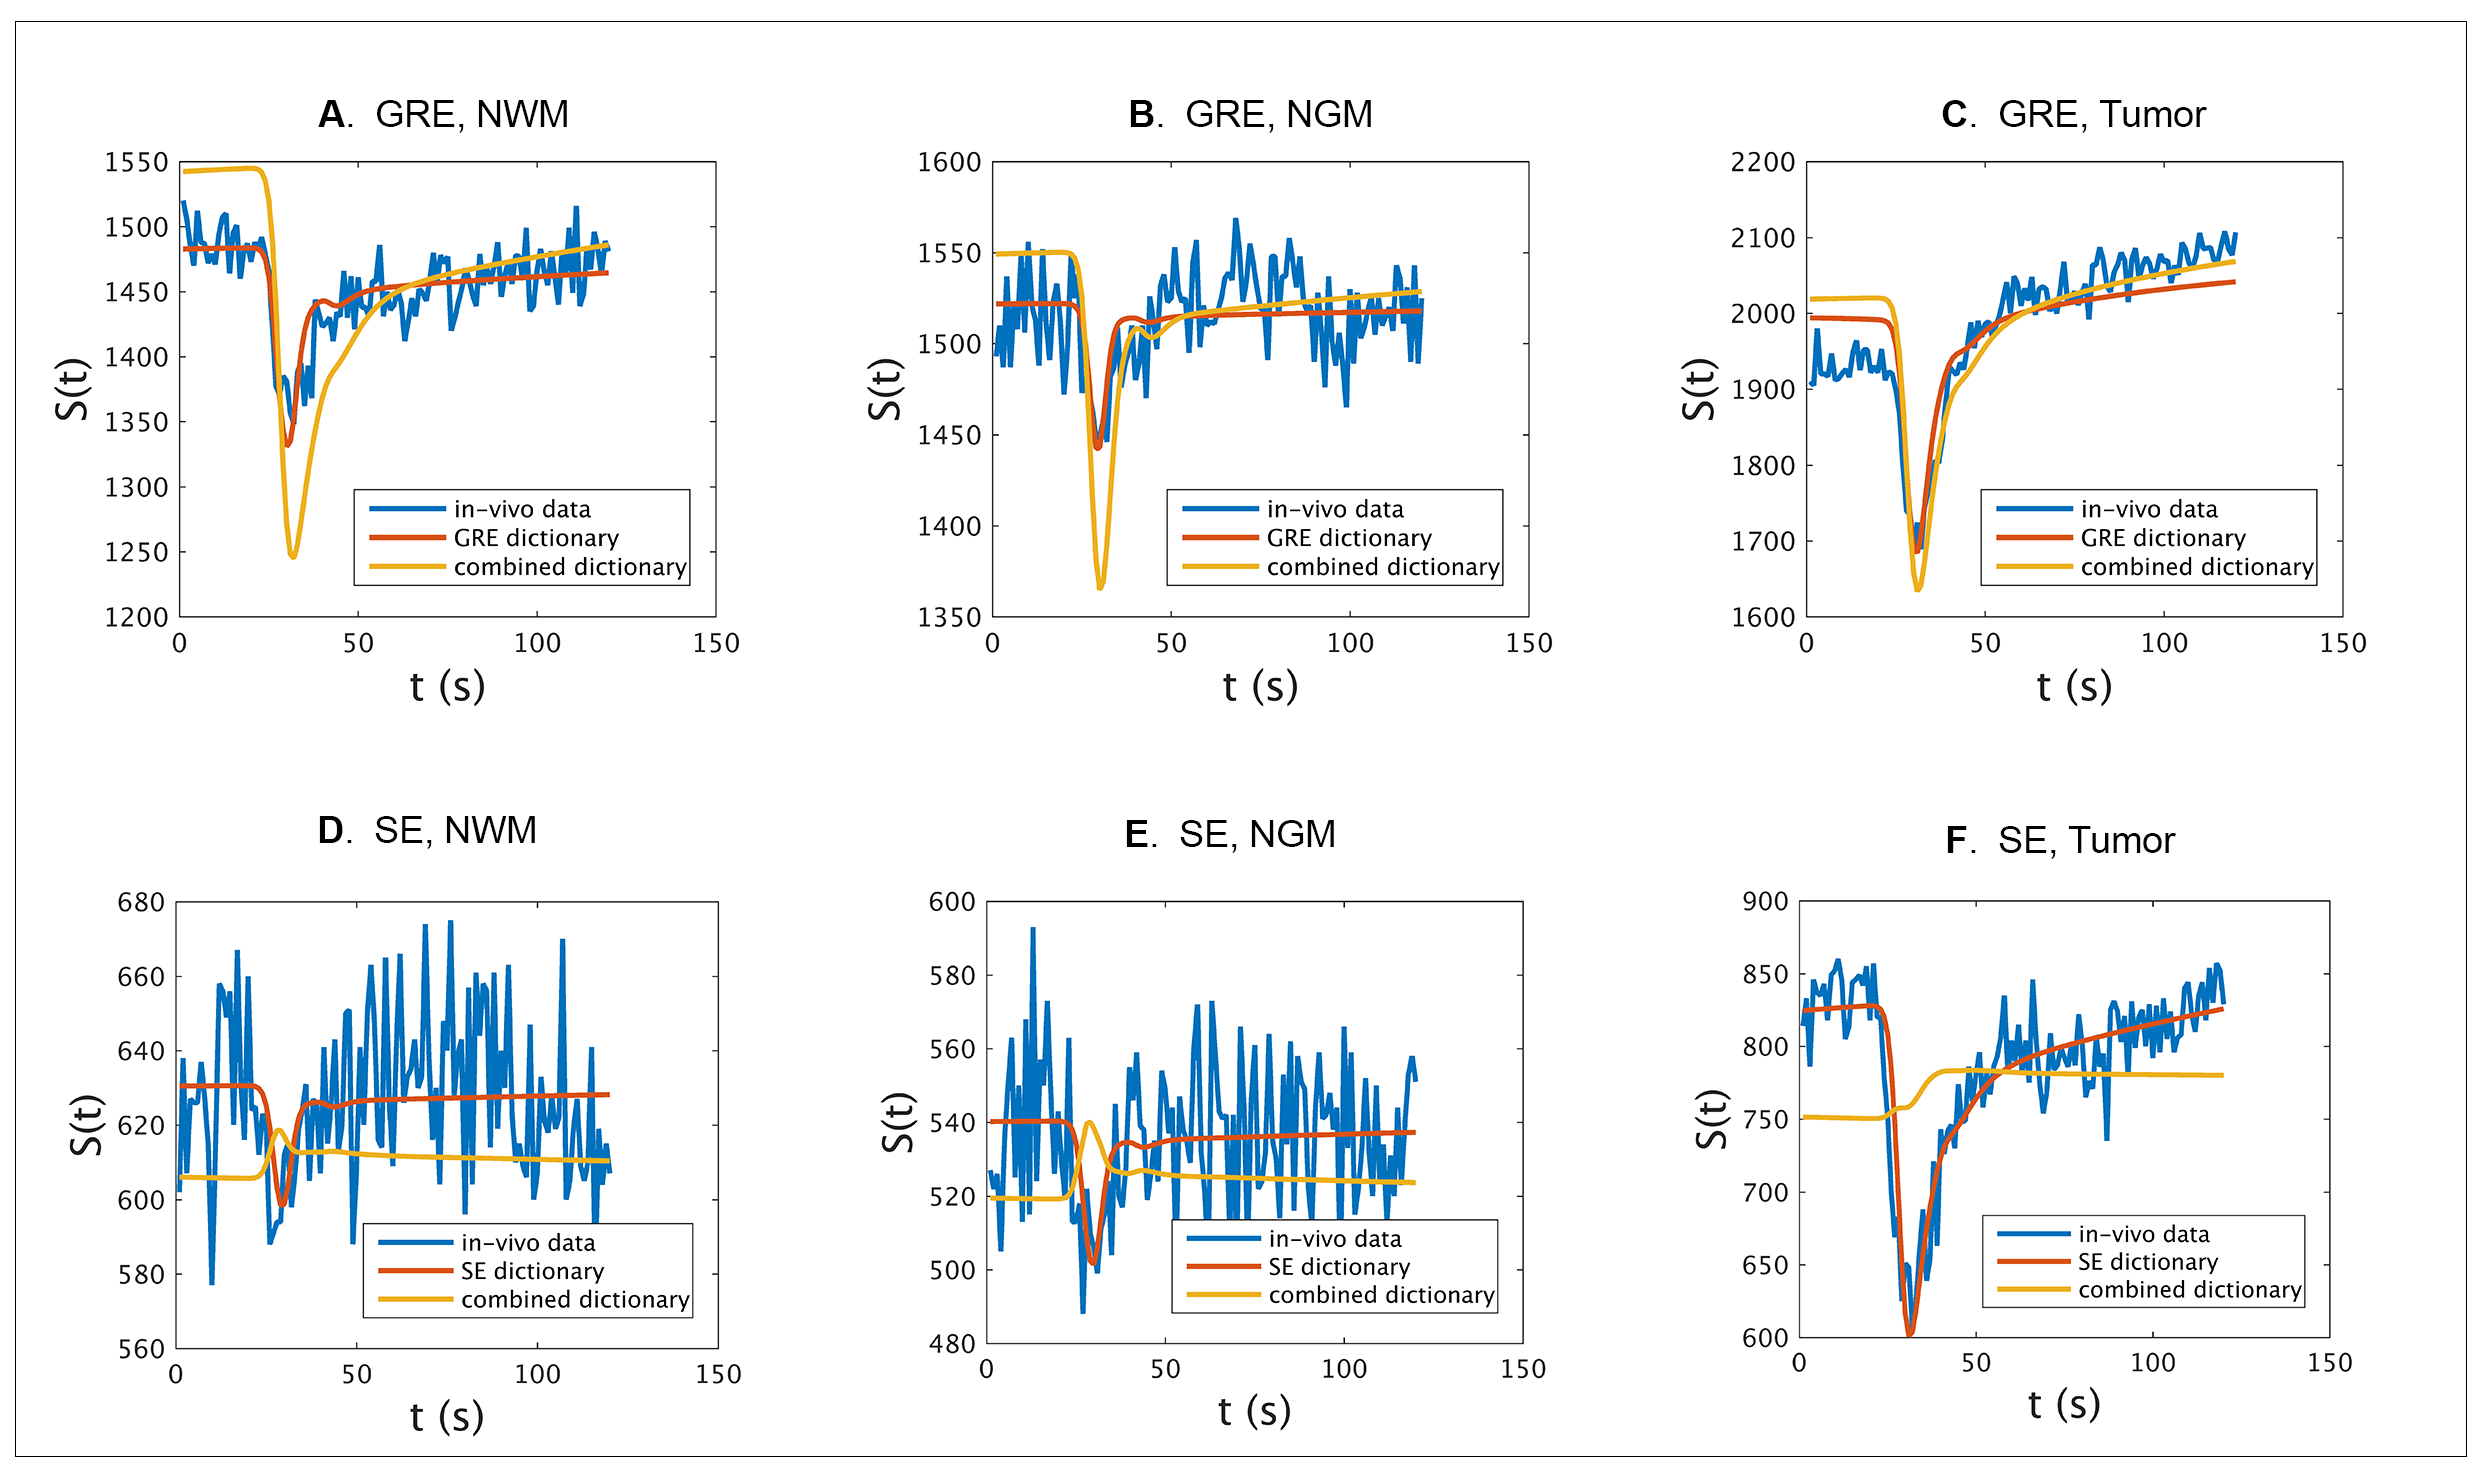
Table 1 shows the estimated k, R and rCBV values for three voxels in, respectively, NWM, NGM and enhancing tumor tissue as well as rCBV values obtained from the scanner. For all ROIs, the rCBV value from the GRE and SE dictionary agrees with the conventional rCBV map (1.3%, 1.7% and 9.5% in the corresponding voxels in NWM, NGM and tumor tissue respectively). The high value of k in the tumor region accounts for the enhancing nature of this area of the glioma. Estimates of vessel radius are observed to be different while matching to GRE and SE separately or with both combined.Figure 3 shows raw GRE (A) and SE (B) from the HEPI data as well as T2 FLAIR (C) images of slice showing the glioma in the left anterior region. Figures 3(G-L) represent the parametric maps for GRE, SE and combined data. The maps show that the model and sequence are sensitive to the microvasculature and able to differentiate between normal and tumor tissues. Figure 4 shows the GRE and SE time series in the same voxels as table 1 with the best matching dictionary atom. The results show that the individual GRE and SE dictionary atoms are highly correlated with the acquired time series, while the combined dictionary correlates less strongly. The reason for this needs to be further investigated.
CONCLUSION
We successfully imported the HEPI sequence as played out on the scanner into the simulation tool, included a preload bolus, built a dictionary of simulated DSC signals, and matched these to in-vivo data of a brain tumor patient. High correlation values were achieved, and plausible vascular information was obtained tough best matches from the combined GRE and SE dictionary showed lower correlation. The simulation and dictionary can be extended to include more vascular parameters like blood flow and oxygen saturation, which will improve the matching in the tumor area and will allow further investigation of the vascular signature of brain tumors. Further research will focus on the extent to which the inclusion of permeability into the dictionary avoids confounding by CA leakage.Acknowledgements
We are thankful to NWO domain AES (project 17079) for their support and GE Healthcare for in-kind contribution.References
[1] Villringer, Arno, et al. "Dynamic imaging with lanthanide chelates in normal brain: contrast due to magnetic susceptibility effects." Magnetic resonance in medicine 6.2 (1988): 164-174.
[2] Shiroishi, Mark S., et al. "Principles of T2*‐weighted dynamic susceptibility contrast MRI technique in brain tumor imaging." Journal of Magnetic Resonance Imaging 41.2 (2015): 296-313.
[3] Cox, Eleanor F., and Penny A. Gowland. "Simultaneous quantification of T2 and T′ 2 using a combined gradient echo‐spin echo sequence at ultrahigh field." Magnetic resonance in medicine 64.5 (2010): 1440-1445.
[4] Christen, Thomas, et al. "MR vascular fingerprinting: A new approach to compute cerebral blood volume, mean vessel radius, and oxygenation maps in the human brain." Neuroimage 89 (2014): 262-270.
[5] Pannetier, Nicolas Adrien, et al. "A simulation tool for dynamic contrast enhanced MRI." PloS one 8.3 (2013): e57636.
[6] Kellner, Elias, et al. "MR evaluation of vessel size imaging of human gliomas: Validation by histopathology." Journal of Magnetic Resonance Imaging 42.4 (2015): 1117-1125.
[7] Paulson, Eric S., and Kathleen M. Schmainda. "Comparison of dynamic susceptibility-weighted contrast-enhanced MR methods: recommendations for measuring relative cerebral blood volume in brain tumors." Radiology 249.2 (2008): 601-613.
[8] Venugopal, Krishnapriya, et al. “Contrast Agent and MR signal simulation for any MR pulse sequence on GE Scanners.” ESMRMB 2020 - 37th Annual Scientific Meeting.
[9] Parker, Geoff JM, et al. "Experimentally‐derived functional form for a population‐averaged high‐temporal‐resolution arterial input function for dynamic contrast‐enhanced MRI." Magnetic Resonance in Medicine: An Official Journal of the International Society for Magnetic Resonance in Medicine 56.5 (2006): 993-1000.
Figures