1528
A Generalized Tool for Deriving Connectomes in Support of Computational Neuroscience1Bioinformatics Group, St. Francis Xavier Unversity, Antigonish, NS, Canada, 2Department of Medicine, Boston Children’s Hospital, Boston, MA, United States, 3Department of Pediatrics, Harvard Medical School, Boston, MA, United States
Synopsis
Identifying regional neural pathways with magnetic resonance imaging (MRI) based diffusion characteristics across all possible regions of interest (ROI) is computationally expensive and demands a concerted effort to ensure reliable extraction of tractography statistics from the diffusion tensor imaging data associated with identifiable fiber tracts from a patient’s brain MRI examination. Here we present a software tool called Connectome Reporting User Shell (CRUSH) that processes DTI data using pluggable modules that can be tailored to research specific outcomes. We demonstrate the value of such a tool by conducting a whole-brain tractography-based connectomics analysis on a clinically imaged neurologically healthy population.
Purpose
We hypothesize that an integrated software technology for evaluation of the human connectome can: 1) elucidate structural brain properties on a per patient basis, 2) assist the user in performing reliable connectomics analyses through modular design (supporting the use of user-selected fiber tracking algorithms, etc.), and 3) remove the burden of implementation of computational parallelism, file management, and extraction of fiber tract information from patient samples through Big Data approaches implemented in distributed systems.Methods
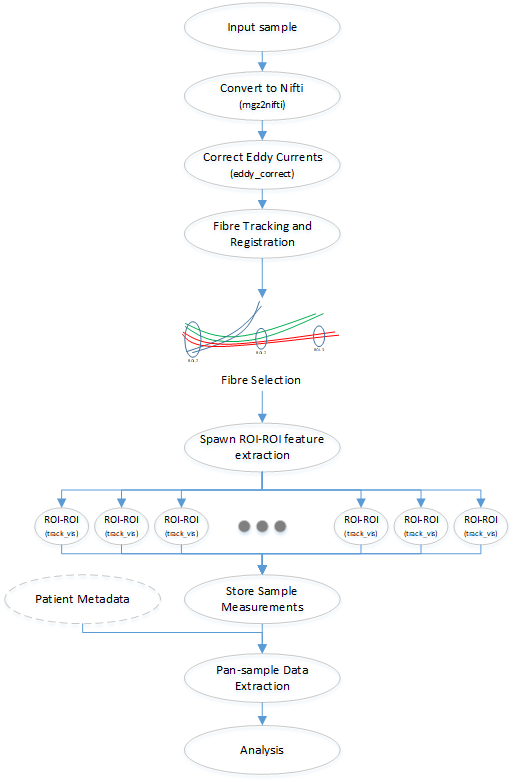
CRUSH is written in Python 3.7 and is presented as a single command line utility with a minimalist design. The core utility will run on any platform that supports python, however in most cases, the plugins will be expected to force the narrowing of supported operating systems as software such as FreeSurfer [4] and diffusion toolkit (DTK) [3] will not run on all operating systems, and they are relied upon for ROI establishment [4] and fiber tracking [3] respectively, in this study. CRUSH has two modes. (1) The iteration across all patient data included in a study, and invokes any processing pipelines found in registered plugins. These plugins can involve any information extraction pipeline, and may vary in purpose or research interest. The data from all executed plugins is recorded in common data storage using a hash-based repository. (2) The retrieval of stored data into either a wide or tall spreadsheet for the purposes of further analysis.The measurement extraction pipeline demonstrated in this research is a novel approach to expanding the previously developed regionally focused analytic procedure [1], which was demonstrated to produce reliable results on a clinically imaged population, previously studied [2]. The sequence depicted in Fig. 1 outlines the steps taken to derive fiber tracts in support of connectomics based tractography, using a combination of TrackVis/DTK [3], FreeSurfer [4], and FSL [5] command line tools.
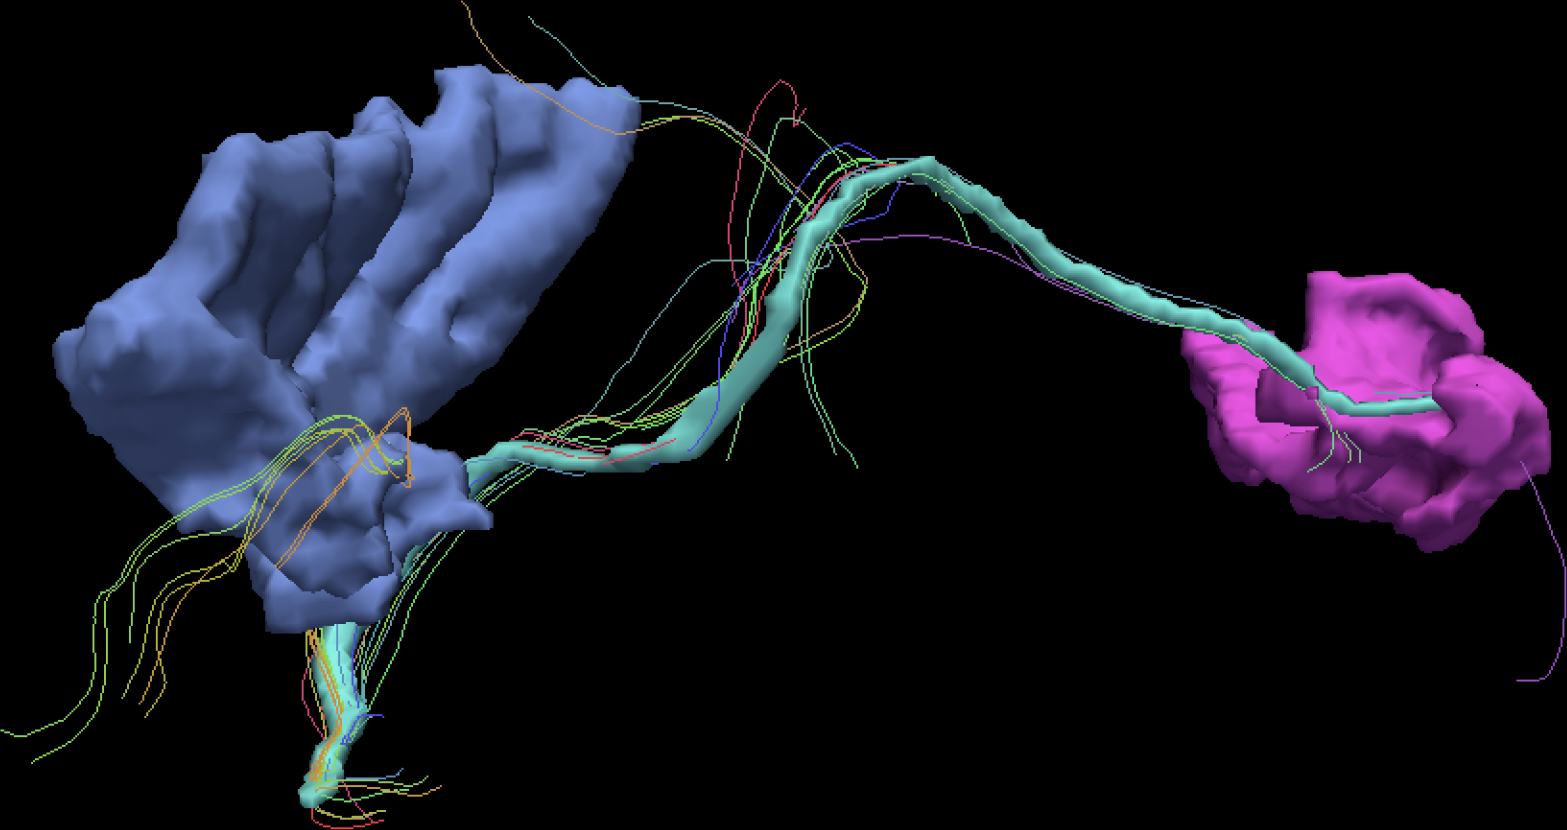
All patient examination data included in a study are converted to Nifti format and then corrected for eddy currents and patient movement. In this study, HARDI reconstruction was performed to create whole brain tract pathways by processing the diffusion MRI data in its native input space. ODF data is reconstructed and then fiber tracking is performed by DTK to produce a track file usable by TrackVis [3].
During the final stage, TrackVis was used to perform a Cartesian product of all ROIs and all TrackVis methods (roi and roi_end), resulting in approximately 65000 intersection points (180 ROIs x 180 ROIs x 2 methods). Each intersection point has 14 measurable values (along each fiber tract identified by the user selected fiber tracking method, this software computes: fractional anisotropy mean and standard deviation, apparent diffusion coefficient mean and standard deviation, tract length mean and standard deviation, number of tracts mean and standard deviation, as well as hemispheric asymmetry measurements for each extracted aforementioned statistic).
This capability, when executed at scale enabled analysis across hundreds of patient samples as we sought to understand correlations and patterns among ROIs in the entire connectome. This will provide a mechanism to discover insights, make predictions, and ultimately may create new diagnostic and disease characterization technologies for patients with autism spectrum disorder, attention deficit hyperactivity disorder, cerebral palsy and more.
Results
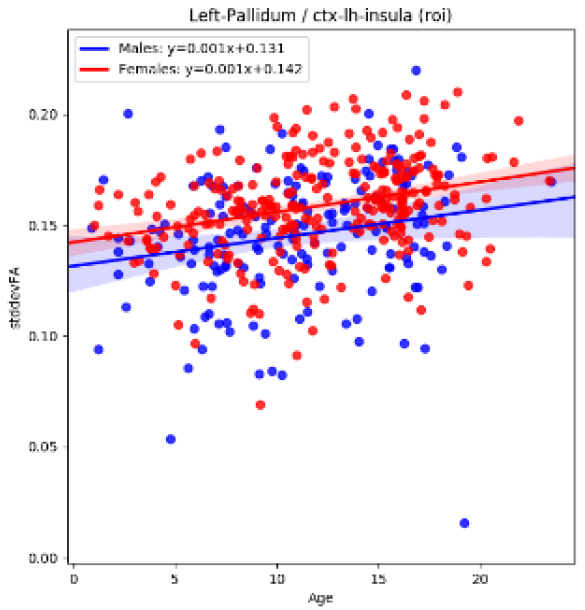
This research establishes a framework in which to perform connectomic measurements of 927,472 data points across 182 major brain regions, and is a modular expandable system that can be adapted for increased measurements with the addition of any new brain atlas / segmentation technique or fiber tracking module. Large-scale univariate statistical analyses are part of the developed software package and in this study were performed on a dataset of 642 neurotypical individuals [1], to assess characteristics of the connectomic biomarkers extracted. Machine learning models are also part of the developed software package to assess the extracted connectomics measurements’ ability to inform predictions of target patient variables (e.g. age, gender, etc.). Initial findings include the discovery of pathways whose extracted statistics are correlated with subject age across patients 0 to 20 years, such as the variability (standard deviation) of the fractional anisotropy connecting the left pallidum to the left insula (Fig 2), an example finding that may be linked with pruning-based fiber tract maturation. Findings include the successful reconstruction of the connectome in 539 of 642 patients imaged clinically using our publically available software [6]Acknowledgements
This work was supported by the National Institutes of Health (grant numbers R01HD078561, R21MH118739, HD098606, R03NS091587) to ET; Natural Science and Engineering Research Council of Canada's Canada Research Chair grant (grant number 231266) to JL, a Canada Foundation for Innovation and Nova Scotia Research and Innovation Trust infrastructure grant (R0176004) to JL, a Natural Science and Engineering Research Council of Canada Discovery Grant (R0192004) to JL and a St. Francis Xavier University research startup grant to JL (grant number R0168020).References
[1] Levman, J., et al. (2019). Asymmetric Insular Connectomics Revealed by Diffusion Magnetic Resonance Imaging Analysis of Healthy Brain Development. Brain Connectivity. Vol 9, Issue 1, Pages 2-12. doi.org/10.1089/brain.2018.0582
[2] Levman, J., et al. (2017). A pediatric structural MRI analysis of healthy brain development from newborns to young adults. Hum Brain Mapp. 38:5931–5942. doi: 10.1002/hbm.23799
[3] Wang, R., et al. (2007). Diffusion Toolkit: A Software Package for Diffusion Imaging Data Processing and Tractography. Annual Meeting of the International Society for Magnetic Resonance Medicine, Berlin.
[4] Fischl, B., (2012). FreeSurfer, NeuroImage,Vol 62, Issue 2, Pages 774-781, doi.org/10.1016/j.neuroimage.2012.01.021.
[5] M. Jenkinson, C.F. Beckmann, T.E. Behrens, M.W. Woolrich, S.M. Smith. (2012) FSL. NeuroImage, 62:782-90
[6] Mattie, D., Levman, J., CRUSH, (2019), GitHub Repository, https://github.com/stfxecutables/crush
Figures