1526
Altered Large-Scale Brain Networks in Mesial Temporal Lobe Epilepsy Based on Dynamic Causal Modeling1Shahed University, Tehran, Iran (Islamic Republic of), 2Tehran University of Medical Sciences, Tehran, Iran (Islamic Republic of), 3Institute for cognitive science studies, Shahid Beheshti University, Tehran, Iran (Islamic Republic of), 4Brain and Spinal Cord Injury Research Centre, Neuroscience Institute, Tehran University of Medical Sciences, Tehran, Iran (Islamic Republic of)
Synopsis
In this study, dynamic causal modeling (DCM) was applied to resting state fMRI data of mesial temporal lobe epilepsy (mTLE) patients to determine the directional alternations in effective connectivity in large scale brain networks. We hypothesized that mTLE alters the functional connectivity in both temporal and extra-temporal functional brain networks. We further hypothesized that the altered connectivity is directional (The direction between two network nodes matters). The results showed significantly different effective connectivity in default mode, limbic and salience networks.
Introduction
Mesial temporal lobe epilepsy (mTLE) is the most common type of focal epilepsy1,2. Psychological assessments and imaging approaches support the hypothesis that TLE is a network disorder3,4. We applied dynamic causal modeling (DCM) to resting state fMRI data of mTLE patients as well as healthy individuals to investigate how the large scale brain networks are altered by mTLE. We examined effective connectivity in four major brain networks, including default mode network (DMN) , attention network (ATN), salience network (SN) and limbic network (LIN).Methods
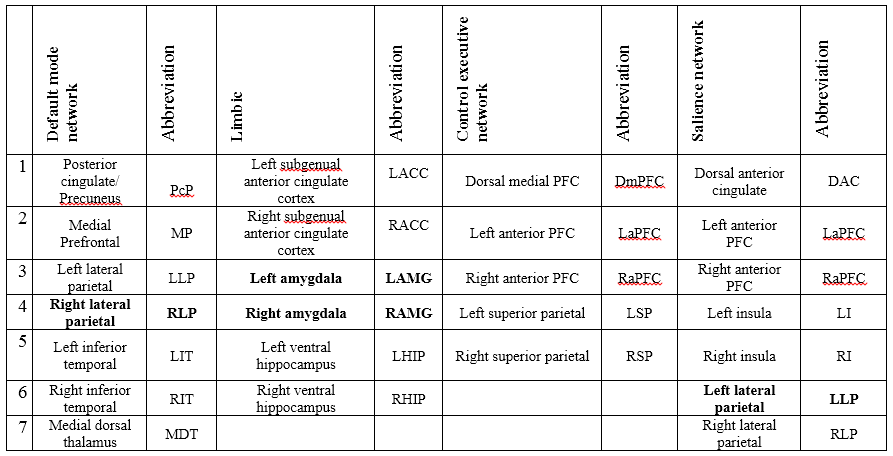
Thirty-five unilateral patients were studied (21 left, 14 right mTLE; 19 females, 21 men; age range: 17-54; mean age 30.4 yrs). The resting-state fMRI data were preprocessed using the DPARSF 4.3 advanced edition based on SPM12: Images were realigned and corrected for head-motion artifacts The realigned functional volumes were spatially normalized to the MNI space using the normalization parameters estimated from T1 structural image (voxel size [3, 3, 3]). Then, the data were smoothed using Gaussian kernel (FWHM = 8 mm), detrended to remove linear trends, and temporally filtered (0.01– 0.08 Hz) to decrease the effect of low-frequency drifts. We used coordinates four resting-state networks5: default mode network (DMN), central executive network (CEN), attention network (ATN), salience network (SN) and limbic network (LIN). Fig. 1 lists the ROIs. The principal eigenvariates were computed from an 8-mm-radius sphere centered on the peak F-value for each region and adjusted for the confounds. The effective connectivity was calculated using standard Bayesian technique and generative dynamic causal models (DCM12)6. The average effective connectivity for each network were compared across the three groups using one-way ANOVA. P-value less than 0.05 were considered significant.Results
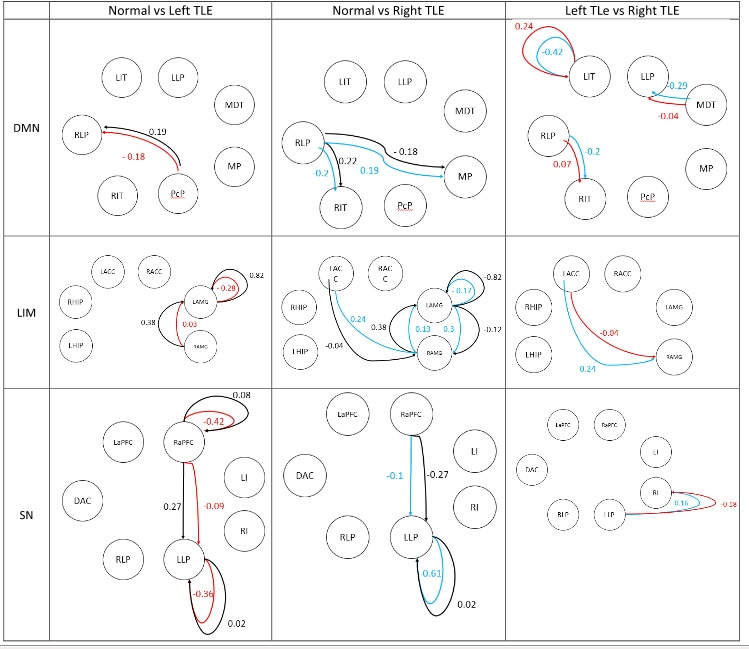
One-way ANOVA conduced for normal, left TLE, right TLE showed no significant difference between the three groups in CEN. Fig.2 shows the regions of the model in each functional network along with effective connectivity values with significant connections between each pair of groups. Positive (negative) connectivity indicates that the source region stimulates (inhibits) the activity in the target region.Conclusion
DCM shows that there is a significant alteration in network connectivity in mTLE patients compared to the control group; also between the left and right TLE groups. These results are in agreement with previous studies7 that the connectivity values are directional in nature, regardless of temporal or extra temporal brain regions. Right lateral parietal in default mode network, amygdala in limbic network and left lateral parietal in salience network are the most significant nodes between the three groups. As a propagation point for many seizures, this may reflect downstream dysfunction in patients. These finding are consistent with important roles in seizure propagation, specifically for limbic regions for both temporal and extra temporal lobe epilepsy.Acknowledgements
We must acknowledge the contribution of Iranian National Brain Mapping Lab (NBNL) and their staffs for MRI data acquisition throughout conducting this project. This work was partially funded and supported by Iran’s National Elites Foundation, National Institute for Medical Research Development (Grant No. 971683), and Cognitive Sciences & Technologies Council (Grant No. 6431), between 2017 and 2019.References
1. Engel J. Mesial Temporal Lobe Epilepsy: What Have We Learned? The Neuroscientist. 2001;7(4):340-352. doi:10.1177/107385840100700410
2. Téllez-Zenteno JF, Hernández-Ronquillo L. A Review of the Epidemiology of Temporal Lobe Epilepsy. Epilepsy Research and Treatment. 2012;2012:1-5. doi:10.1155/2012/630853
3. Chiang S, Stern JM, Engel J, Levin HS, Haneef Z. Differences in graph theory functional connectivity in left and right temporal lobe epilepsy. Epilepsy Research. 2014;108(10):1770-1781. doi:10.1016/j.eplepsyres.2014.09.023
4. Stretton J, Thompson PJ. Frontal lobe function in temporal lobe epilepsy. Epilepsy Research. 2012;98(1):1-13. doi:10.1016/j.eplepsyres.2011.10.009
5. Razi A, Seghier ML, Zhou Y, et al. Large-scale DCMs for resting-state fMRI. 2017;1. doi:10.1162/NETN
6. Friston K. Dynamic Causal Modelling ( DCM ) System System analyses analyses in in functional functional neuroimaging neuroimaging. (Dcm).
7. Bettus G, Guedj E, Joyeux F, et al. Decreased basal fMRI functional connectivity in epileptogenic networks and contralateral compensatory mechanisms. Human Brain Mapping. 2009;30(5):1580-1591. doi:10.1002/hbm.20625
Figures