1523
Data-driven analysis of Cerebrovascular Reactivity Mapping with Breath-Hold BOLDMRI in Patients with gliomas
Mei-Yu Yeh1,2, Ping Hou2, and Ho-Ling Liu 2
1Department of Biomedical Engineering and Environmental Sciences, National Tsing Hua University, Hsinchu, Taiwan, 2Department of Imaging Physics, The University of Texas MD Anderson Cancer Center, Houston, Houston, TX, United States
1Department of Biomedical Engineering and Environmental Sciences, National Tsing Hua University, Hsinchu, Taiwan, 2Department of Imaging Physics, The University of Texas MD Anderson Cancer Center, Houston, Houston, TX, United States
Synopsis
Cerebrovascular reactivity (CVR) mapping can be achieved by BOLD MRI during hypercapnia challenges, such as a breath-hold (BH) task. It has wide applications for the assessment of various neurological deficits and neurovascular uncoupling. The BH MRI is typically analyzed by modeling with a hemodynamic or respiratory response function and account for latencies in signal time courses. Accurate modeling requires physiological monitoring and/or consistent patient performance during the scan. Because the BOLD signal response to the BH is a global effect, this study proposes to utilize the individual’s whole-brain signal average as a regressor for the analysis of BH MRI.
Introduction
Cerebrovascular reactivity (CVR) MRI with hypercapnia challenges, such as a breath-hold (BH) task, has been shown useful in the assessment of various neurological deficits as well as in indicating areas with potential neurovascular uncoupling for presurgical fMRI[1]. A challenge of the BH-CVR MRI is that the task requires considerable cooperation from the participant, which is particularly difficult for the elderly [2], and variations in adherence to the instruction can affect the data quality and reliability of this method [3]. The BH MRI is typically analyzed by modeling with a hemodynamic or respiratory response function and account for latencies in signal time courses. Accurate modeling requires physiological monitoring and/or consistent patient performance during the scan. Because the BOLD signal response to the BH is a global effect, we hypothesize that for each individual the signal time course averaged over the whole brain has sufficient signal-to-noise ratio to serve as a regressor for the analysis. In this work, we propose the data-driven approach and compare with the conventional method for BH CVR mapping in patients with gliomas.Methods
Twenty-three patients with gliomas underwent the MRI study on a clinical 3T scanner. MRI scans included pre- and post-contrast T1-weighted imaging, fluid attenuated inversion recovery (FLAIR) imaging, and BH MRI (single-shot EPI, 70 dynamics, 3 cycles of 15-s BH and 45-s rest). The BH MRI data were motion-corrected, smoothed, and detrended. For the conventional analysis, BH-CVR maps were fitted with a respiratory response function and quantified with percentage signal change (PSC) and the threshold was set to 0.45 [4]. For the proposed method, a general linear model (GLM) analysis was performed using the whole-brain or gray matter averaged BOLD signal time course as independent variable and the voxel-wise BOLD signal as dependent variable, with motion vectors as covariates, and the threshold was set to t>3.45 (p<0.05, corrected). For results comparison, tumor ROIs were determined by segmentation using a deep learning model. Correlation coefficient (before threshold) and Dice index (after threshold) were calculated to compare the CVR maps obtained with the two methods.Results
For each patients, very high correlations (r>0.99) were observed between whole-brain(blue) and gray-matter averaged time course (Fig. 1). Therefore the whole-brain averaged time course was adopted for the proposed analysis and compared with the conventional method. Significant correlations were found between the CVR PSC map (conventional method,CVRPSC) and the CVR t-map (new method, CVRTmap) (r=0.69±0.02in normal tissue, r=0.59±0.04 in lesion),with high Dice indices after the threshold (0.71±0.03 in normal tissue ,0.61±0.04 in lesion). Figure 2 was showed the scatter plot between two maps in single patient(r=0.81). The differences between normal tissue and lesion regions were not significant in either correlation coefficient or Dice index.Conclusion
The proposed data-driven approach does not require physiological monitoring during the BH MRI scan. The results demonstrated good agreement with the conventional method. Further development of the method is underway to account for regional differences in the data-driven model.Acknowledgements
No acknowledgement found.References
1. Pillai JJ, Mikulis DJ. Cerebrovascular reactivity mapping: an evolving standard for clinical functional imaging. AJNR Am J Neuroradiol. 2015;36: 7–13. 2. Jahanian, H., Christen, T., Moseley, M.E., Pajewski, N.M., Wright, C.B., Tamura, M.K., Zaharchuk, G., Group, S.S.R., 2017. Measuring vascular reactivity with resting-state blood oxygenation level-dependent (BOLD) signal fluctuations: a potential alternative to the breath-holding challenge? J. Cereb. Blood Flow. Metab. 37, 2526–2538. 3. Magon, S., Basso, G., Farace, P., Ricciardi, G.K., Beltramello, A., Sbarbati, A., 2009. Reproducibility of BOLD signal change induced by breath holding. Neuroimage 45, 702–712. 4.Jay J.Pillai, and Domenico Zaca. Comparison of BOLD Cerebrovascular Reactivity Mapping and DSC MR Perfusion Imaging for Prediction of Neurovascular Uncoupling Potential in Brain Tumors. Technology in Cancer Research and Treatment ISSN 1533-0346Figures
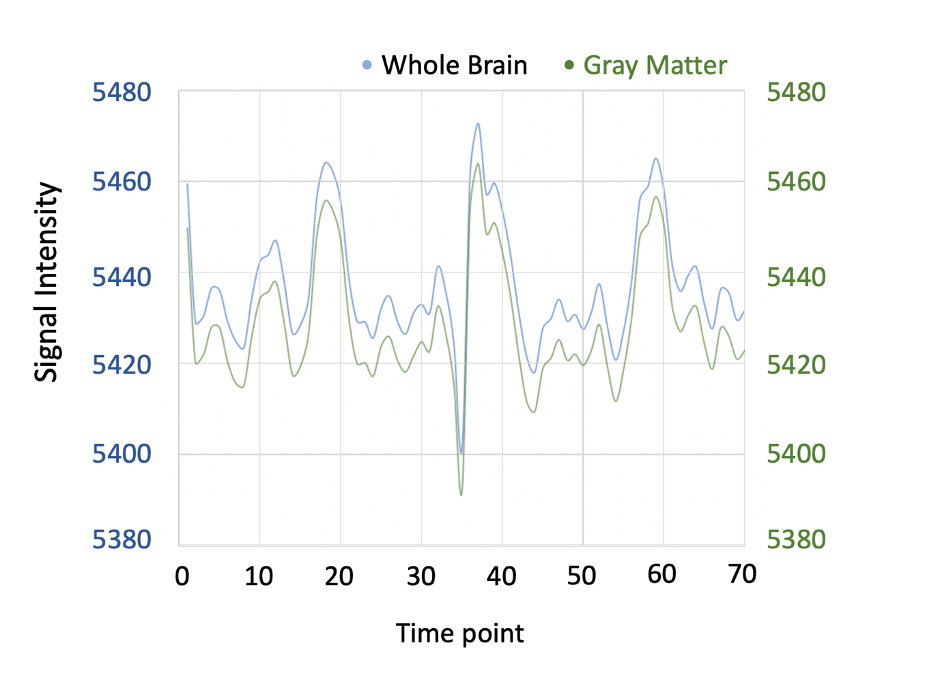
Fig.1 The averaged time course from whole brain(blue) and gray matter(green).
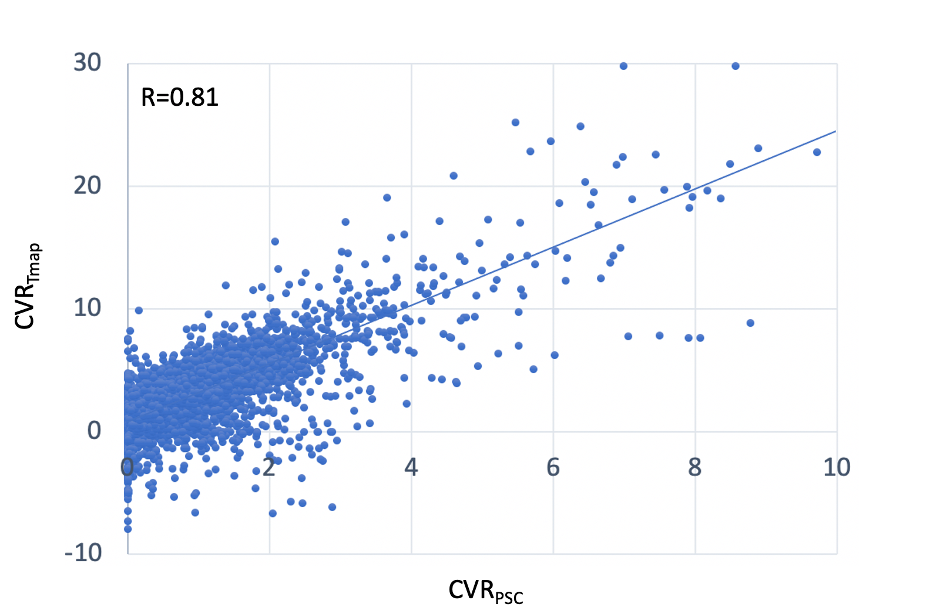
Fig.2 Voxel by voxel scatter plot between the two maps(CVRpsc and CVRTmap )
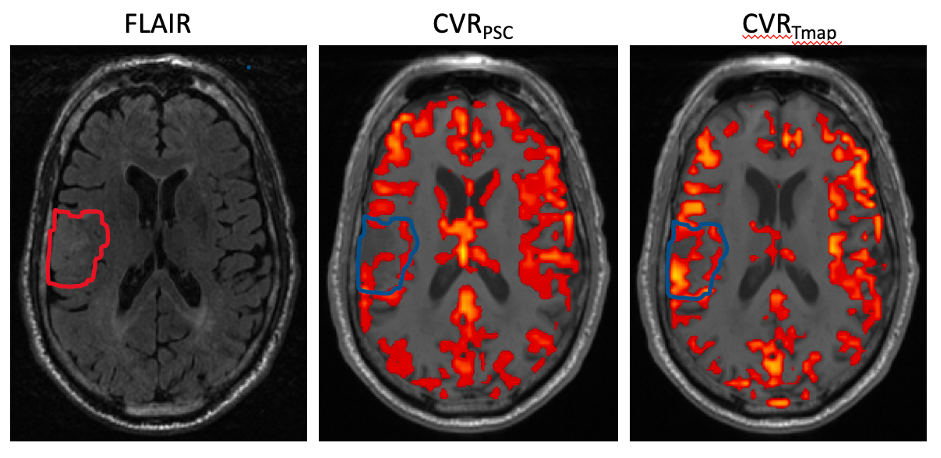
Fig.3 Image example from single patient. Left: FLAIR T2 image, middle: CVR maps from conventional BH, and the threshold was set to 0.35 for blood oxygen level dependent PSC. Right: CVR maps from the proposed method, and the threshold was set to t>3.45.