1521
BOLD-fMRI repetition suppression versus enhancement: assessing habituation to emotional faces through the migraine cycle1Institute for Systems and Robotics - Lisboa and Department of Bioengineering, Instituto Superior Técnico, Universidade de Lisboa, Lisbon, Portugal, 2Neurology Department, Hospital da Luz, Lisbon, Portugal
Synopsis
We investigated habituation in migraine, by measuring repetition effects to emotional faces using BOLD-fMRI, during all phases of the migraine cycle. We first performed simulations to determine the sensitivity of the proposed fMRI paradigm and respective BOLD deconvolution approach to detect repetition effects, and then applied this to real data. Simulations showed that a commonly used deconvolution approach was able to correctly estimate repetition effects provided that response delays did not significantly deviate from default. When applied to real data, we found that controls exhibited the normal repetition suppression, but patients exhibited response maintenance or even potentiation.
Introduction
Migraine is a common neurological disorder of cyclic nature, with intermittent and disabling attacks (ictal phase), characterized by moderate to severe head pain, alternating with pain-free periods (interictal phase). One of the hallmarks of migraine is the hypersensitivity to sensory stimulation due to a lack of habituation to repetitive stimuli1. Its neuronal correlates have been measured using different neuroimaging techniques, but the literature is somehow inconsistent and the underlying mechanisms remain unclear2. In particular, fMRI has been used to measure deficits in BOLD repetition suppression, normally associated with habituation, during the presentation of faces to migraine patients in the interictal phase3. Here, we aim to further investigate habituation in migraine, by employing emotional faces and measuring repetition effects (repetition suppression, RS, reflecting habituation, vs. repetition enhancement, RE, reflecting potentiation) using BOLD-fMRI, during all phases of the migraine cycle. We first perform simulations to determine the sensitivity of the proposed fMRI paradigm and respective BOLD deconvolution approach to detect RS/RE, and then apply this to real data.Methods
Seven female patients with episodic migraine without aura were recruited and studied using fMRI in 4 sessions across the migraine cycle: interictal, preictal, ictal, postictal. BOLD-fMRI data were acquired on a 3T Siemens Vida system with a 64-channel RF-coil (Gradient-echo 2D-EPI, TR/TE=1260/30ms, in-plane GRAPPA-2, SMS-3, 2.2mm isotropic resolution). The paradigm consisted of the presentation of images of emotional faces (angry, happy or neutral), over 9 blocks (~30s each, 3 blocks per emotion, pseudorandomised) with 8 trials each (3s stimulus, ~0.75s ISI, jittered) alternated with fixation blocks (~10s) (total duration~6min). Data were also collected from 2 healthy controls.To detect RS/RE, the BOLD response to the repeated stimuli over one block was deconvolved using the 3dDeconvolve tool from AFNI with an SMPG2 function, which models the BOLD response as a linear combination of the canonical HRF (with delay 6s) with its temporal derivative. The repetition effect was quantified as the percent difference between the amplitude of the response to the 1st stimulus (original) and the 2nd/3rd stimulus (1st/2nd repetition), divided by the largest.
Simulations
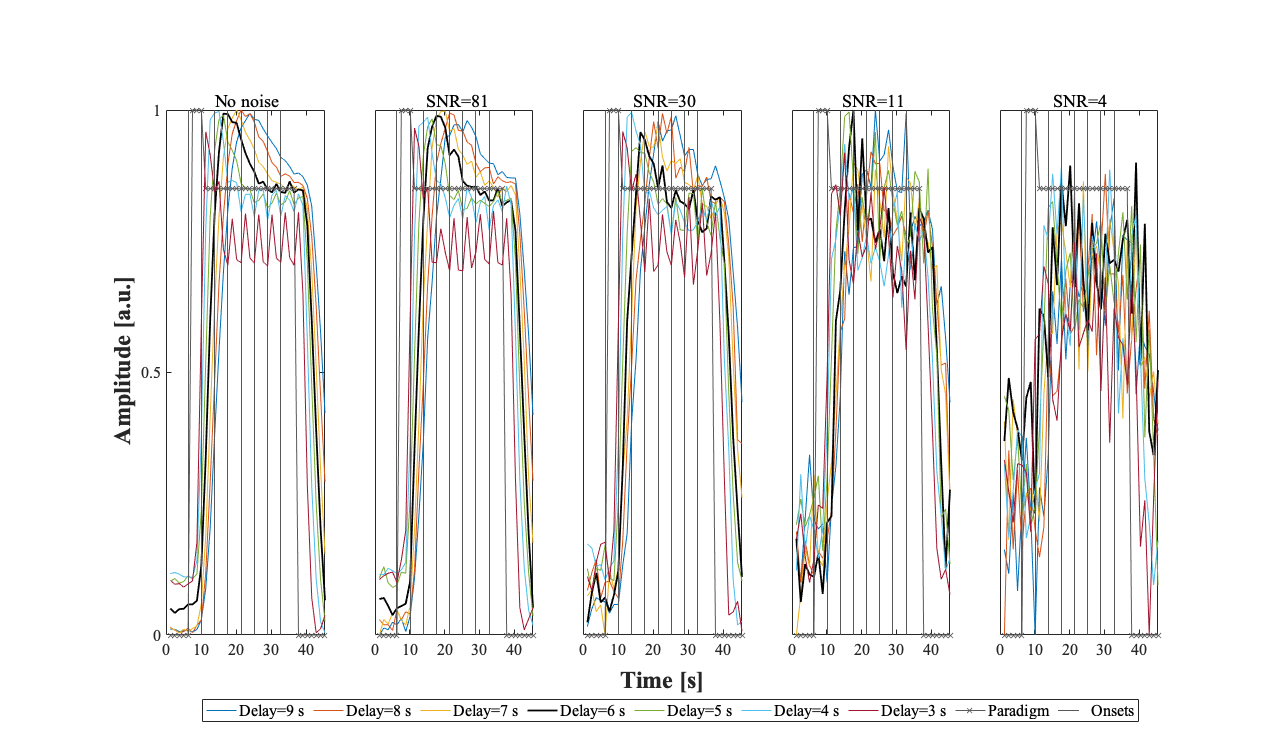
To assess the accuracy and precision of RS and RE estimation using the proposed methodology, the BOLD response to the paradigm was simulated using the canonical HRF, with: HRF delays 3-9s, Gaussian noise yielding SNR values 4-81, and repetition effects of ±15%/±25% (1st/2nd repetition) (Fig.1). In each case, 100 datasets were generated.
Real data
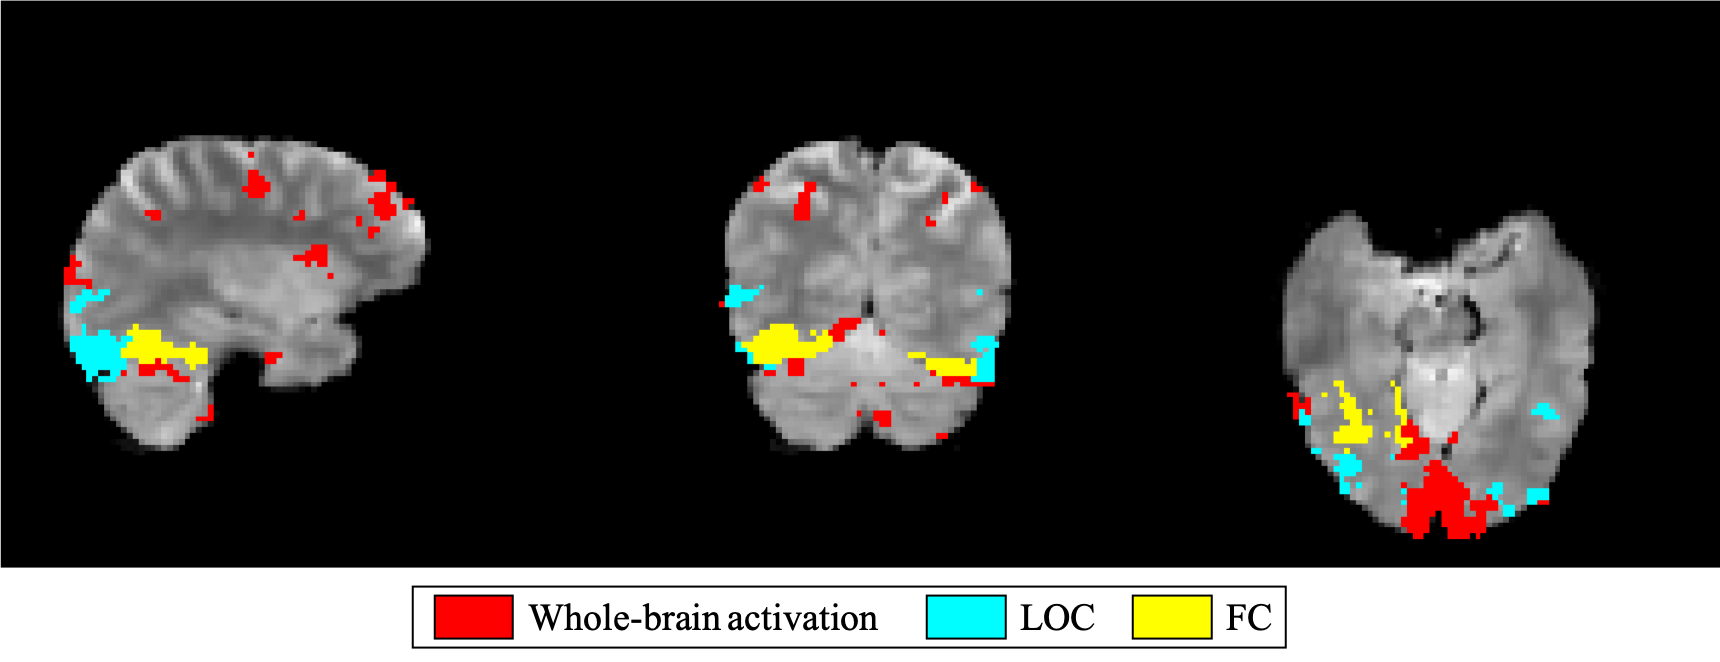
Data preprocessing, using FSL, included motion correction, distortion correction, spatial smoothing (FWHM=3.5mm) and highpass temporal filtering (cutoff=100s). A voxelwise general linear model including the paradigm as well as head motion parameters was fitted to the data, and the BOLD signal was then reconstructed by regressing out head motion contributions. This clean BOLD signal was averaged across 2 ROIs, Lateral Occipital Cortex (LOC) and Fusiform Cortex (FC), defined based on the Harvard-Oxford cortical and subcortical structural atlas. The ROI-averaged BOLD signals were further averaged across the 3 blocks for each emotion. These signals were finally deconvolved and RS/RE quantified.
Results and discussion
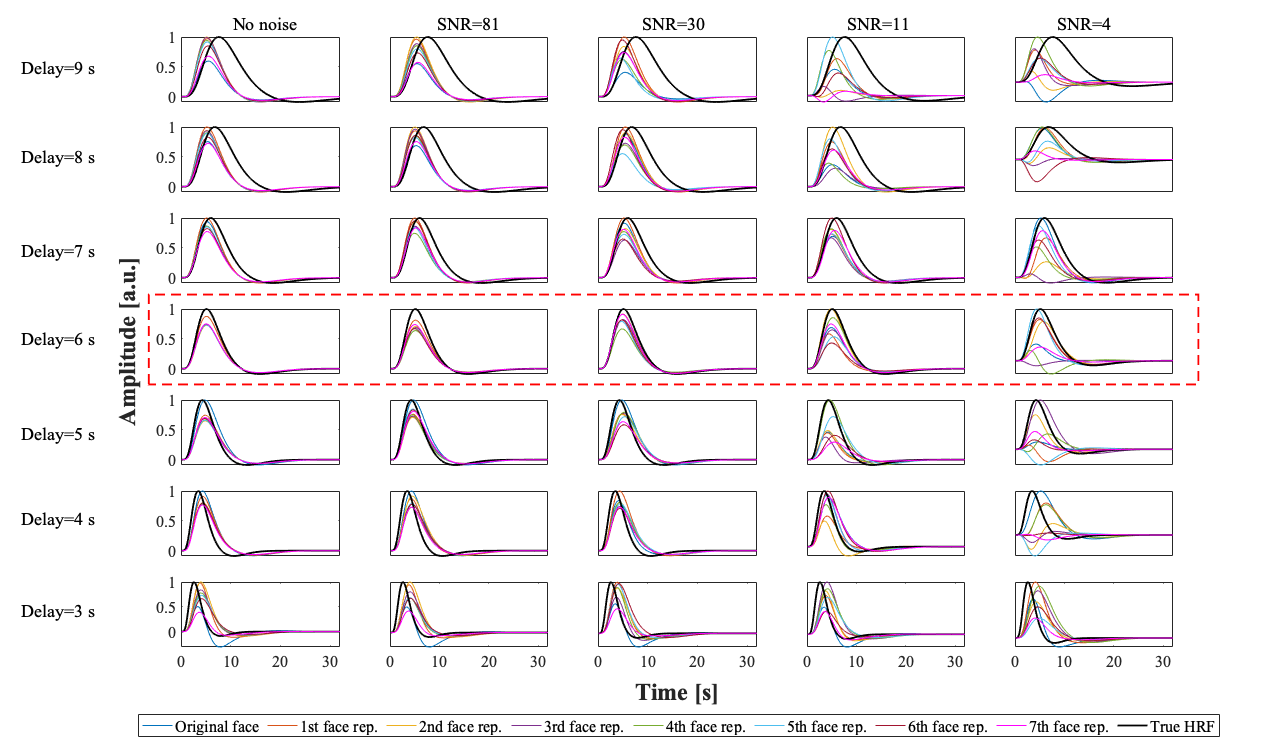
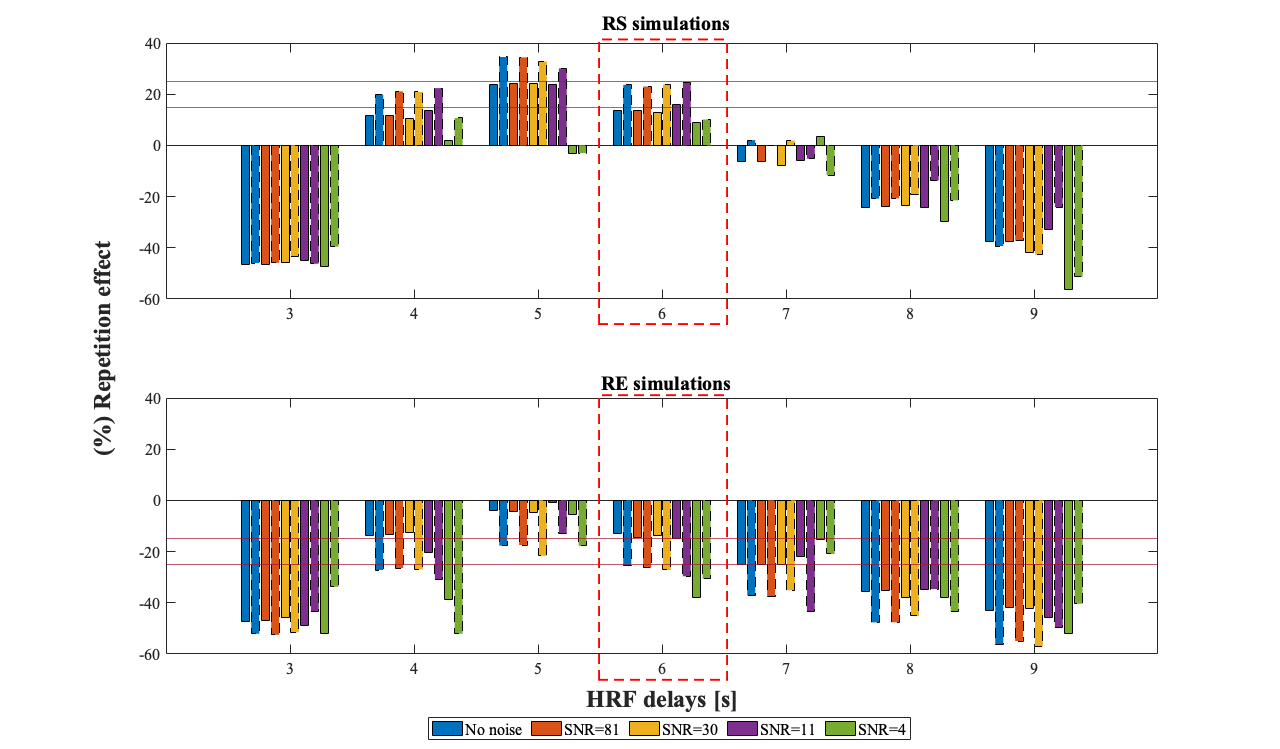
SimulationsThe simulated BOLD signals (Fig.2) clearly show the deterioration of the observable RS effects when the HRF delay is deviated from the default value of 6s, and also with increasing noise levels. Similar deterioration is observed for RE curves. This deterioration is reflected in percent of repetition effect found for both RS and RE (Fig.3). While only relatively small errors are found for delays between 4 and 6s, even for low SNR values, they increase rapidly for other delays, for all SNR values. Critically, for such deviating delays, RS is erroneously estimated as RE, while RE can be overestimated by ~100%. Interestingly, SNR values above 4 did not significantly affect the results.
Real data
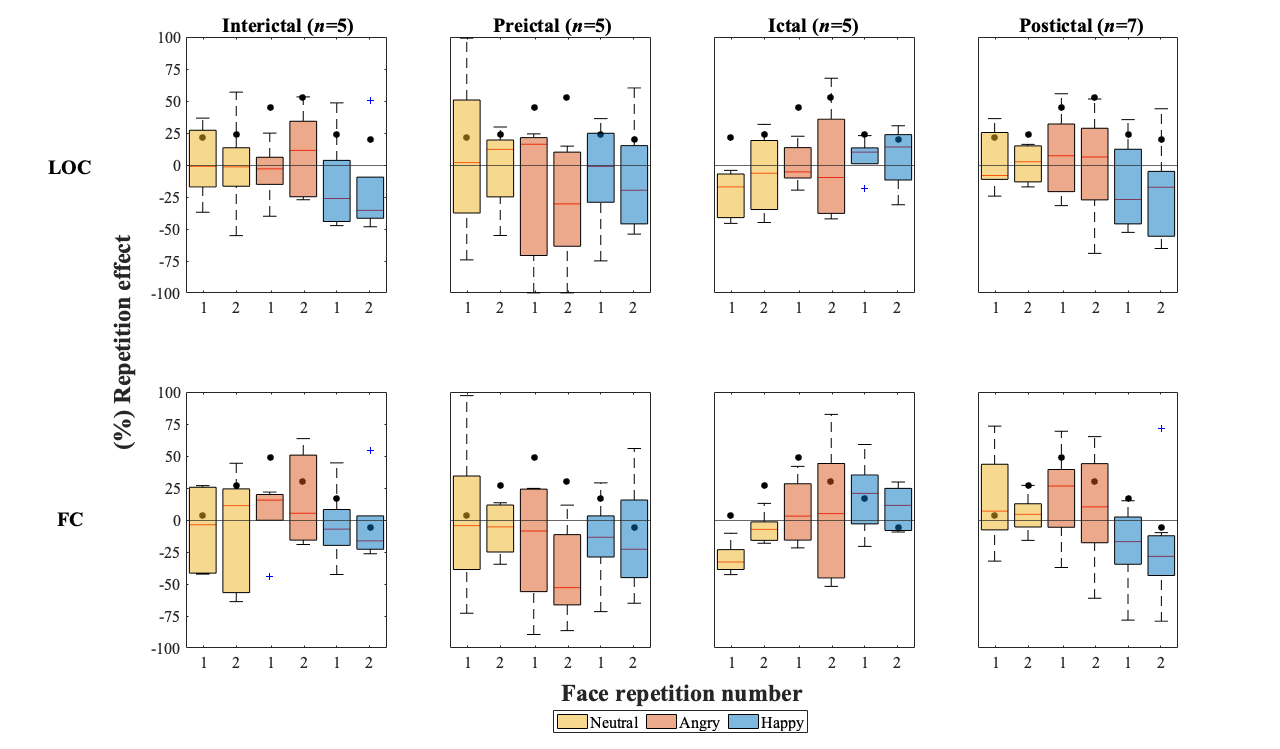
The results obtained from the real data are shown in Figure 4 and 5. The median value of the repetition effects for the controls (Fig.5), indicated by the black circles, show the expected RS in both ROIs, with a larger effect for the angry compared with the neutral and happy emotions. In the patient group, no RS could be detected, and a trend for RE could be observed. This is more evident for happy faces in the interictal and postictal phases. Moreover, patients exhibited larger deviations from normal RS in controls for angry faces in the interictal and preictal phases.
Conclusion
Our simulations showed that a commonly used deconvolution approach was able to correctly estimate RS and RE provided that the real HRF delay did not significantly deviate from the assumed delay of 6s. Nevertheless, for the most commonly observed delays between 4 and 6s4, errors were overall below 14%, indicating the feasibility of detecting RS vs RE effects using the proposed protocol.The application to real data showed RS effects in controls consistently with previous reports5, including a larger effect for angry compared with neutral faces. In contrast, our results in migraineurs suggest response maintenance or potentiation, also in agreement with previous reports6. One novel observation was the finding of a larger deviation from controls for angry faces in the interictal and preictal phases. Future work is required to achieve sufficient statistical power to further compare habituation between different emotions and migraine phases.Acknowledgements
We acknowledge the Portuguese Science Foundation through grants PTDC/EMD-EMD/29675/2017, LISBOA-01-0145-FEDER-029675 and UIDB/50009/2020.References
1. Coppola et al., Neurobiol Learn Nem., 92(2):249-59, 2009.
2. Demarquay et al., J Headache Pain., 56(9):1418–38, 2016.
3. Descamps et al., Cephalalgia, 31(11):1220–31, 2011.
4. Buxton et al., Neuroimage, 23(Suppl 1):S220–33, 2004.
5. Ishai et al., Proc Natl Acad Sci USA, 101(26):9827–32, 2004.
6. Schoenen et al., Eur J Neurol., 2(2):115–22, 1995.
Figures