1520
Rich-club connectivity of the structural covariance network is reduced in mild cognitive impairment and Alzheimer’s disease1Maastricht University Medical Center, Maastricht, Netherlands
Synopsis
A reduced rich-club connectivity of the structural covariance network was found in individuals with MCI and AD compared to controls. Moreover, we show that a loss of connections in the rich-club subnetwork may form a mechanism underlying memory loss in the context of MCI and dementia.
Introduction
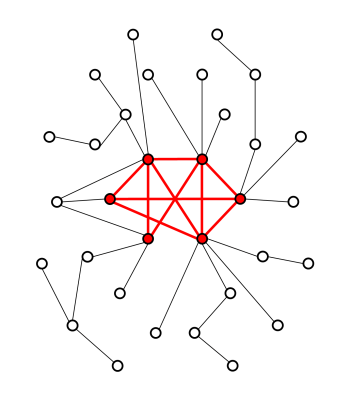
Alzheimer’s disease (AD) is the most common cause of dementia in the elderly. The hallmarks of AD are the accumulation of amyloid-beta plaques, the formation of tau tangles, and neurodegeneration. However, the exact mechanisms of AD and the relation to cognitive decline are not yet completely understood.In this study, the cortical thickness is used to construct individual structural covariance networks (SCNs). Previous studies have already shown the value of SCN analysis in AD research, reporting less structured networks and a suggestive loss of hub nodes [1]. Hubs are nodes in a network that have a high number of connections. In the human brain network, these hubs tend to be interconnected, forming a so called rich-club [2]. A graphical representation of a rich-club is shown in figure 1. The extent of rich-club configuration in a structural network has been associated to cognitive performance in healthy participants [3].
We hypothesized that a reduced rich-club connectivity in the SCN is associated with lower cognitive performance in patients with mild cognitive impairment (MCI) and AD.
Methods
Data acquisitionNinety-nine participants were included in this study, including 40 individuals with MCI (19 females, mean age 69y) [4], 22 with AD (7 females, mean age 71y) [5], and 37 controls (14 females, mean age 72y). All participants underwent neuropsychological assessment. Age-, sex-, and education-corrected z-scores (based on normative data) were computed for the following domains: memory (delayed recall of the 15-word verbal learning task, drVLT), processing speed (letter-digit substitution test, LDST) and executive functioning (concept shifting task, CST). Furthermore, 3D T1-weighted gradient-echo images were acquired for each participant on a 3 Tesla MRI scanner with a 32-channel head coil (Philips, Achieva TX, Best, the Netherlands) with the following parameters: repetition time (TR) 8 ms, echo time (TE) 4 ms, flip angle 8°, and 1 mm cubic voxel size. To calculate the individual SCNs, a healthy reference group is required. Therefore, an additional group of 21 controls (i.e. the reference group) was also included (6 females, mean age 40y). For these participants, T1-weighted 3D fast gradient echo images were acquired with the following parameters: repetition time (TR) 9.91 ms, echo time (TE) 4.6 ms, flip angle 8° and 1 mm cubic voxel size.
Analysis
From the T1-weighted images, the cortical thickness was determined using Freesurfer (version 5.1 [6]). The brain was parcellated into 68 cortical regions using the Desikan-Killiany atlas [7] and the mean cortical thickness was calculated for each region. For each region, the cortical thickness values were corrected for age, sex and mean cortical thickness via multivariable linear regression models. Therefore, the subsequent SNC analyses are not biased by potential group differences in cortical thickness. Subsequently, structural covariance networks (SCN) were obtained by calculating the Pearson’s correlation coefficient between the corrected cortical thicknesses of each region pair. To extract the individual contribution of a participant on the SCN of the reference group, the add-one-participant method was used [8][9], in which the individual contribution of a participant can be assessed by adding one participant to the reference group before calculating the adjacency matrix. Only significantly positive correlations (r > 0 and p < .05) were considered. Furthermore, the networks were made equally sparse to control for the total number of connections (edges). The lowest achievable sparsity is 82%.
Hub nodes were identified as nodes with a degree higher than the average degree plus one standard deviation. To this end, the degree was first averaged over all subjects, obtaining an average degree per node. Subsequently, the interconnectedness of hub nodes was determined using the weighted rich-club coefficient; $$$RCC = \frac{2*E_{hubs}}{N_{hubs}(N_{hubs}-1)}$$$, where $$$E_{hubs}$$$ is the total connectivity strength between hubs and $$$N_{hubs}$$$ is the number of hubs [2].
Statistics
A one-way ANOVA test is performed to assess group differences in the RCC. Subsequently, a linear regression model is used to relate the RCC to the neuropsychological z-scores, correcting for diagnostic group using a dummy variable (control = 0; cognitively impaired = 1).
Results
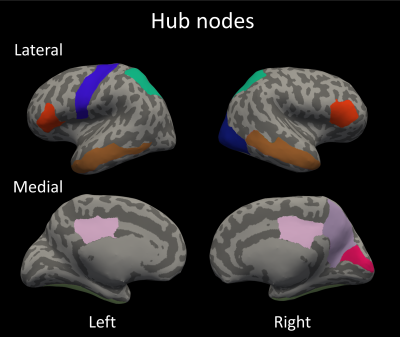
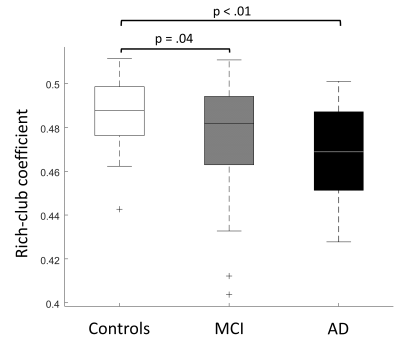
The hub nodes that form the rich-club are shown in Figure 2. The one-way ANOVA showed that the RCC is a significantly different between groups (p<.01), post-hoc t-tests revealed that the RCC was significantly lower in patients with MCI and AD compared to controls (Figure 3). Moreover, using the linear regression model the RCC was found to be positively related to memory performance (p < .05) while no significant associations were found for executive function (p > .10) and processing speed (p > .10) (Figure 4).Discussion & Conclusion
A reduced rich-club connectivity of the structural covariance network was found in individuals with MCI and AD compared to controls. Previously, a lower degree in fronto-temporal regions of the SCN was associated with memory loss [10]. Here, we show that specifically a loss of degree in the rich-club subnetwork may form a mechanism underlying memory loss in the context of MCI and dementia.Acknowledgements
No acknowledgement found.References
[1] Tijms, B.M., Möller, C., Vrenken, H., Wink, A.M., de Haan, W., van der Flier, W.M., Stam, C.J., Scheltens, P., Barkhof, F, 2013. Single-subject grey matter graphs in Alzheimer's disease. PloS one; 8, e58921.
[2] van den Heuvel, M.P., Sprons, O., 2011. Rich-club organization of the human connectome. J Neurosci, 31(44), 15775-86
[3] Baggio H.C., Segura B., Junque C., de Reus M.A., Sala-Llonch R., Van den Heuvel M.P., 2015. Rich club organization and cognitive performance in healthy older participants. J Cogn Neurosci, 27, 1801–10.
[4] Petersen, R.C. Mild cognitive impairment as a diagnostic entity, 2004. J. Intern. Med. 256, 183e194.
[5] McKhann, G.M., Knopman, D.S., Chertkow, H., Hyman, B.T., Jack Jr., C.R., Kawas, C.H., Klunk, W.E., Koroshetz, W.J., Manly, J.J., Mayeux, R., Mohs, R.C., Morris, J.C., Rossor, M.N., Scheltens, P., Carrillo, M.C., Thies, B., Weintraub, S., Phelps, C.H, 2011. The diagnosis of dementia due to Alzheimer's disease: recommendations from the National Institute on Aging-Alzheimer's Association workgroups on diagnostic guidelines for Alzheimer's disease. Alzheimers Dement. 7, 263e269.
[6] Fischl, B., Dale, A.M, 2000. Measuring the thickness of the human cerebral cortex from magnetic resonance images. Proc. Natl. Acad. Sci. U. S. A. 97:11050–11055.
[7] Desikan, R.S., Ségonne, F., Fischl, B., Quinn, B.T., Dickerson, B.C., Blacker, D., Buckner, R.L., Dale, A.M., Maguire, R.P., Hyman, B.T., Albert, M.S., Killiany, R.J., 2006. An automated labeling system for subdividing the human cerebral cortex on MRI scans into gyral based regions of interest. NeuroImage 31, 968–980.
[8] Saggar, M., Hosseini, S.M.H., Bruno, J.L., Quintin, E.-M., Raman, M.M., Kesler, S.R., Reiss, A.L., 2015. Estimating individual contribution from group-based structural correlation networks. NeuroImage 120, 274–284.
[9] Drenthen G.S., Backes W.H., Rouhl R.P.W., Vlooswijk M.C.G., Majoie M.H.J.M., Hofman P.A.M., Aldenkamp A.P., Jansen J.F.A., 2018. Structural covariance networks relate to the severity of epilepsy with focal-onset seizures. Neuroimage: Clinical 20, 861-867.
[10] Dicks E, Tijms BM, Ten Kate M, Gouw AA, Benedictus MR, Teunissen CE, Barkhof F, Scheltens P, van der Flier WM., 2018. Grey matter network measures are associated with cognitive decline in mild cognitive impairment. Neurobiol Aging 61, 198-206.
Figures


