1519
Network evolution of patients with Alzheimer via graph theory1Radiology Department, University of Wisconsin Madison, Madison, WI, United States, 2Electrical and computer Engineering, University of Wisconsin Madison, Madison, WI, United States, 3Department of Medicine, University of Wisconsin Madison, Madison, WI, United States, 4Department of Biophysics, University of Wisconsin Madison, Madison, WI, United States, 5Neuroscience Training program, University of Wisconsin Madison, Madison, WI, United States, 6Medical Scientist Training Program, University of Wisconsin Madison, Madison, WI, United States
Synopsis
This abstract presents an evaluation of alteration in the functional brain network of patients with Alzheimer’s disease (AD) with a focus on the application of graph theory as a pure data-driven analysis approach. The main goal in this work is to diagnose any potential biomarker of Alzheimer’s disease in the brain connectivity network of patients.
Objective
Alzheimer’s disease (AD) is the most common type of dementia (60–80% of cases) among older people [1]. AD is difficult to diagnose, especially in early onset stages, and cannot be confirmed until post mortem [2]. This has sparked an effort to find biomarkers that can be used to diagnose AD as early as possible. Graph theory provides a systematic method to investigate abnormalities in the brain functional architecture and for characterizing any possible underlying subnetwork in patients, which may be used as a biomarker of the disease. We investigated topological changes in large-scale functional brain networks in patients with Alzheimer's disease (AD) using graph theoretical analysis on resting-state functional magnetic resonance images (r-s fMRI).Methods
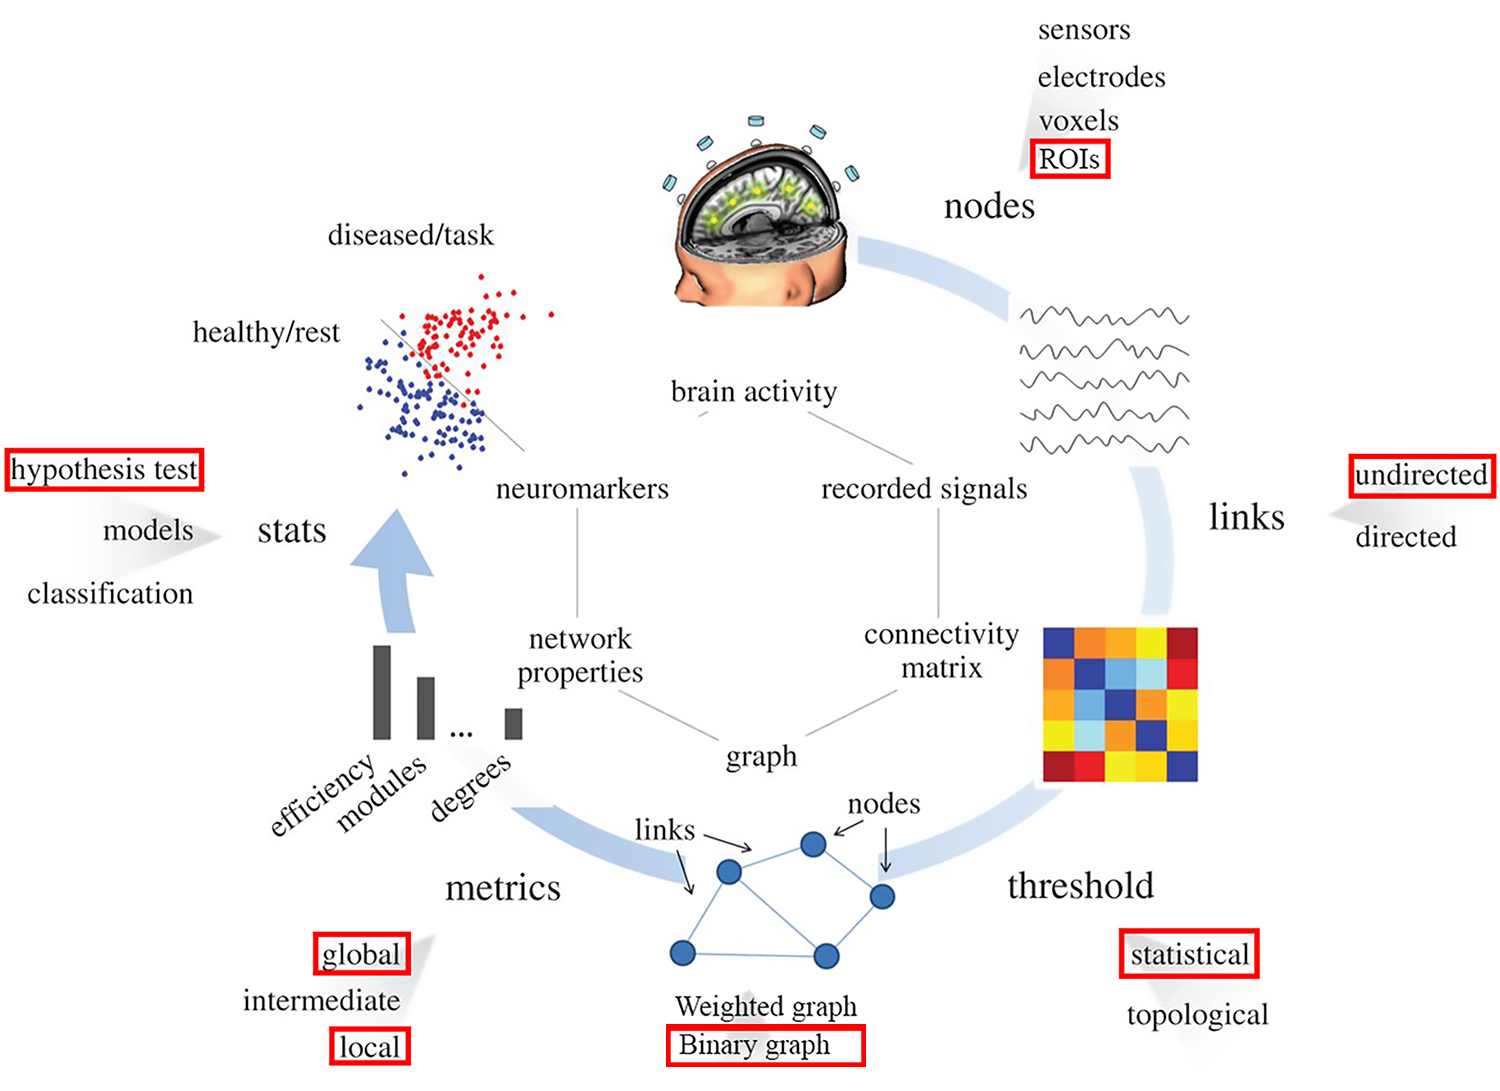
Seventy-three patients with AD or patients who had mild cognitive impairment (MCI) (age 72.20±8.39 years, 35 females, 16.00±2.38 years education, 67 right-handed) were combined into one group as AD&MCI and compared with sixty age, gender, and education -matched healthy controls (HC) (age 70.28±6.07 years, 40 females, 16.47±1.98 years education, 58 right-handed) were analyzed in this study. Data for this study were selected based on availability of resting-state fMRI datasets for age-matched healthy normal subjects and AD&MCI. The AD&MCI group and the normal subjects (who were non-depressed, non-MCI, and non-demented) were recruited at the University of Wisconsin Madison and Medical College of Wisconsin. Eyes-closed resting-state fMRI scans were collected along with high resolution T1 weighted anatomical scans on 3T GE MRI scanners. 379 regions of interest (ROIs) based on the multi-modal cortical and subcortical in-vivo parcellation HCP MMP 1.0 (Glasser parcellation [3]) were used on patients’ r-s fMRIs to obtain the whole-brain network. At the whole-network level, network properties, including clustering coefficient (CC), the shortest path length (SPL) and global efficiency (GE) were examined. The betweenness centrality (BC) as a hubness measurement at the individual ROI level were also estimated and compared across our experimental groups. For the global properties of the network, group comparisons were done on a range of network sparsities from 2% to 50% with 2% gap (similar to work in [4]). Local properties of the network were evaluated at the network sparsity of 5% where all the existing connections in each patient’s graph was significant (at α = 0.05). Demographic measurements differences were evaluated either using two sample t-test (for continuous measurements), or Chi-squared test (in the case of categorical variables). All graph metric differences between two groups were assessed using non-parametric permutation test with 20,000 permutation per tests. The local metric results were adjusted for multiple comparison using false discovery rate (FDR) [5]. The whole process of the method is depicted in Figure 1.Results
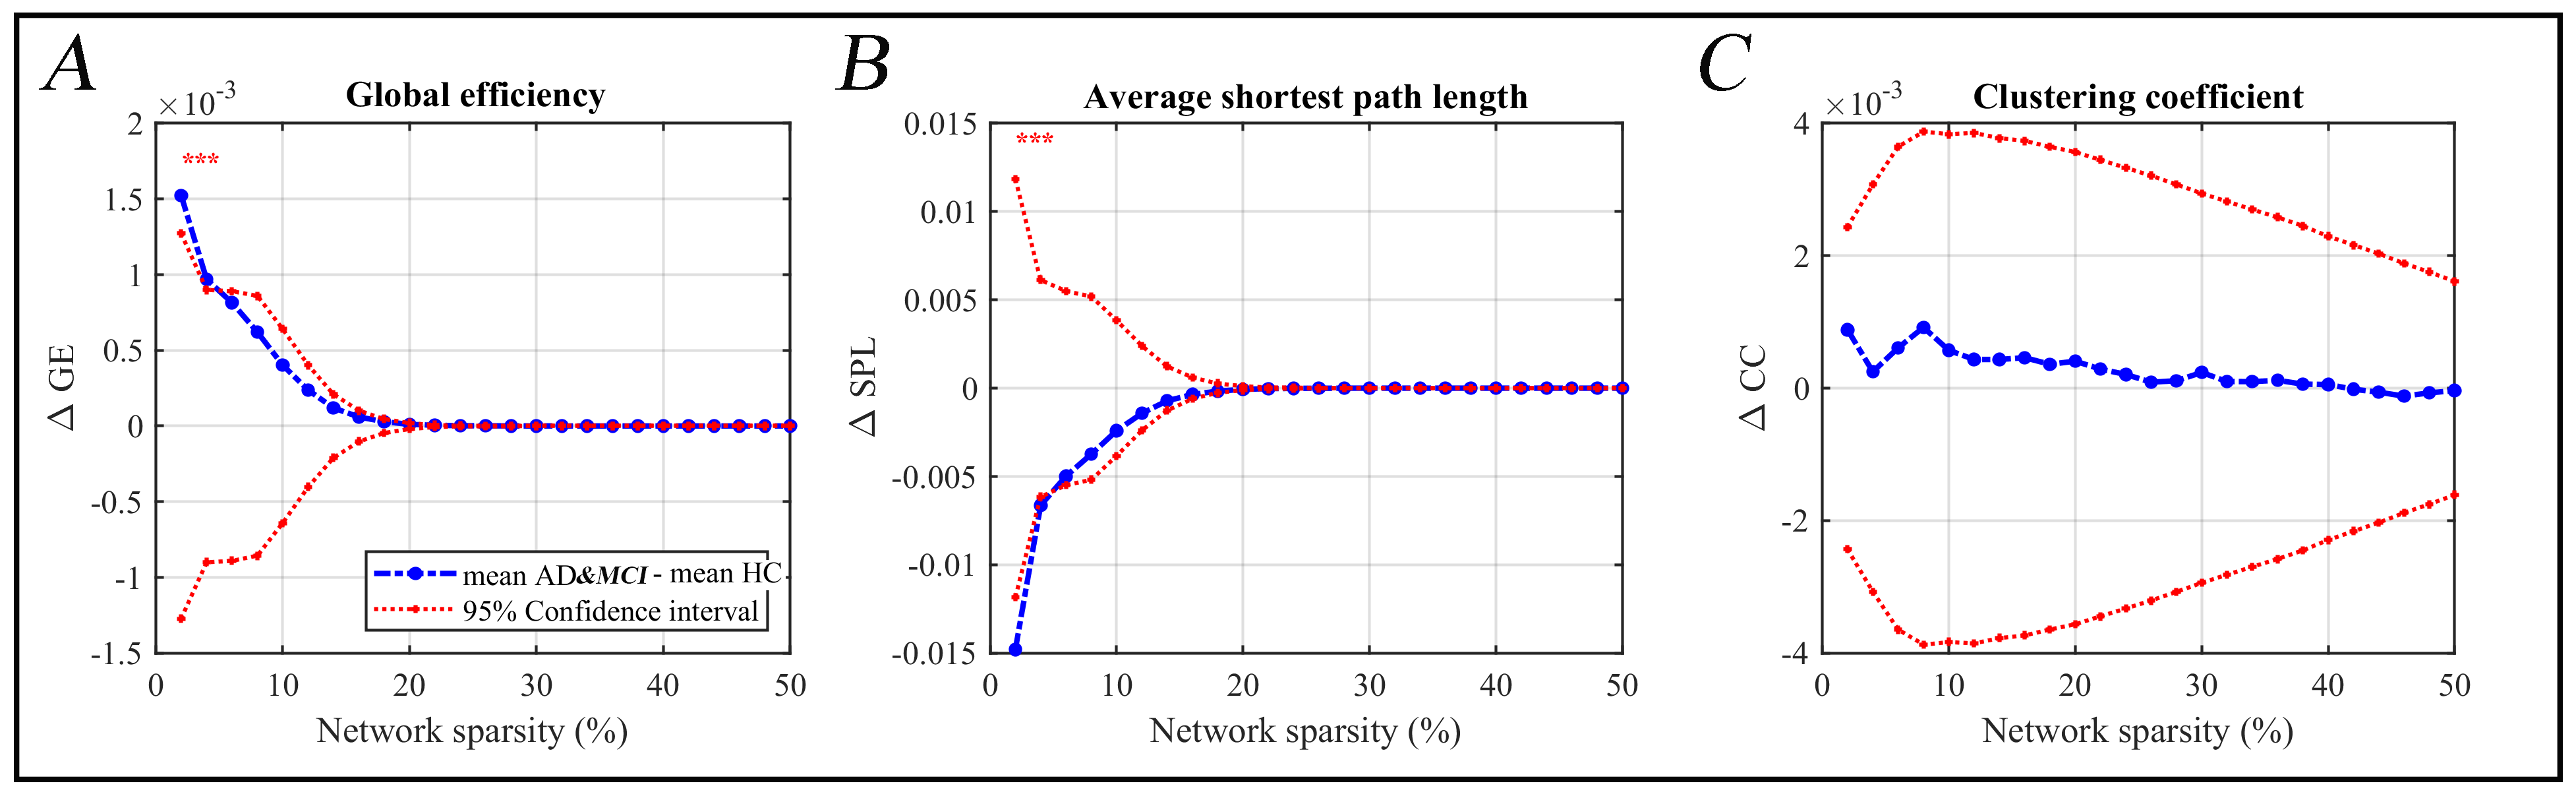
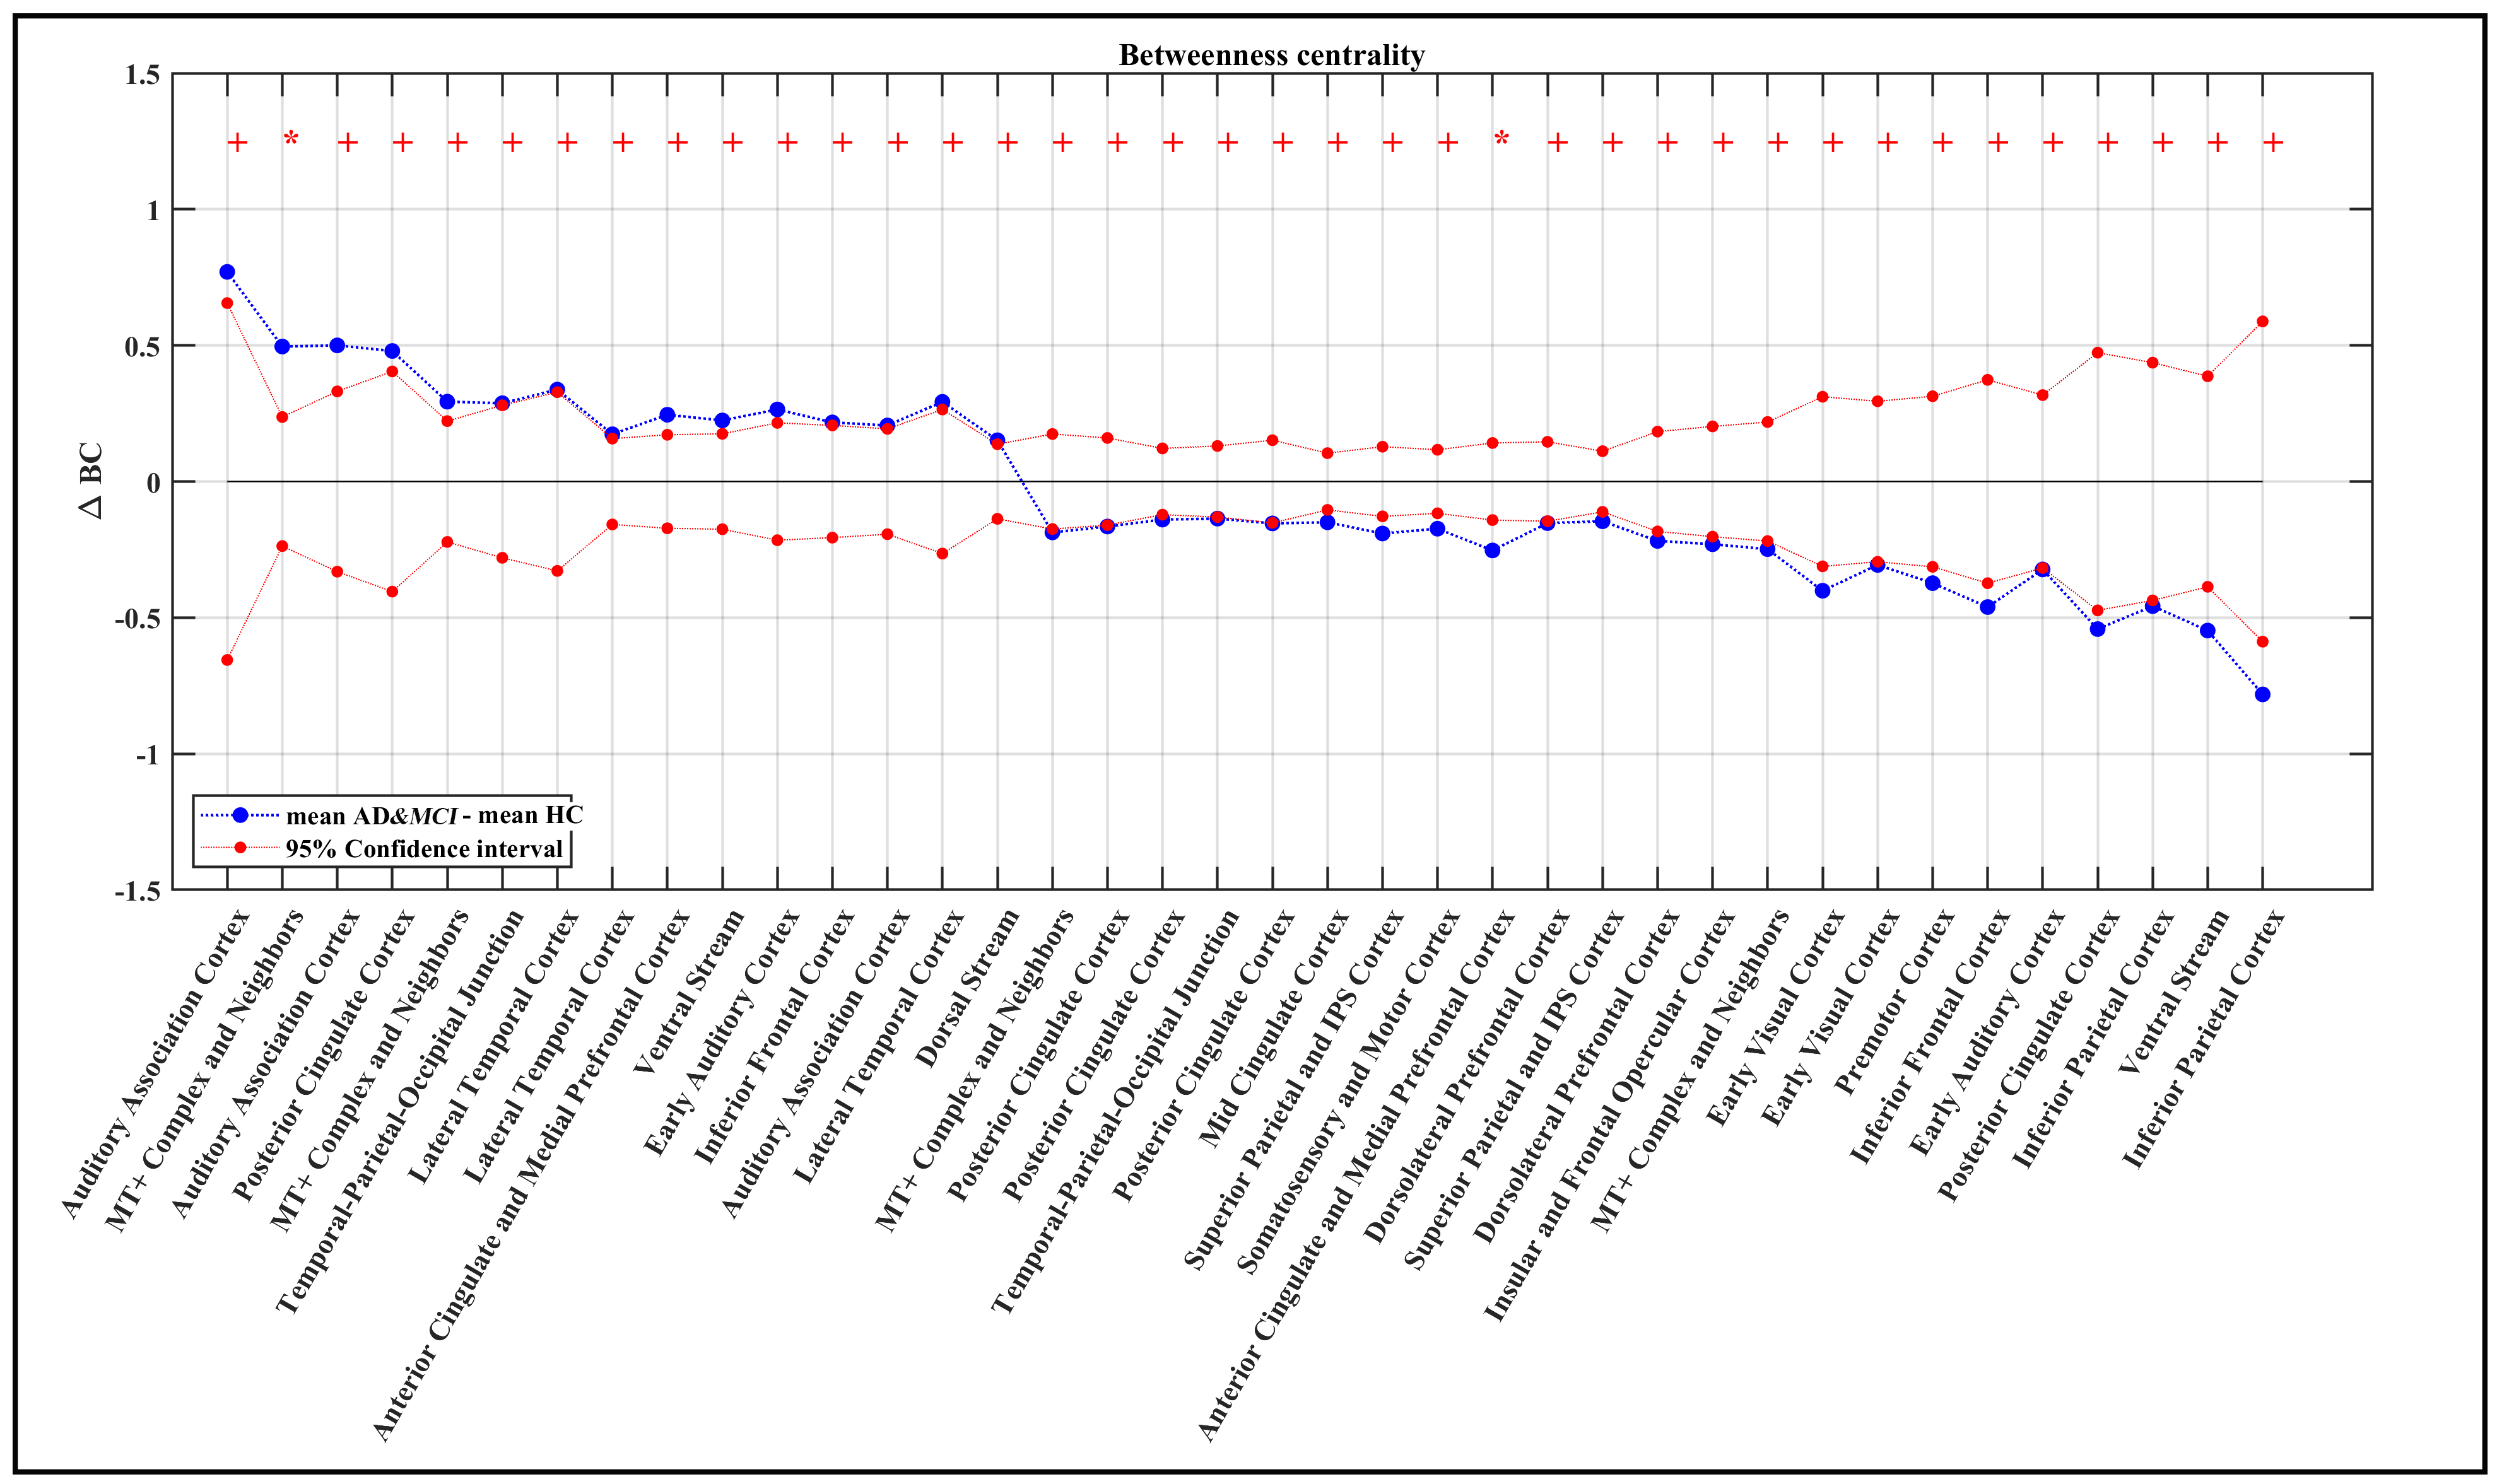
At the whole-network level, the global efficiency was higher in AD&MCI group only in few small thresholds and SPL of AD&MCI was also significantly lower in those same thresholds (Figure 2). Overall, there were no notable changes in the global properties of two groups. As for centrality measurement, there were total of 15 ROIs in which two groups either significantly differed (i.e. adjusted p-value less than or equal to 0.05) or trended towards significant difference (i.e. adjusted p-value less than 0.1) from each other (Figure 3). From these ROIs most Glasser regions differed between two groups evenly (i.e., the number of ROIs associated to that Glasser regions in which AD&MCI was higher were equal to the number of same associated regions in which HC was significantly higher). However, BC of AD&MCI was either significantly or trended significantly lower in posterior and mid cingulate (in the total of 4 ROIs), Superior and inferior parietal cortex (in the total of 4 ROIs), dorsal prefrontal cortex (2 ROIs), insular and frontal opercular cortex (1 ROI), early visual cortex (2 ROIs), somatosensory and motor cortex (1 ROI), premotor cortex (1 ROI). On the other hand, BC of AD&MCI was either significantly or trended significantly higher in auditory association cortex (3 ROIs), lateral temporal cortex (3 ROIs), and dorsal stream (1 ROI).Conclusion
In general, the study suggests the global structure of AD&MCI subjects remain stable. At the local level however, there is a decay in the local importance of nodes all across the brain. This is consistent with other studies concluding that local connectivity in AD&MCI decreases and global connectivity remains stable [6]. An interesting secondary finding is that AD&MCI patients gain BCs in temporal, auditory association, and dorsal stream. These results might suggest a possible reorganization in the brain of AD&MCI group at the connectivity level which has been reported previously [7]. The occurrence of major local deficits in the structure of the brain with stable global structure at the same time is explainable with this reorganization.Clinical Relevance
This work points towards quantifying the amount of network decay as a possible clinical biomarker to distinguish AD from healthy subjects.Acknowledgements
The authors would like to thank all the study subjects and their families for participating in the study, and all the MR technologists for their support in collection of the data.References
1. Reitz C, Brayne C, Mayeux R. Epidemiology of Alzheimer disease. Nat Rev Neurol 2011;7:137–52.
2. McKhann G, Drachman D, Folstein M, Katzman R, Price D, Stadlan EM. 1984. Clinical diagnosis of Alzheimer’s disease: report of the NINCDS-ADRDA Work Group under the auspices of Department of Health and Human ServicesTask Force on Alzheimer’s Disease. Neurology 34:939–44.
3. Glasser, M. F., Coalson, T. S., Robinson, E. C., Hacker, C. D., Harwell, J., Yacoub, E., et al. (2016). A multi-modal parcellation of human cerebral cortex. Nature. http://doi.org/10.1038/nature18933
4. Alexander-Bloch, A. F., N. Gogtay, D. Meunier, R. Birn, L. Clasen, F. Lalonde, R. Lenroot, J. Giedd and E. T. Bullmore. 2010. Disrupted modularity and local connectivity of brain functional networks in childhood-onset schizophrenia. Front Syst Neurosci 4: 147.
5. Benjamini, Y. and Y. Hochberg. 1995. Controlling the False Discovery Rate: A Practical and Powerful Approach to Multiple Testing. Journal of the Royal Statistical Society. Series B (Methodological) 57: 289-300.
6. Brier MR, Thomas JB, Fagan AM, Hassenstab J, Holtzman DM, Benzinger TL, and others. 2014. Functional connectivity and graph theory in preclinical Alzheimer’s disease. Neurobiol Aging 35:757–68.
7. Dillen KN, Jacobs HI, Kukolja J, von Reutern B, Richter N, Onur OA, and others. 2016. Aberrant functional connectivity differentiates retrosplenial cortex from posterior cingulate cortex in prodromal Alzheimer’s disease. Neurobiol Aging 44:114–26. 8. de Vico Fallani, Fabrizio, et al. "Graph analysis of functional brain networks: practical issues in translational neuroscience." Philosophical Transactions of the Royal Society B: Biological Sciences 369.1653 (2014): 20130521.
Figures