1517
Machine learning classifiers on resting-state cerebrovascular reactivity in preclinical Alzheimer's disease
Kaio Felippe Secchinato1, Pedro Henrique Rodrigues da Silva1, Júlia Palaretti1, and Renata Ferranti Leoni1
1Departamento de Física, University of São Paulo, Ribeirão Preto, Brazil
1Departamento de Física, University of São Paulo, Ribeirão Preto, Brazil
Synopsis
Early detection of Alzheimer's disease (AD) increases the treatment benefits. However, it is still a challenging question which biomarkers are useful for early diagnosis. Then, we aimed to classify cognitively normal elderly regarding the possibility to develop AD based on resting-state cerebral vasoreactivity (CVR) values and neuropsychological (NP) scores. We used supervised machine learning algorithms. Our results suggest that Random Forest and K-Nearest Neighbors classifiers trained with CVR values of the vermis.7 (part of the cerebellum), and left parahippocampal gyrus, and Mini-Mental State Examination (MMSE), and Trail Making Test A scores can be useful on the early detection of AD.
Introduction
The fact that AD starts 15 to 20 years before showing cognitive decline contributes to the difficulty of Alzheimer's disease (AD) treatment1. There is still no pharmacological treatment that slows or stops the disease progression2. Therefore, AD early detection and diagnosis are essential. Alterations in cerebral perfusion have been considered a promising early biomarker for AD since they are observed before the clinical symptoms3. Cerebrovascular reactivity (CVR)4 may provide additional information. CVR measures cerebral blood flow (CBF) increase after a vasodilator stimulus. Recently, the feasibility of mapping CVR using resting-state functional magnetic resonance imaging (rs-fMRI, rs-CVR), without vasodilator stimuli, has been shown5–7. Therefore, we aimed to investigate CVR alterations in AD using machine learning. We hypothesized that regional CVR could be used for the classification of the elderly who will develop AD.Material and Methods
MRI data of 54 cognitively normal subjects (CDR=0) was obtained from the publicly available Open Access Series of Imaging Studies (OASIS3)8. Clinical Dementia Rating9 (CDR) scale was used to define the groups: twenty-seven subjects who progressed to AD (CDR=1) after MRI acquisition (age: 79.9±6.4 years, 13 males), and twenty-seven subjects who remained stable (age: 79.7±6.0 years, 13 males). Scans were obtained on BioGraph mMR PET-MR 3T by the Knight Alzheimer Research Imaging Program. T1-weighted images and rs-fMRI were used. During the 6-minute rs-fMRI acquisition, participants were asked to lay quietly, eyes open. RS-CVR index was quantified for the AAL template10 following the previously published procedure5,6 and compared using t-test (p<0.05, corrected for multiple comparisons). Neuropsychological (NP) scores of the Mini-Mental State Examination (MMSE), Digit Span, Category Verbal Fluency (Animals and Vegetables), Trail Making Tests (TRAIL-A and TRAIL-B), Logical Memory - Story A, WAIS and Boston were also considered. We performed a feature selection using the Boruta method11 with Boruta package12 for R Software13 to reduce input dimensionality and avoid redundant features to the predictive model. The collinearity between the selected features was also assessed using Spearman's correlation14. We considered the following input parameters: NP measures, CVR measures, and mixed measures (NP+CVR). Seven classifiers were trained and tested on the selected features with R language (3.3.2) using caret15: Random Forest (RF)16, Linear and Radial Support Vector Machine (SVM)17, Naïve Bayes (NB)18, K-nearest neighbor (kNN)19 and an Artificial Neural Network (ANN)20. Data were divided into sets for training (70%) and testing (30%) using a 5-fold cross-validation method21. Receiver Operating Characteristic (ROC) was used to select the optimal model using the highest value, except for the RF algorithm. Results were analyzed using confusion matrix indicators to assess the classifier's performance.Results
Figure 1 shows the average CVR maps of both groups. No regional CVR difference was observed between groups. Groups presented significant differences in MMSE (p = 0.028), and verbal fluency – category vegetables (p = 0.022), and a trend for TRAIL-A (p = 0.091).Boruta method provided MMSE and TRAIL-A scores for NP measures only, and CVR values of Vermis.7 and right Cerebelum.4.5 for CVR measures only. When considering NP and CVR measures, MMSE and TRAIL-A scores, and CVR values of Vermis.7 and left ParaHippocampal gyrus were selected.
Figure 2 shows the performance of the classifiers using the training set. Figure 3 shows the performance of the classifiers using the testing set.
Discussion
The classification approach with mixed measures (NP and CVR) achieved the best performance. MRI measurements involving the vermis (part of the cerebellum)13–16 and parahippocampal gyrus26,27 were selected by the Boruta algorithm and have been related to AD disease, although no study cited used CVR as a measure. The cerebellum has been associated with verbal fluency28,29, which was the most affected NP score in our study, although Boruta did not select it. In previous studies, TRAIL-A had the best performance separating those who declined at an average or faster rate from those who showed slower progression30, while MMSE failed as a stand-alone single-administration test for the identification of patients with mild cognitive decline who could develop dementia31. Considering the rs-CVR and NP scores, Linear SVM was the less accurate approach, suggesting that our data is nonlinear. The improved result obtained with nonlinear Radial SVM confirms this supposition. The best AUC was obtained by the RF approach, based on lots of trees that can ensure high accuracy. Similar performance was achieved by the KNN, which is also considered as a weighted-neighborhoods scheme32.Conclusion
Our results suggest that rs- CVR and NP scores can be used with RF and KNN classifiers in early AD detection.Acknowledgements
Data were provided by OASIS-3: Principal Investigators: T. Benzinger. D. Marcus. J. Morris; NIH P50AG00561. P30NS09857781. P01AG026276. P01AG003991. R01AG043434. UL1TR000448. R01EB009352.References
1. Hippius, H. & Neundörfer, G. The discovery of Alzheimer's disease. Dialogues Clin. Neurosci. (2003) doi:10.31887/dcns.2003.5.1/hhippius. 2. Dubois, B. et al. Preclinical Alzheimer's disease: Definition, natural history, and diagnostic criteria. Alzheimer’s and Dementia (2016) doi:10.1016/j.jalz.2016.02.002. 3. Chen, J. J. Cerebrovascular-reactivity mapping using MRI: Considerations for Alzheimer's disease. Frontiers in Aging Neuroscience (2018) doi:10.3389/fnagi.2018.00170. 4. Liu, P., Vis, J. B. De & Lu, H. NeuroImage Cerebrovascular reactivity ( CVR ) MRI with CO2 challenge : A technical review. Neuroimage 1–12 (2018) doi:10.1016/j.neuroimage.2018.03.047. 5. Liu, P. et al. Cerebrovascular reactivity mapping without gas challenges. Neuroimage (2017) doi:10.1016/j.neuroimage.2016.11.054. 6. Secchinato, K. F., Da Silva, P. H. R., Camargo, A. P. A., Pontes-Neto, O. M. & Leoni, R. F. Cerebrovascular reactivity mapping without hypercapnic challenge in patients with carotid artery stenosis. Rev. Bras. Física Médica (2019) doi:10.29384/rbfm.2019.v13.n2.p62-65. 7. Taneja, K. et al. Evaluation of cerebrovascular reserve in patients with cerebrovascular diseases using resting-state MRI: A feasibility study. Magn. Reson. Imaging (2019) doi:10.1016/j.mri.2019.03.003. 8. LaMontagne, P. J. et al. IC-P-164: OASIS-3: LONGITUDINAL NEUROIMAGING, CLINICAL, AND COGNITIVE DATASET FOR NORMAL AGING AND ALZHEIMER'S DISEASE. Alzheimer's Dement. (2018) doi:10.1016/j.jalz.2018.06.2231. 9. Berg, L. Clinical Dementia Rating (CDR). Psychopharmacol. Bull. (1988). 10. Mutsaerts, H. J. M. M. et al. Cerebral perfusion measurements in elderly with hypertension using arterial spin labeling. PLoS One 10, 1–13 (2015). 11. Kursa, M. B., Jankowski, A. & Rudnicki, W. R. Boruta - A system for feature selection. Fundam. Informaticae (2010) doi:10.3233/FI-2010-288. 12. Kursa, M. B. & Rudnicki, W. R. Feature selection with the boruta package. J. Stat. Softw. (2010) doi:10.18637/jss.v036.i11. 13. R Core Team. R: A Language and Environment for Statistical Computing. (2019). 14. Zar, J. H. Spearman Rank Correlation. in Encyclopedia of Biostatistics (2005). doi:10.1002/0470011815.b2a15150. 15. Kuhn, M. & Contributions from Jed Wing, Steve Weston, Andre Williams, Chris Keefer, Allan Engelhardt, Tony Cooper, Zachary Mayer, Brenton Kenkel, the R Core Team, Michael Benesty, Reynald Lescarbeau, Andrew Ziem, Luca Scrucca, Yuan Tang, Can Candan, and T. H. caret: Classification and Regression Training. R Packag. version 6.0-79 (2018). 16. Breiman, L. Random forests. Mach. Learn. (2001) doi:10.1023/A:1010933404324. 17. Cortes, C. & Vapnik, V. Support-Vector Networks. Mach. Learn. (1995) doi:10.1023/A:1022627411411. 18. Set, A. Naive Bayes Classifiers. homepages.inf.ed.ac.uk (2009). 19. Peterson, L. K-nearest neighbor. Scholarpedia (2009) doi:10.4249/scholarpedia.1883. 20. Dayhoff, J. E. & DeLeo, J. M. Artificial neural networks: Opening the black box. in Cancer (2001). doi:10.1002/1097-0142(20010415)91:8+<1615::aid-cncr1175>3.0.co;2-l. 21. Refaeilzadeh, P., Tang, L. & Liu, H. Cross-Validation. in Encyclopedia of Database Systems (2009). doi:10.1007/978-0-387-39940-9_565. 22. Toniolo, S. et al. Patterns of cerebellar gray matter atrophy across Alzheimer's disease progression. Front. Cell. Neurosci. (2018) doi:10.3389/fncel.2018.00430. 23. Mitelpunkt, A. et al. Novel Alzheimer's disease subtypes identified using a data and knowledge driven strategy. Sci. Rep. (2020) doi:10.1038/s41598-020-57785-2. 24. Baldaçara, L. et al. Relationship between structural abnormalities in the cerebellum and dementia, posttraumatic stress disorder and bipolar disorder. Dement. Neuropsychol. (2012) doi:10.1590/s1980-57642012dn06040003. 25. Jacobs, H. I. L. et al. The cerebellum in Alzheimer's disease: Evaluating its role in cognitive decline. Brain (2018) doi:10.1093/brain/awx194. 26. Echávarri, C. et al. Atrophy in the parahippocampal gyrus as an early biomarker of alzheimer's disease. Brain Struct. Funct. (2011) doi:10.1007/s00429-010-0283-8. 27. Jacobs, H. I. L. et al. Relevance of parahippocampal-locus coeruleus connectivity to memory in early dementia. Neurobiol. Aging (2015) doi:10.1016/j.neurobiolaging.2014.10.041. 28. Molinari, M. & Leggio, M. Cerebellum and Verbal Fluency (Phonological and Semantic). in The Linguistic Cerebellum (2016). doi:10.1016/B978-0-12-801608-4.00004-9. 29. Lupo, M. et al. Does the cerebellar sequential theory explain spoken language impairments? A literature review. Clin. Linguist. Phonetics (2020) doi:10.1080/02699206.2020.1745285. 30. Parikh, M. et al. Single neuropsychological test scores associated with rate of cognitive decline in early Alzheimer disease. Clin. Neuropsychol. (2014) doi:10.1080/13854046.2014.944937. 31. Arevalo-Rodriguez, I. et al. Mini-Mental State Examination (MMSE) for the detection of Alzheimer's disease and other dementias in people with mild cognitive impairment (MCI). Cochrane Database of Systematic Reviews (2015) doi:10.1002/14651858.CD010783.pub2. 32. Lin, Y. & Jeon, Y. Random forests and adaptive nearest neighbors. J. Am. Stat. Assoc. (2006) doi:10.1198/016214505000001230.Figures
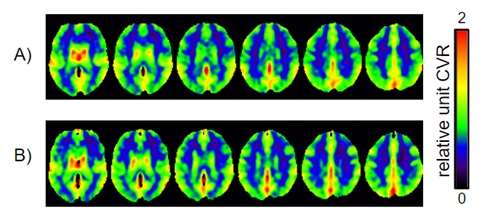
Figure 1: Average resting-state CVR maps for
both groups: A) cognitively normal elderly who convert to AD and B) control
group.
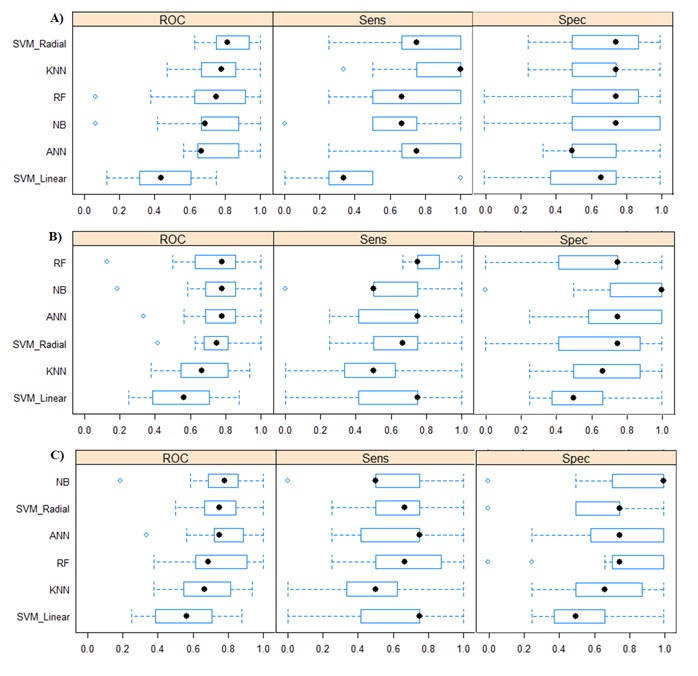
Figure
2: Box plot comparing model results with the training set using the Caret R
Package and the following features: a) NP measures, b) CVR measures, and c)
mixed measures (NP+CVR). Spec = Specificity; Sens = Sensibility; ROC = Receiver
Operating Characteristic.
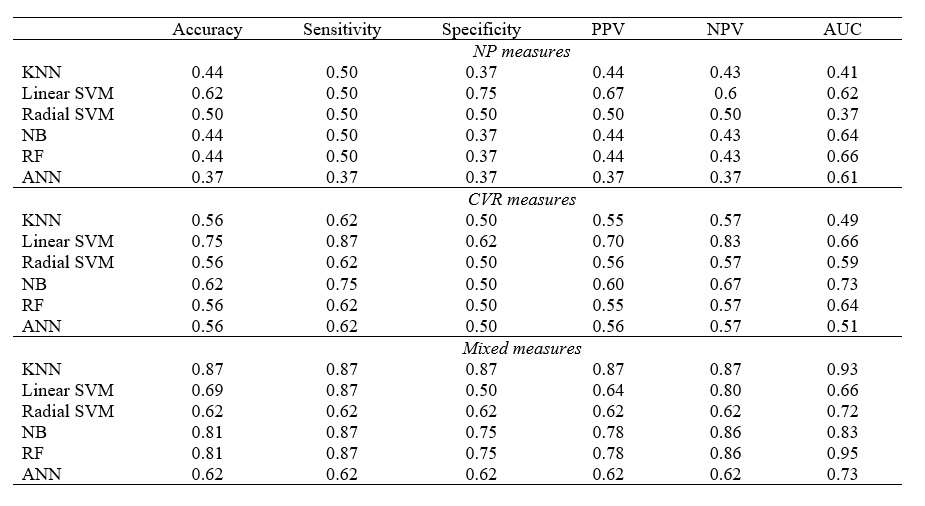
Figure 3: Accuracy, sensibility, specificity, Positive Predictive Value (PPV),
Negative Predictive Value (NPV) and AUC (area under the curve) calculated for
each classifier, using NP measures (MMSE and TRAIL-A scores), CVR measures (CVR
values for Vermis.7 and left
ParaHippocampal gyrus), and mixed measures.