1514
Potential Benefit of Multiband Multiecho EPI for Resting-state Functional MRI in Alzheimer's disease on a compact 3T system: A Preliminary study1Radiology, Mayo Clinic, Rochester, MN, United States, 2GE Global Research, Niskayuna, NY, United States, 3GE Healthcare, Buc, France
Synopsis
Using a high-performance gradient system, multi-band multi-echo fMRI with high temporal and spatial resolutions was acquired. The multi-echo images can be combined based on the weighting of local T2*. The echo-combination improves both the signal intensity and temporal SNR, particularly in regions suffering from signal dropout due to iron deposition like the basal ganglia. Also, the echo-combined images were demonstrated to be superior to the single-echo images for studying functional connectivity due to increased BOLD contrast sensitivity. Multi-echo fMRI is particularly promising for studies of aging and dementia as iron deposition and brain atrophy confound analyses.
Introduction
Abnormally high levels of brain iron deposition and atrophy are prevalent in patients with Alzheimer's disease (AD). It poses a challenge on conventional BOLD-based functional MRI studies, where single-echo (SE) EPI image suffers from severe signal loss caused by T2* shortening from the iron deposition as well as increased partial volume effect (PVE) due to cortical atrophy.1 Multi-echo (ME) EPI acquires several images in one TR at multiple TEs, which is less sensitive to the variation of T2* compared to a single TE. ME can potentially improve image SNR and BOLD sensitivity.2 However, on a conventional whole-body MRI scanner, even with multi-band (MB), ME-EPI results in impractically long TR and extended inter-TE duration for high spatial resolution acquisition.3 This study was conducted on the compact 3T (C3T) scanner equipped with high performance gradients, capable of 80mT/m and 700T/m/s simultaneously with negligible PNS.4-7 This effectively reduces the echo spacing and EPI readout duration for ME-EPI. As a preliminary study of resting-state (RS) fMRI in AD patients and healthy volunteers, we examined the potential benefit of ME-EPI and its effects on image intensity restoration, temporal SNR and functional connectivity compared with SE-EPI.Methods
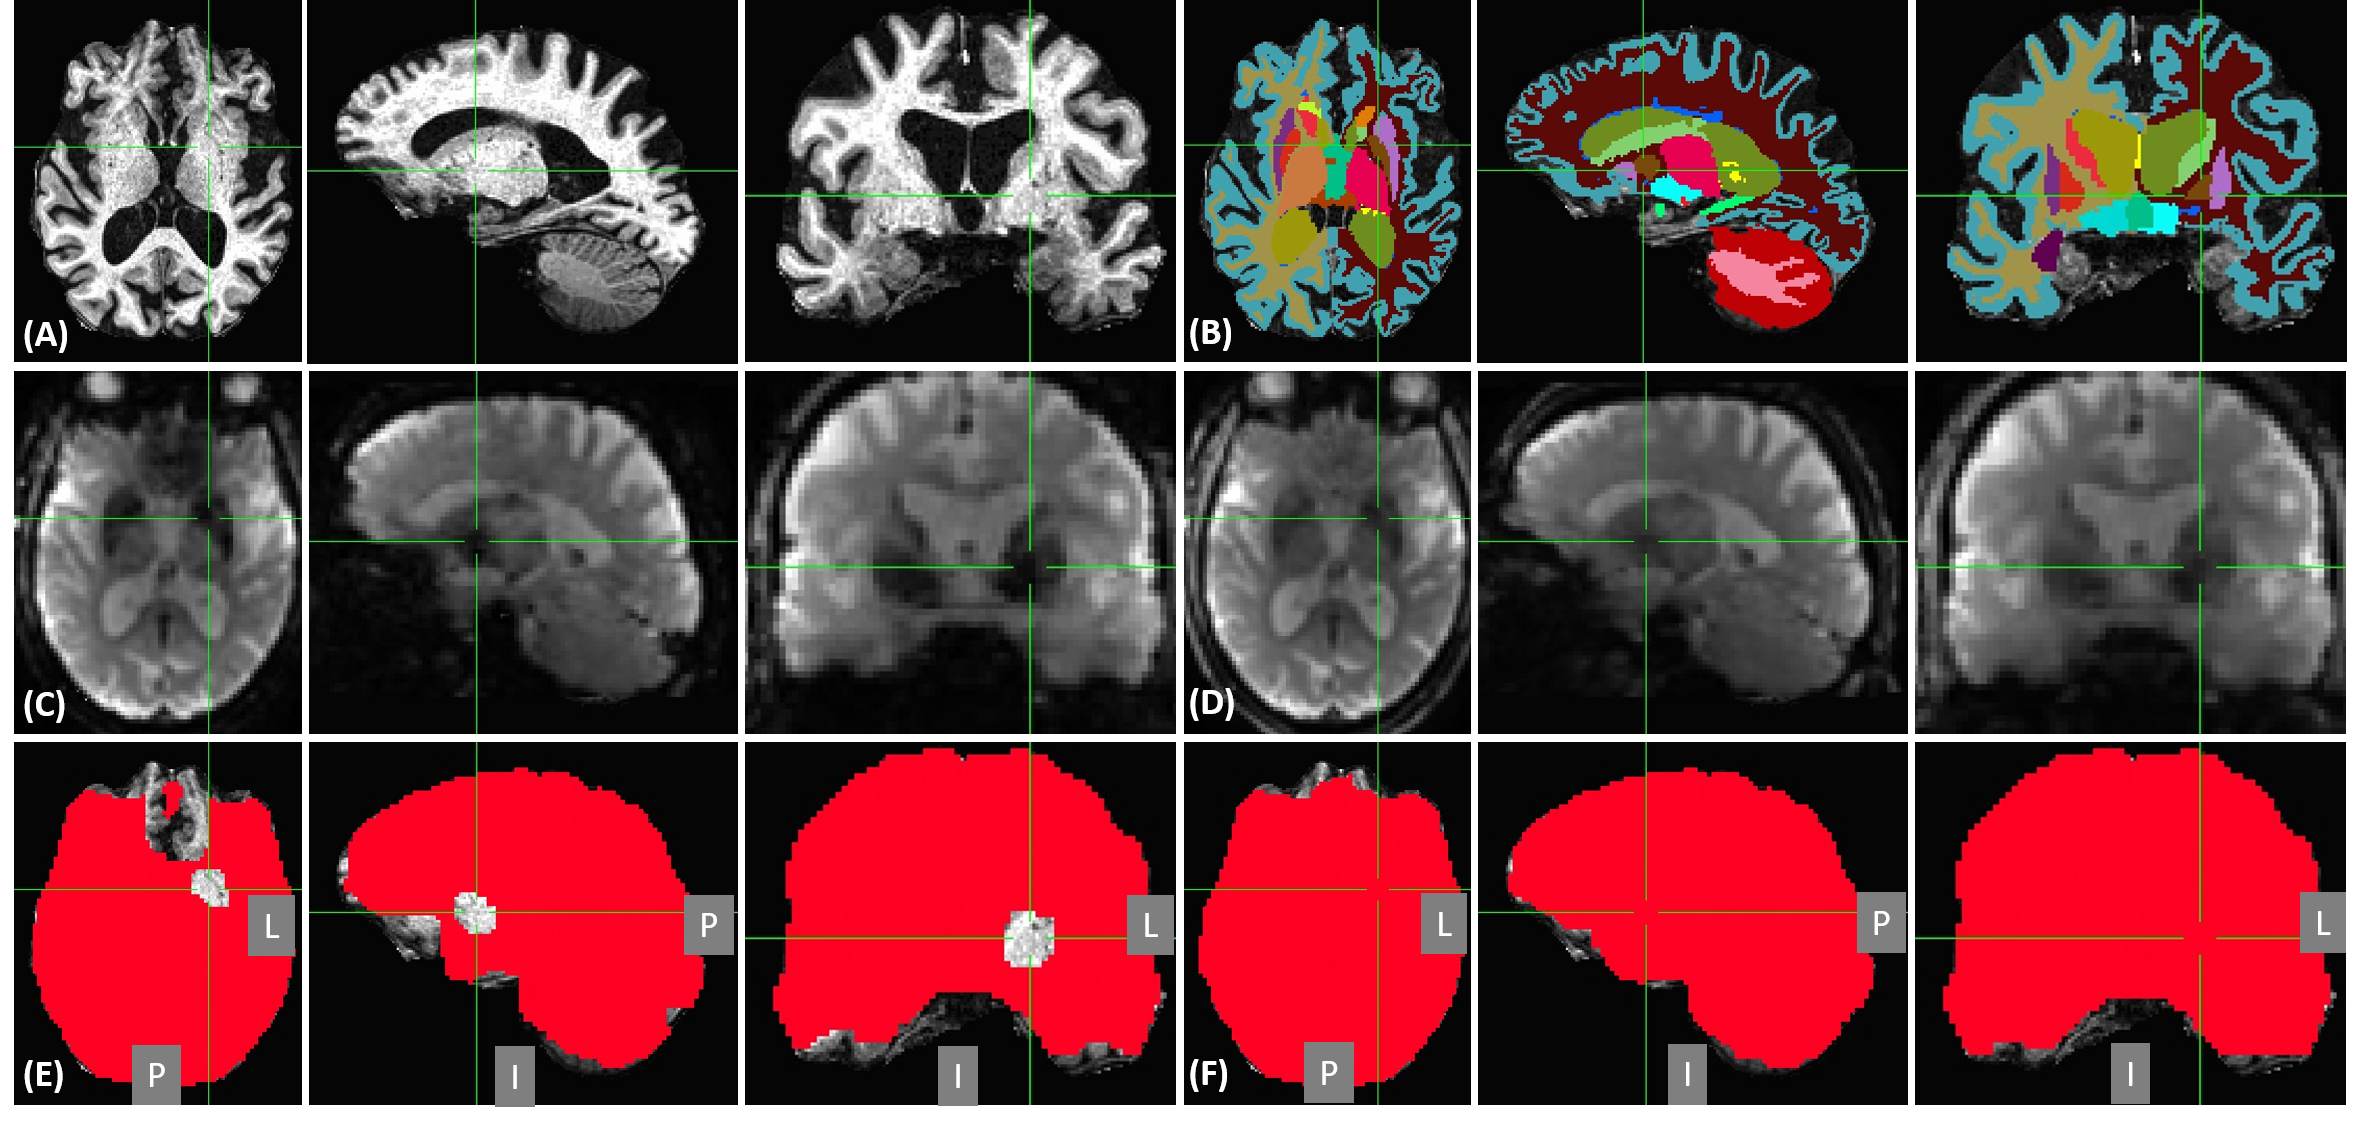
Under an IRB-approved protocol and with written informed consent, T1-weighted anatomical and MB-ME-RS-fMRI images (TR=0.93s, TE=11.8,29.8,47.8ms, FA=59°, ARC(in-plane acceleration)×MB×ME factors=2×4×3, voxel size 2.4×2.4×2.4 mm3, 51 slices, total scan time=5min.) were acquired with a 32-channel head coil (Nova Medical, Wilmington, MA,USA) on the C3T from two AD (2males, 77.5±4.9 years) and three healthy subjects (2females/1male, 45.3±13.6 years). Respiration and cardiac waveforms were recorded during the fMRI scans except for one AD subject. Anatomical images were preprocessed with FreeSurfer software to produce segmentation and parcellation of the brain structures, as well as cortical thickness.8 fMRI images were preprocessed with AFNI,9 where conventional physiological and motion regressions10 plus anatomy-based regression (ANATICOR)11 were applied to SE data (middle echo used only) and T2*-weighted-combined ME data for artifact reduction.2Severe signal intensity loss due to iron deposition was observed in three regions of the AD patients including the caudate (L,P,I)=(9,-11,-2), pallidum (15,-1,-2) and putamen (19,-7,3) based on a brain template (TT_N27 in AFNI)(Fig. 1). Three spherical ROIs with 7mm radius in the brain template were transformed onto an individual space and adjusted by intersection with the corresponding regions extracted from individual anatomical images. Only the left hemisphere was used in this study and posterior cingulate cortex (pCC,3,38,-30) was used as a control region.
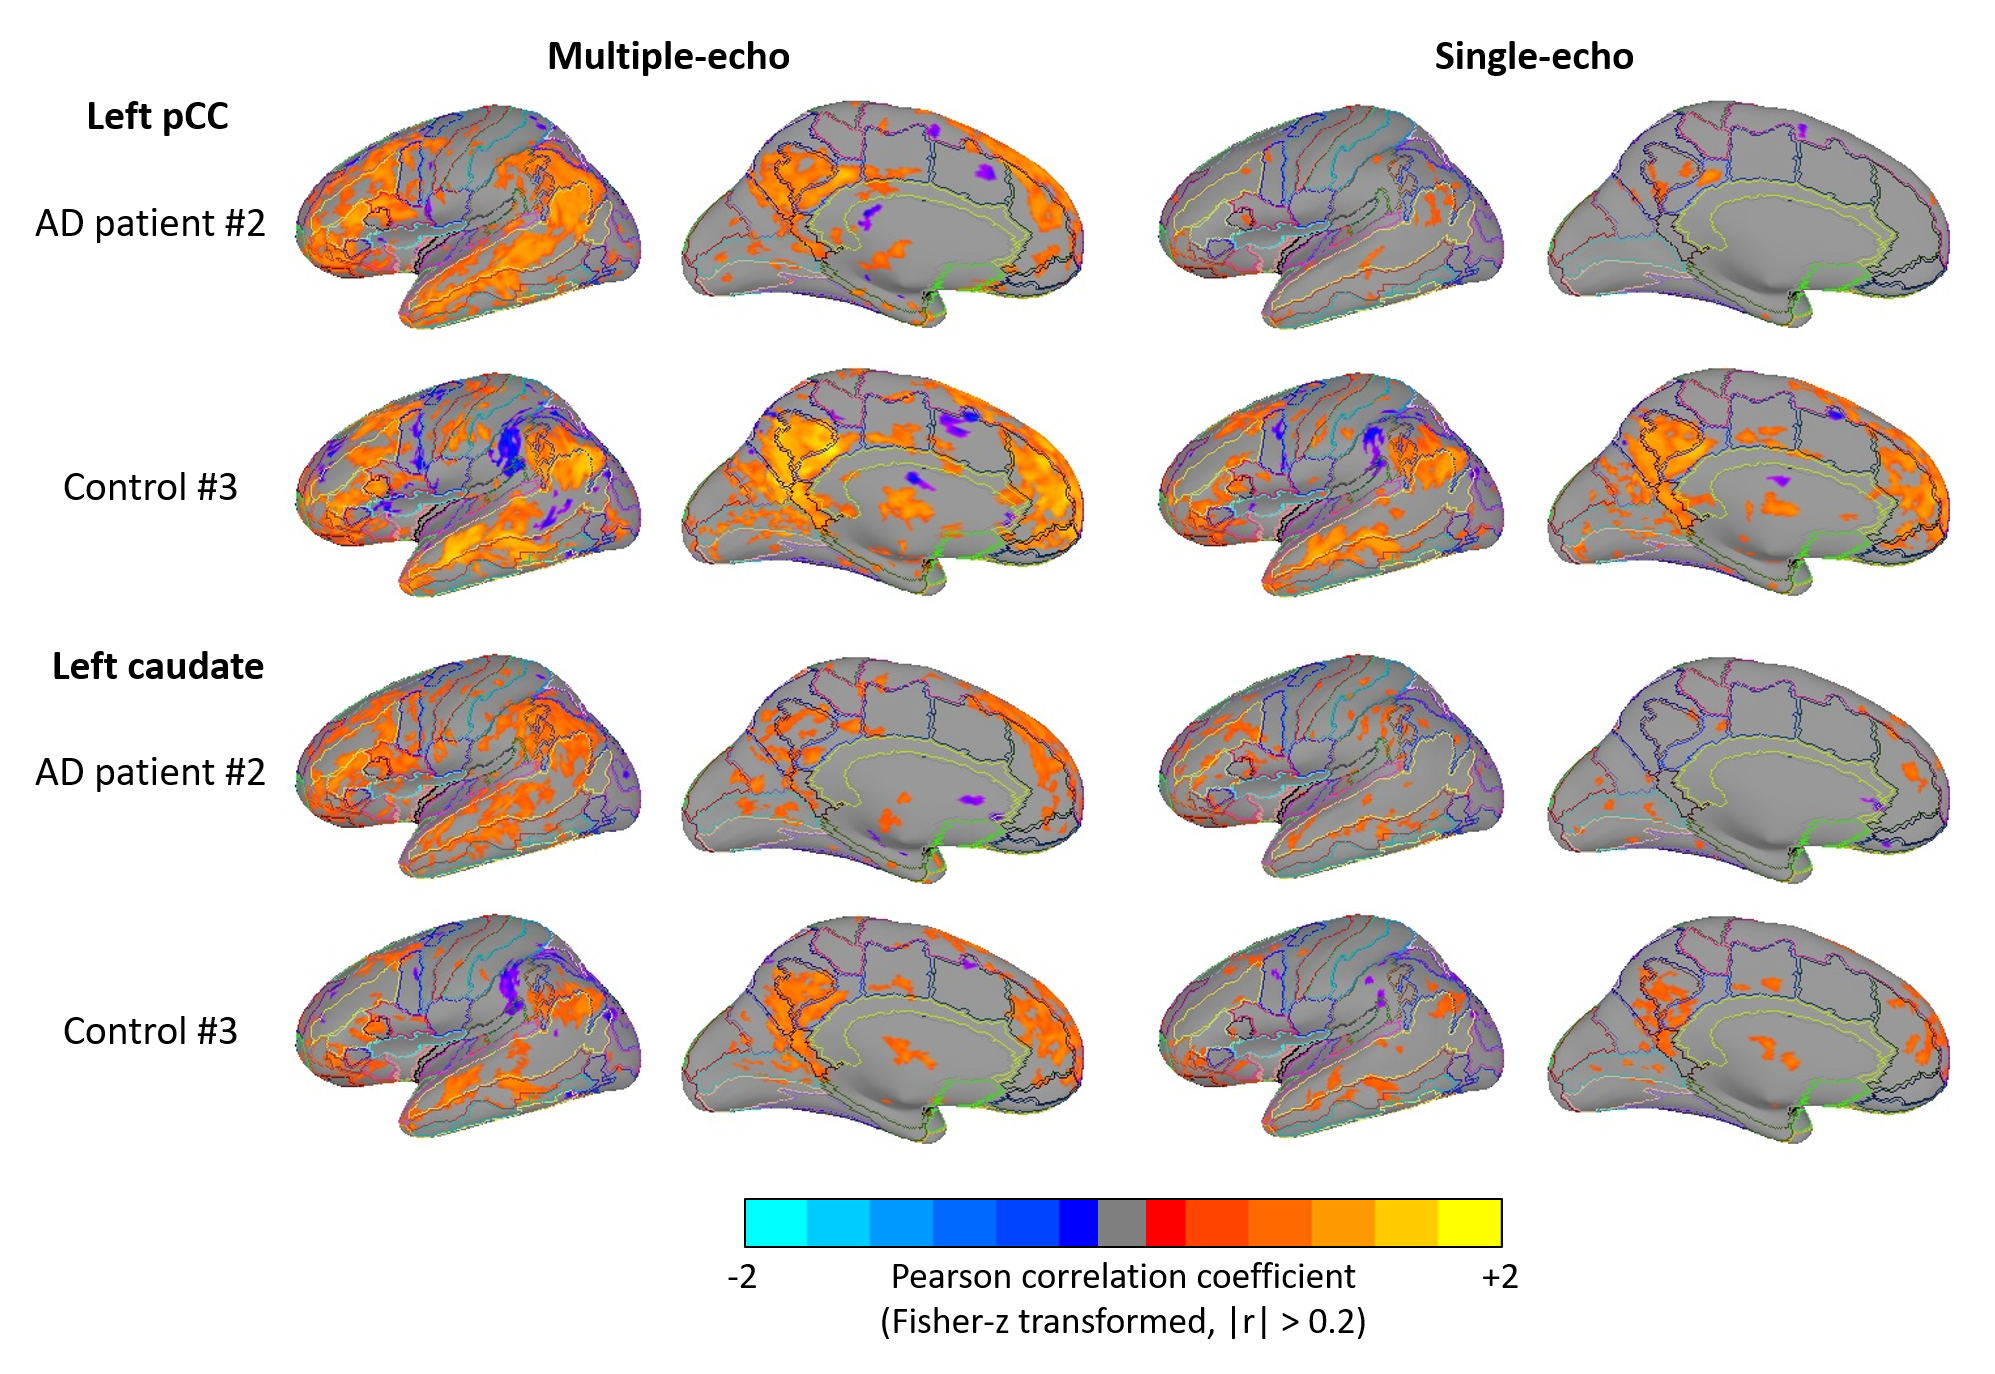
Signal intensity and temporal signal-to-noise ratio (TSNR) were evaluated in each ROI. The functional connectivity (FC) was derived using seed-based Fisher z-transformed Pearson correlation from each ROI.
Results
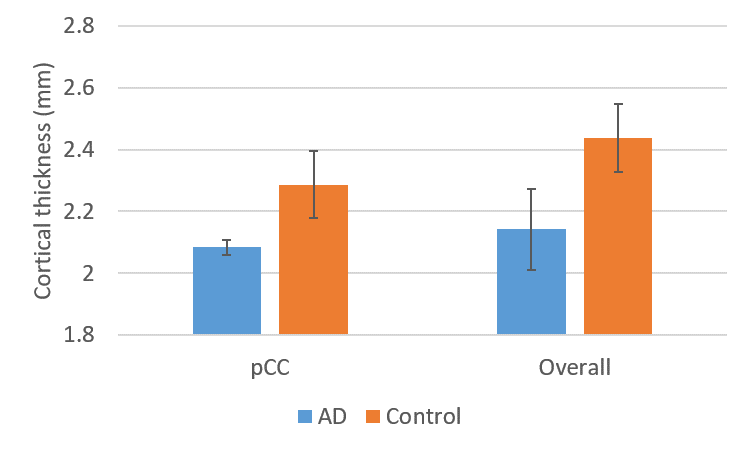
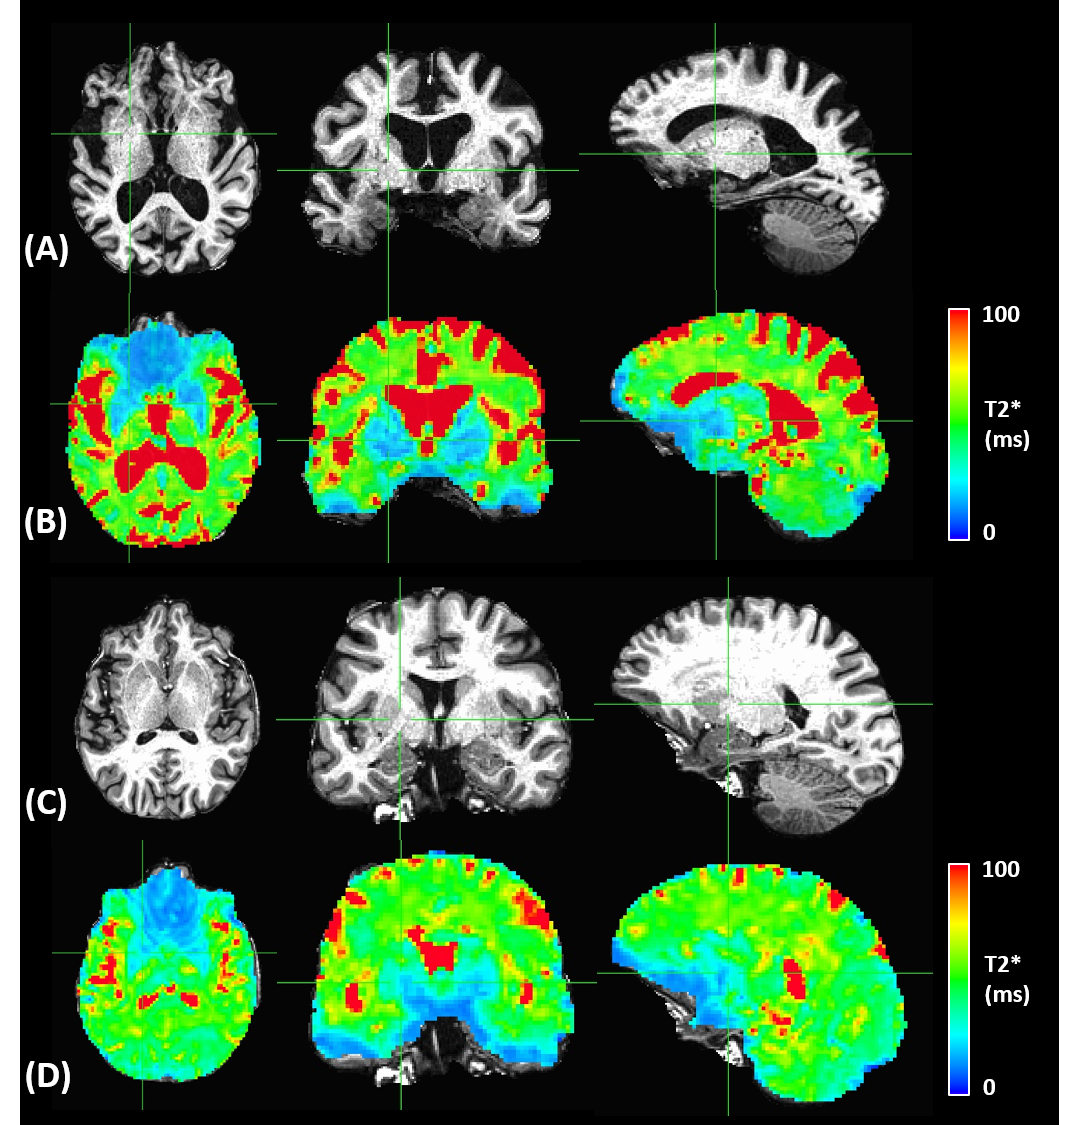
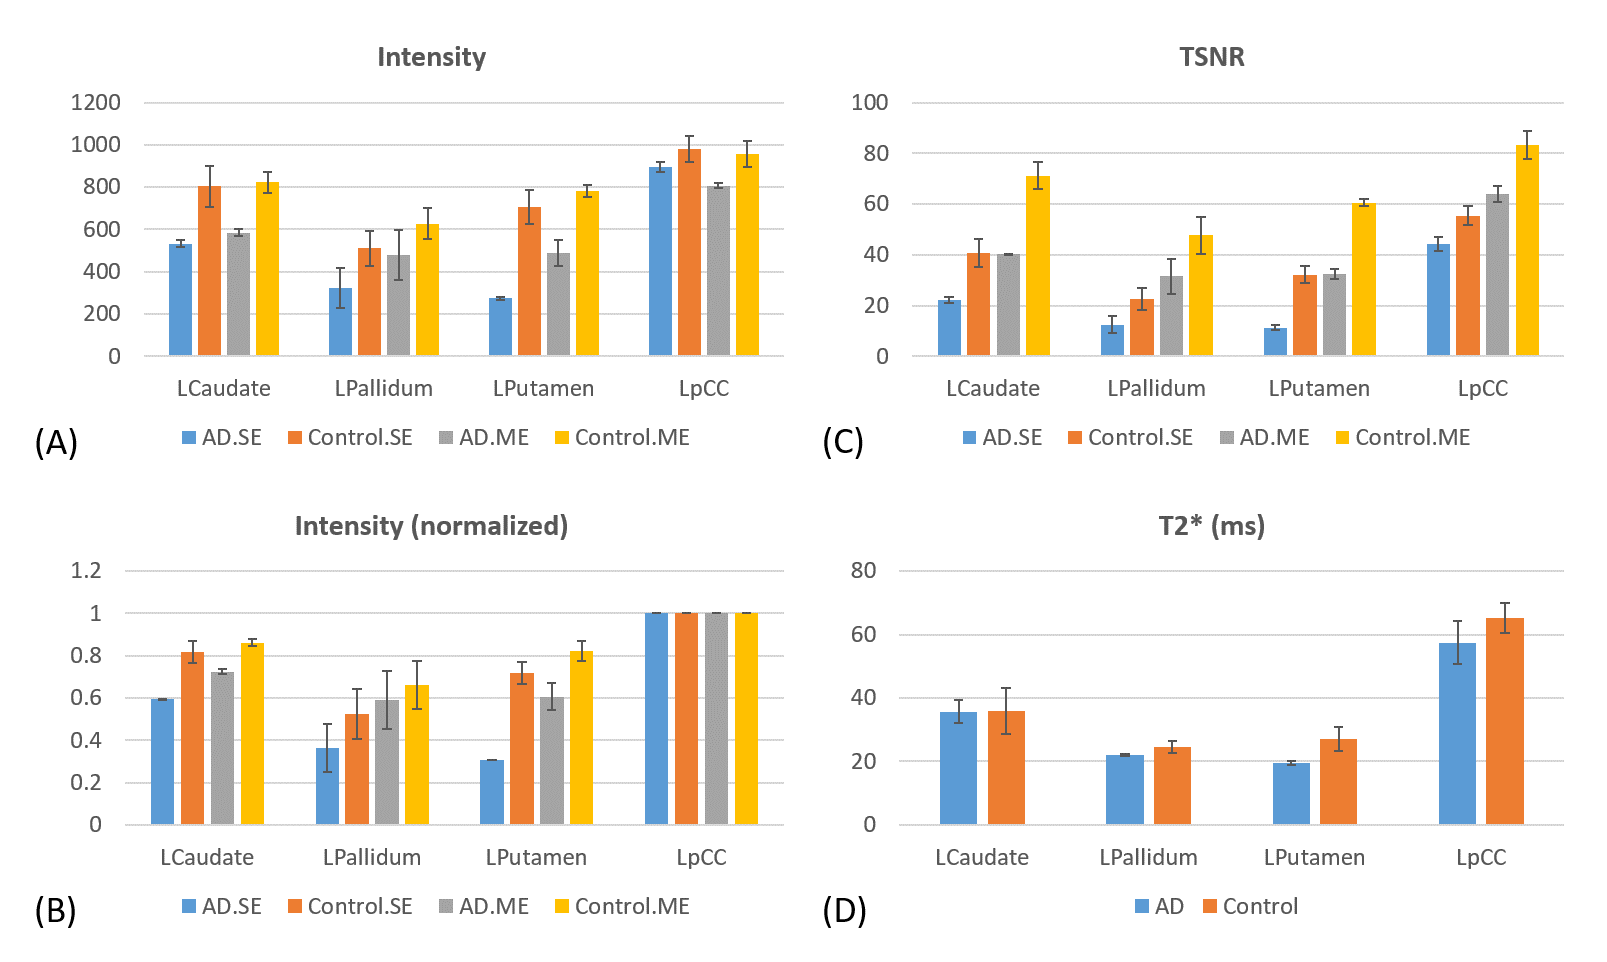
In Fig.2, cortical thickness of the AD subjects was thinner than that of the control subjects, which could increase PVE with white matter and/or cerebrospinal fluid, as shown in T2* maps estimated by ME images (Fig.3). A shorter T2* was observed in the regions with iron deposition in the AD subjects. In Fig.4, T2*-combined ME images generally have improved signal intensity and reduced signal dropout compared to the corresponding SE images, which is more prominent in the three regions with shortened T2* for the AD subject. Pertaining to TSNR, the combined ME images yielded remarkable improvement in all regions for both the AD patients and the healthy volunteers.In Fig.5, FC derived from an AD subject and a control subject were rendered on brain surface models. In the default mode network (DMN) derived from pCC ROI, the detected DMN of AD patient showed noticeable difference between ME and SE while those of a healthy subject provided minor differences in magnitude and extent. Visually, ME FC provided a similar DMN pattern between the AD and the control subjects. Also, the similar difference between ME and SE was observed in FCs of caudate in the AD patient. Since FCs of pallidum and putamen showed minimal connectivity for both the AD and the control subjects, it was not reported here.
Discussion
In this study, we examined the effect of T2*-combined ME fMRI for RS-fMRI study of AD subjects. Compared to SE using a TE selected for the general population, the T2*-weighted combination scheme synthesizes signals that approximate acquisition at the TE~T2* specific to each voxel.2,12 Thus, ME fMRI is less sensitive to local T2* variation and more immune to brain iron deposition. Furthermore, the echo-combining reduced the regional signal dropout, which is helpful for fMRI preprocessing.ME-fMRI has been shown to be superior to SE-fMRI for detecting activation and FC.3,13 With the cortical shrinkage in AD subjects, PVE becomes more problematic, which could reduce BOLD sensitivity.14 The demonstrated increased BOLD sensitivity of ME-fMRI due to echo-combining could be particularly helpful for RS-fMRI AD study.
This preliminary study has the limitation of a very small number of subjects. The results cannot yet be interpreted as a generalized conclusion. Our future goal is to conduct and report a larger confirmatory study. Here the potential benefits of ME-EPI acquisition were presented for the RS functional study of AD subjects.
Conclusion
With a high performance gradient system, multi-echo EPI acquisition was demonstrated to be beneficial to study resting-state FC of AD subjects due to improvements in TSNR and BOLD contrast sensitivity.Acknowledgements
This work was supported by NIH U01 EB024450 and NIH U01 EB026979.References
1 Samuraki, M. et al. Partial volume effect-corrected FDG PET and grey matter volume loss in patients with mild Alzheimer's disease. Eur J Nucl Med Mol Imaging 34, 1658-1669, doi:10.1007/s00259-007-0454-x (2007).
2 Poser, B. a., Versluis, M. J., Hoogduin, J. M. & Norris, D. G. BOLD contrast sensitivity enhancement and artifact reduction with multiecho EPI: Parallel-acquired inhomogeneity-desensitized fMRI. Magnetic Resonance in Medicine 55, 1227-1235, doi:10.1002/mrm.20900 (2006).
3 Kang, D. et al. in Proc. Intl. Soc. Mag. Reson. Med. 1218.
4 Foo, T. K. F. et al. Lightweight, compact, and high-performance 3T MR system for imaging the brain and extremities. Magn Reson Med 80, 2232-2245, doi:10.1002/mrm.27175 (2018).
5 Tan, E. T. et al. High slew-rate head-only gradient for improving distortion in echo planar imaging: Preliminary experience. J Magn Reson Imaging 44, 653-664, doi:10.1002/jmri.25210 (2016).
6 Kang, D. et al. The benefit of high-performance gradients on echo planar imaging for BOLD-based resting-state functional MRI. Phys Med Biol 65, 235024, doi:10.1088/1361-6560/abb2ec (2020).
7 In, M. H. et al. Reducing PNS with minimal performance penalties via simple pulse sequence modifications on a high-performance compact 3T scanner. Phys Med Biol 65, 15NT02, doi:10.1088/1361-6560/ab99e2 (2020).
8 Reuter, M., Schmansky, N. J., Rosas, H. D. & Fischl, B. Within-subject template estimation for unbiased longitudinal image analysis. Neuroimage 61, 1402-1418, doi:10.1016/j.neuroimage.2012.02.084 (2012).
9 Cox, R. W. AFNI: software for analysis and visualization of functional magnetic resonance neuroimages. Comput Biomed Res 29, 162-173 (1996).
10 Glover, G. H., Li, T. Q. & Ress, D. Image-based method for retrospective correction of physiological motion effects in fMRI: RETROICOR. Magnetic Resonance in Medicine 44, 162-167, doi:10.1002/1522-2594(200007)44:1<162::AID-MRM23>3.0.CO;2-E (2000).
11 Jo, H. J., Saad, Z. S., Simmons, W. K., Milbury, L. A. & Cox, R. W. Mapping sources of correlation in resting state FMRI, with artifact detection and removal. Neuroimage 52, 571-582, doi:10.1016/j.neuroimage.2010.04.246 (2010).
12 Kundu, P. et al. Multi-echo fMRI: A review of applications in fMRI denoising and analysis of BOLD signals. Neuroimage 154, 59-80, doi:10.1016/j.neuroimage.2017.03.033 (2017).
13 Cohen, A. D. et al. Detecting Task Functional MRI Activation Using the Multiband Multiecho (MBME) Echo-Planar Imaging (EPI) Sequence. J Magn Reson Imaging, doi:10.1002/jmri.27448 (2020).
14 Du, Y. P., Chu, R. & Tregellas, J. R. Enhancing the detection of BOLD signal in fMRI by reducing the partial volume effect. Comput Math Methods Med 2014, 973972, doi:10.1155/2014/973972 (2014).
Figures