1509
Multi-scale sex difference of brain function in Alzheimer’s disease
Zhengshi Yang1,2, Cieri Filippo1, Xiaowei Zhuang1,2, Marwan Sabbagh1, Jefferson W. Kinney2, Jeffrey L. Cummings2, Dietmar Cordes1,2,3, and Jessica Z.K. Caldwell1
1Cleveland Clinic Lou Ruvo Center for Brain Health, Las Vegas, NV, United States, 2University of Nevada Las Vegas, Las Vegas, NV, United States, 3University of Colorado Boulder, Boulder, CO, United States
1Cleveland Clinic Lou Ruvo Center for Brain Health, Las Vegas, NV, United States, 2University of Nevada Las Vegas, Las Vegas, NV, United States, 3University of Colorado Boulder, Boulder, CO, United States
Synopsis
Despite the prevalence of AD in women and the recognized sex-dependent genetic factors and male/female differences in cognitive measures in AD, how sex is related to AD phenotypic variability remains unclear. We demonstrated a varying spatial extent and magnitude of sex differences in brain function in an AD cohort, suggesting the dynamic contribution of sex in disease progression. Opposite network topological changes were observed from cognitively normal to MCI, and more rapid progression occurred in women than men from MCI to AD. The occipital lobe contributed more in men but frontal lobe contributed more in women in disease progression.
INTRODUCTION
Alzheimer’s dementia (AD) is a progressive neurodegenerative disease for which disease-modifying therapies are needed. A critical issue in developing new therapies for AD is the heterogeneity of disease manifestations and progression among patients[1]. There is growing interest in AD research to identify genetic, demographic, and phenotypic traits[2-5] that are relevant to disease characterization, onset, progression, and treatment. Despite the higher prevalence of AD in women and the recognized sex-dependent genetic factors and male/female differences in cognitive measures in AD, how sex is related to AD phenotypic variability remains unclear[1]. In this study, we demonstrated sex difference of brain function at global, regional and edge levels to illustrate overall and spatially localized sex effects.METHODS
The data are publicly available in ADNI database (http://adni.loni.usc.edu/). Each subject was required to have MRI scans and AV-45 PET images available at the same visit. Cognitively normal (CN) participants were required to be amyloid negative, and the participants diagnosed as mild cognitive impairment (MCI) or AD were required to be amyloid positive. 182 participants were included with these criteria, including 70 CN (34 men/36 women), 60 MCI (30 men/30 women), and 52 AD dementia (26 men/26 women). Both T1 and resting-state fMRI data were normalized to MNI space following slice-timing correction, realignment, and coregistration steps. A deep learning based de-noising strategy, named DeNN [6], was applied to de-noise fMRI data by disentangling time series between different brain tissues. The time series of 94 cortical and subcortical ROIs from AAL atlas [7] were used to construct the weighted whole-brain functional connectivity (FC) network, followed by graph theoretical analysis[8]. 2-sample t-tests revealed that degree centrality (DC), global efficiency (GE), local efficiency (LE), clustering coefficient (Cp), and characteristic path length (Lp) were found to be significantly different between the CN and AD dementia groups, after controlling for the influence of age, sex, handedness and education. We then tested the sex differences of these five global network metrics and their corresponding regional network metrics in each diagnostic group, with age, handedness and education controlled in the analysis. The differences between diagnostic groups were tested for women and men separately. The same univariate analysis described for global level analysis was used to test the significance of connections in FC network, followed by Network Based Statistics [9] to control family-wise error rate (FWER).RESULTS
Five global network metrics were observed to have significant group difference between CN and AD after Bonferroni correction over the number of metrics. The AD dementia group had significantly higher Lp (p=0.004, d=0.64) and significantly lower DC (p=0.002, d=-0.68), LE (p=0.004, d=-0.64), Cp (p=0.007, d=-0.60) and GE (p=0.003, d=-0.66) than CN group, indicating weaker connection strength and less integrated and less segregated networks in AD dementia subjects. Men showed monotonic trends and women showed “V” trajectories for these five global metrics from CN to MCI finally towards AD (Figure 1a). The sex differences observed in the CN group diminished in the MCI group but re-occur in the AD group (Figure 1b). The sex differences in both CN and AD groups are similar to the group differences between AD and CN groups (Figure 1c). At the regional level, spatially widespread sex differences were observed in the CN group, and these brain regions were mainly located in the frontal, temporal, and occipital lobes (Table 1). The influence of sex was much more spatially limited in the MCI and AD dementia groups. The MCI group had sex differences mainly located in frontal lobe and the AD group had sex differences mainly located in frontal and temporal lobes. Men had significantly more regions, particularly frontal and temporal lobes, than women showing group differences between MCI and CN (Table 2). Frontal and temporal lobes played a more important role for women than men but occipital lobe played a more important role for men than women in differentiating AD from MCI. The occipital lobe was crucial for the discrepancy between women and men in the group difference between AD and CN groups. At the edge level, one cluster was identified as having significantly lower FC in women than men among CN subjects, with the connections dominantly located with or within frontal and temporal lobes (Figure 2). No cluster had significant sex difference for either MCI or AD. The AD group had one cluster with significantly lower functional connectivity than MCI and CN for both women and men. AD men have fewer disrupted frontal connections but more abnormal occipital connections than AD women in the between group comparison (Figure 3).DISCUSSION and CONCLUSION
Our study demonstrated the sex-specific trajectories in the pathological continuum of AD. Women’s brains tend to compensate for the pathological effect at the initial stage but deteriorate more rapidly than men’s brains at the later stage. Frontal connectivity plays a more important role for the abnormal brain function in women and occipital connectivity is more responsible for the altered brain function in men than women. The different brain response in women and men could be related to the sex differences in behavioral and cognitive performance. Overall, these findings suggest that sex is an important demographical variable for understanding the effects of AD and developing personalized therapies.Acknowledgements
This research project was supported by the NIH (Grant No. 1R01EB014284 and COBRE 5P20GM109025), Cleveland Clinic Keep Memory Alive Young Investigator Award, a private grant from Stacie and Chuck Matthewson, a private grant from Peter and Angela Dal Pezzo, and a private grant from Lynn and William Weidner. Data collection and sharing for this study was funded by the Alzheimer's Disease Neuroimaging Initiative (ADNI) (National Institutes of Health Grant U01 AG024904) and DOD ADNI (Department of Defense award number W81XWH-12-2-0012) and Human Connectome Project. HCP funding was provided by the National Institute of Dental and Craniofacial Research (NIDCR), the National Institute of Mental Health (NIMH), and the National Institute of Neurological Disorders and Stroke (NINDS). ADNI is funded by the National Institute on Aging, the National Institute of Biomedical Imaging and Bioengineering, and through generous contributions from the following: AbbVie, Alzheimer’s Association; Alzheimer’s Drug Discovery Foundation; Araclon Biotech; BioClinica, Inc.; Biogen; Bristol-Myers Squibb Company; CereSpir, Inc.; Cogstate; Eisai Inc.; Elan Pharmaceuticals, Inc.; Eli Lilly and Company; EuroImmun; F. Hoffmann-La Roche Ltd and its affiliated company Genentech, Inc.; Fujirebio; GE Healthcare; IXICO Ltd.; Janssen Alzheimer Immunotherapy Research & Development, LLC.; Johnson &Johnson Pharmaceutical Research & Development LLC.; Lumosity; Lundbeck; Merck & Co., Inc.; Meso Scale Diagnostics, LLC.; NeuroRx Research; Neurotrack Technologies; Novartis Pharmaceuticals Corporation; Pfizer Inc.; Piramal Imaging; Servier; Takeda Pharmaceutical Company; and Transition Therapeutics. The Canadian Institutes of Health Research is providing funds to support ADNI clinical sites in Canada. Private sector contributions are facilitated by the Foundation for the National Institutes of Health (www.fnih.org). The grantee organization is the Northern California Institute for Research and Education, and the study is coordinated by the Alzheimer’s Therapeutic Research Institute at the University of Southern California. ADNI data are disseminated by the Laboratory for Neuro Imaging at the University of Southern California.References
1. Ferretti, M.T., et al., Sex differences in Alzheimer disease—the gateway to precision medicine. Nature Reviews Neurology, 2018. 14(8): p. 457-469. 2. Perez-Nievas, B.G., et al., Dissecting phenotypic traits linked to human resilience to Alzheimer’s pathology. Brain, 2013. 136(8): p. 2510-2526. 3. Shen, L., et al., Whole genome association study of brain-wide imaging phenotypes for identifying quantitative trait loci in MCI and AD: A study of the ADNI cohort. Neuroimage, 2010. 53(3): p. 1051-1063. 4. Desikan, R.S., et al., Genetic assessment of age-associated Alzheimer disease risk: Development and validation of a polygenic hazard score. PLoS medicine, 2017. 14(3): p. e1002258. 5. Fan, C.C., et al., Sex-dependent autosomal effects on clinical progression of Alzheimer’s disease. Brain, 2020. 143(7): p. 2272-2280. 6. Yang, Z., et al., Disentangling time series between brain tissues improves fMRI data quality using a time-dependent deep neural network. NeuroImage, 2020. 223: p. 117340. 7. Tzourio-Mazoyer, N., et al., Automated anatomical labeling of activations in SPM using a macroscopic anatomical parcellation of the MNI MRI single-subject brain. Neuroimage, 2002. 15(1): p. 273-289. 8. Wang, J., et al., GRETNA: a graph theoretical network analysis toolbox for imaging connectomics. Frontiers in human neuroscience, 2015. 9: p. 386. 9. Zalesky, A., A. Fornito, and E.T. Bullmore, Network-based statistic: identifying differences in brain networks. Neuroimage, 2010. 53(4): p. 1197-1207.Figures
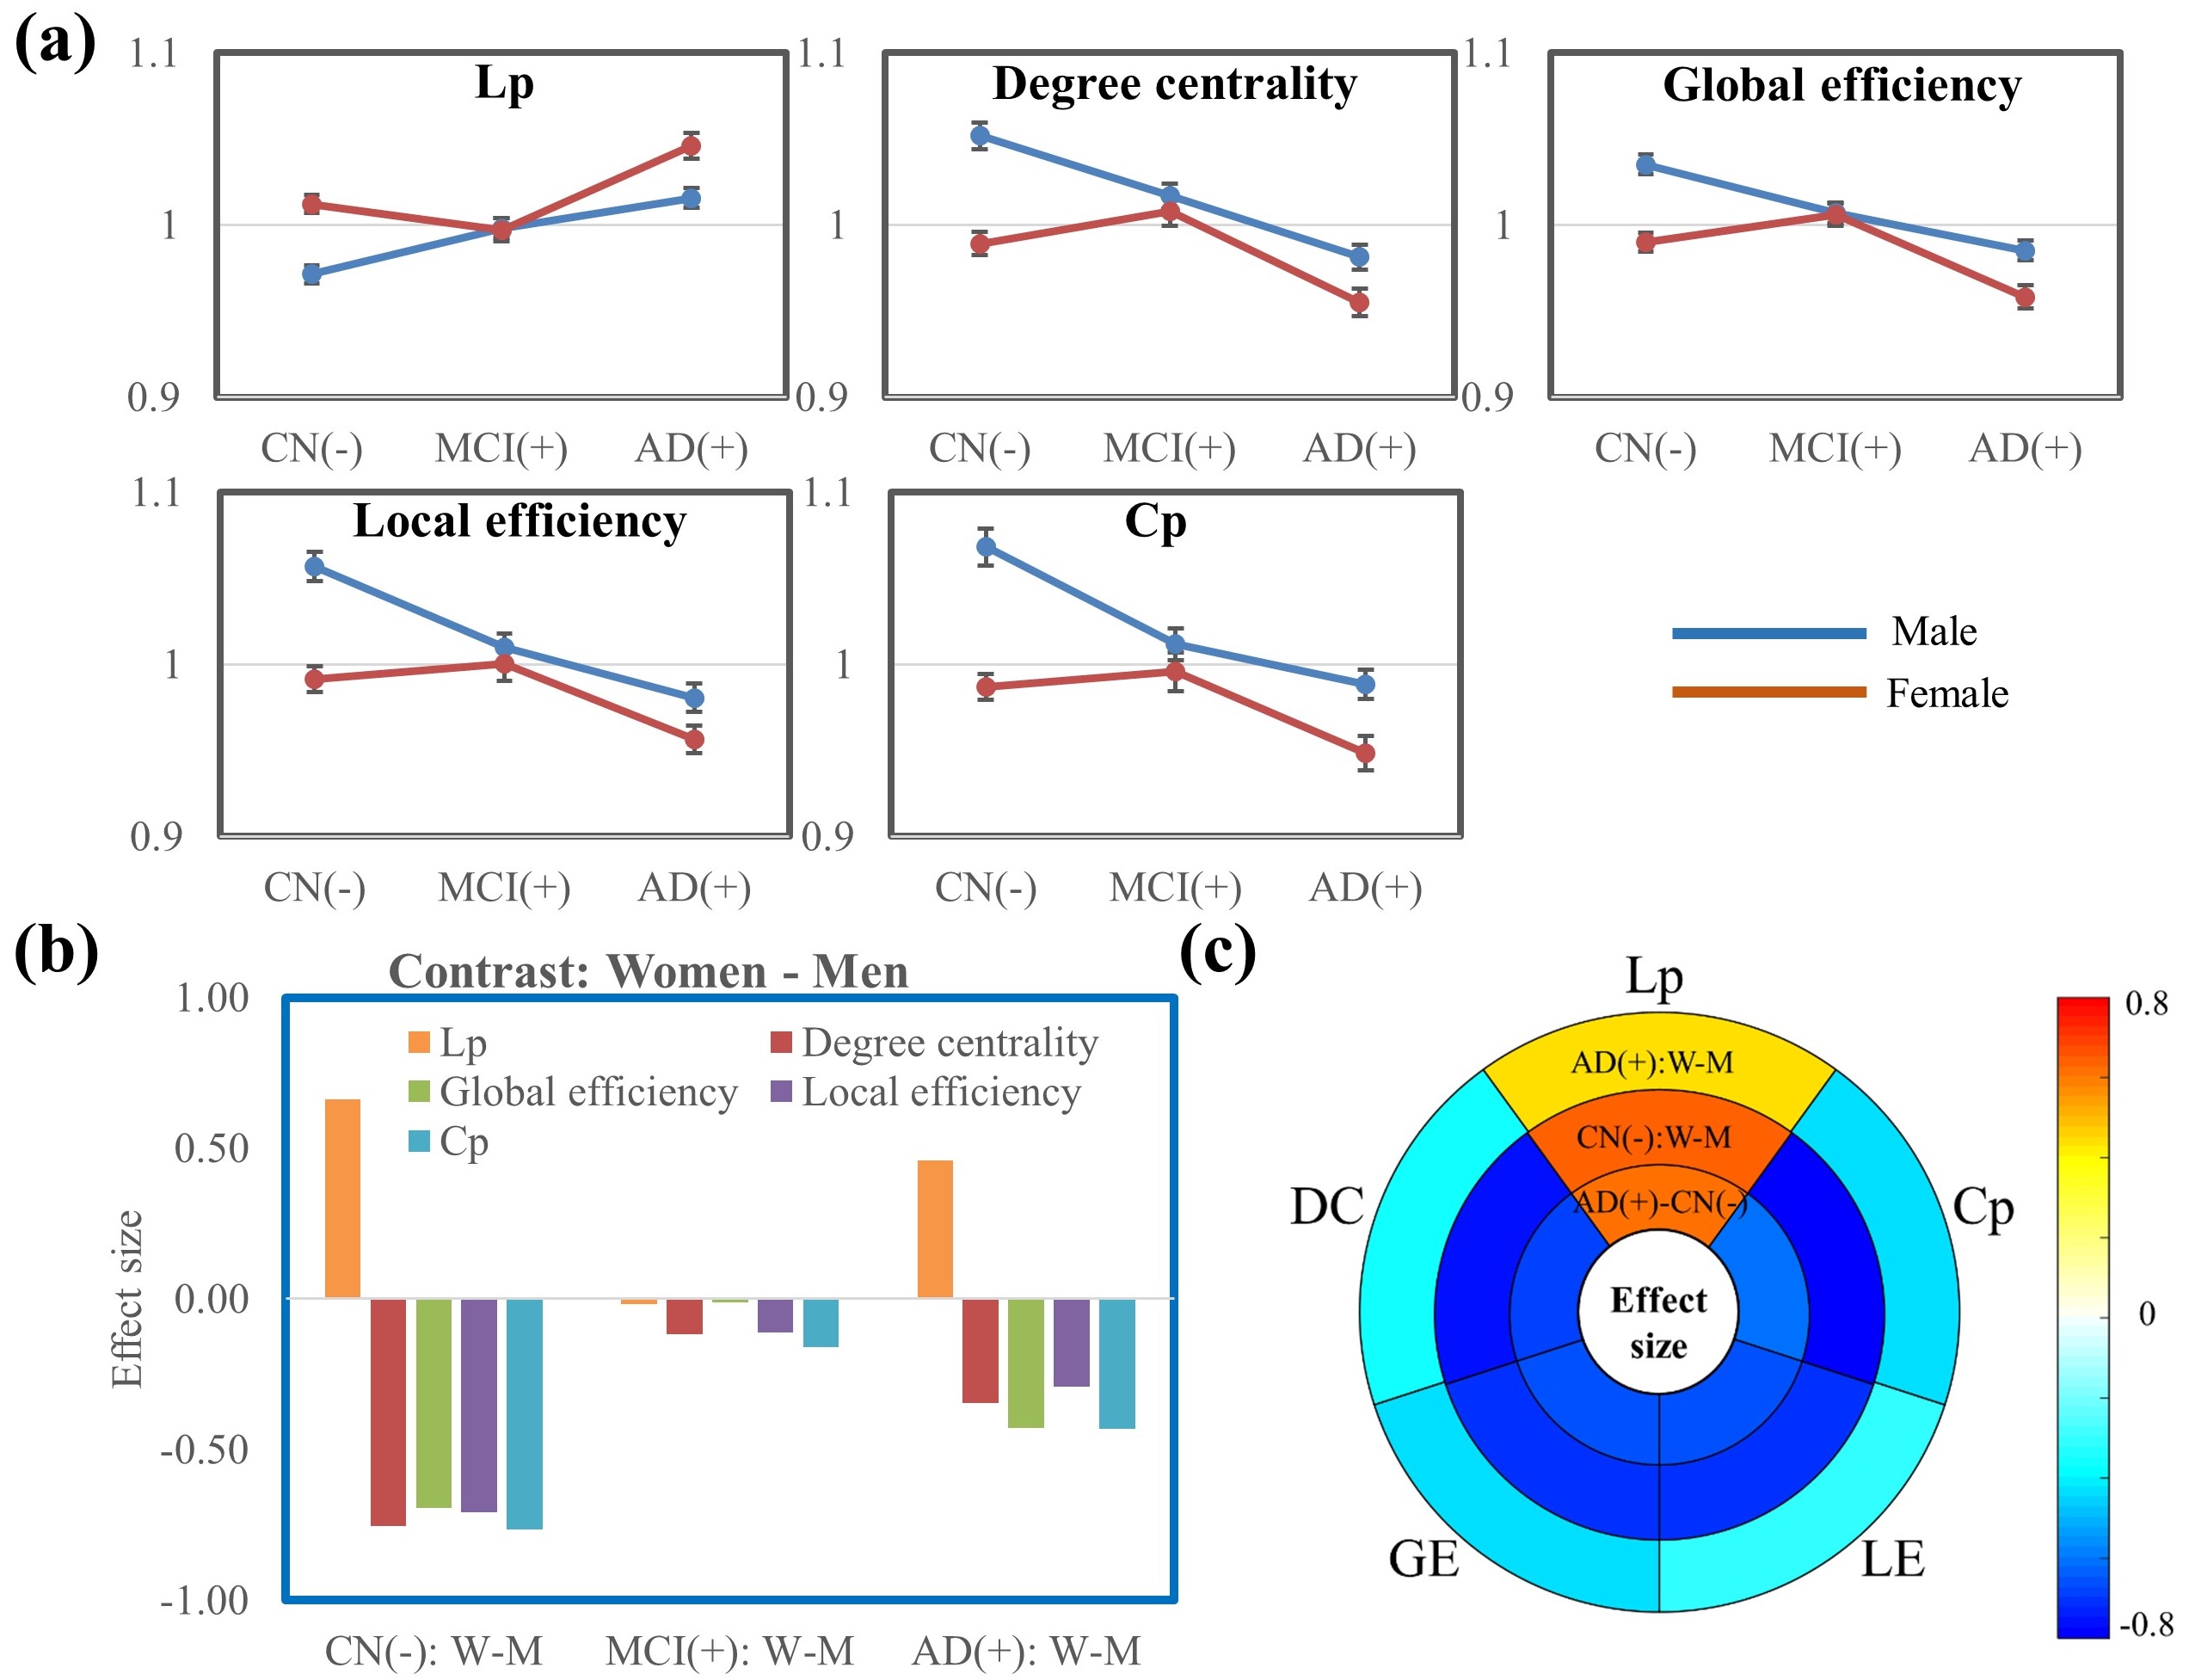
Figure 1. Graph
theory analysis at the global level. (a). Curves of the five global network
metrics from CN to MCI towards AD dementia. (b). Sex difference in CN, MCI, and
AD groups. (c). Effect size of the five global network metrics for the
contrasts AD dementia – CN (both women and men together), CN: Women – Men, and
AD dementia: Women – Men. The sex differences in both CN and AD dementia groups
are observed to be similar to the group differences between the AD dementia and
CN groups.
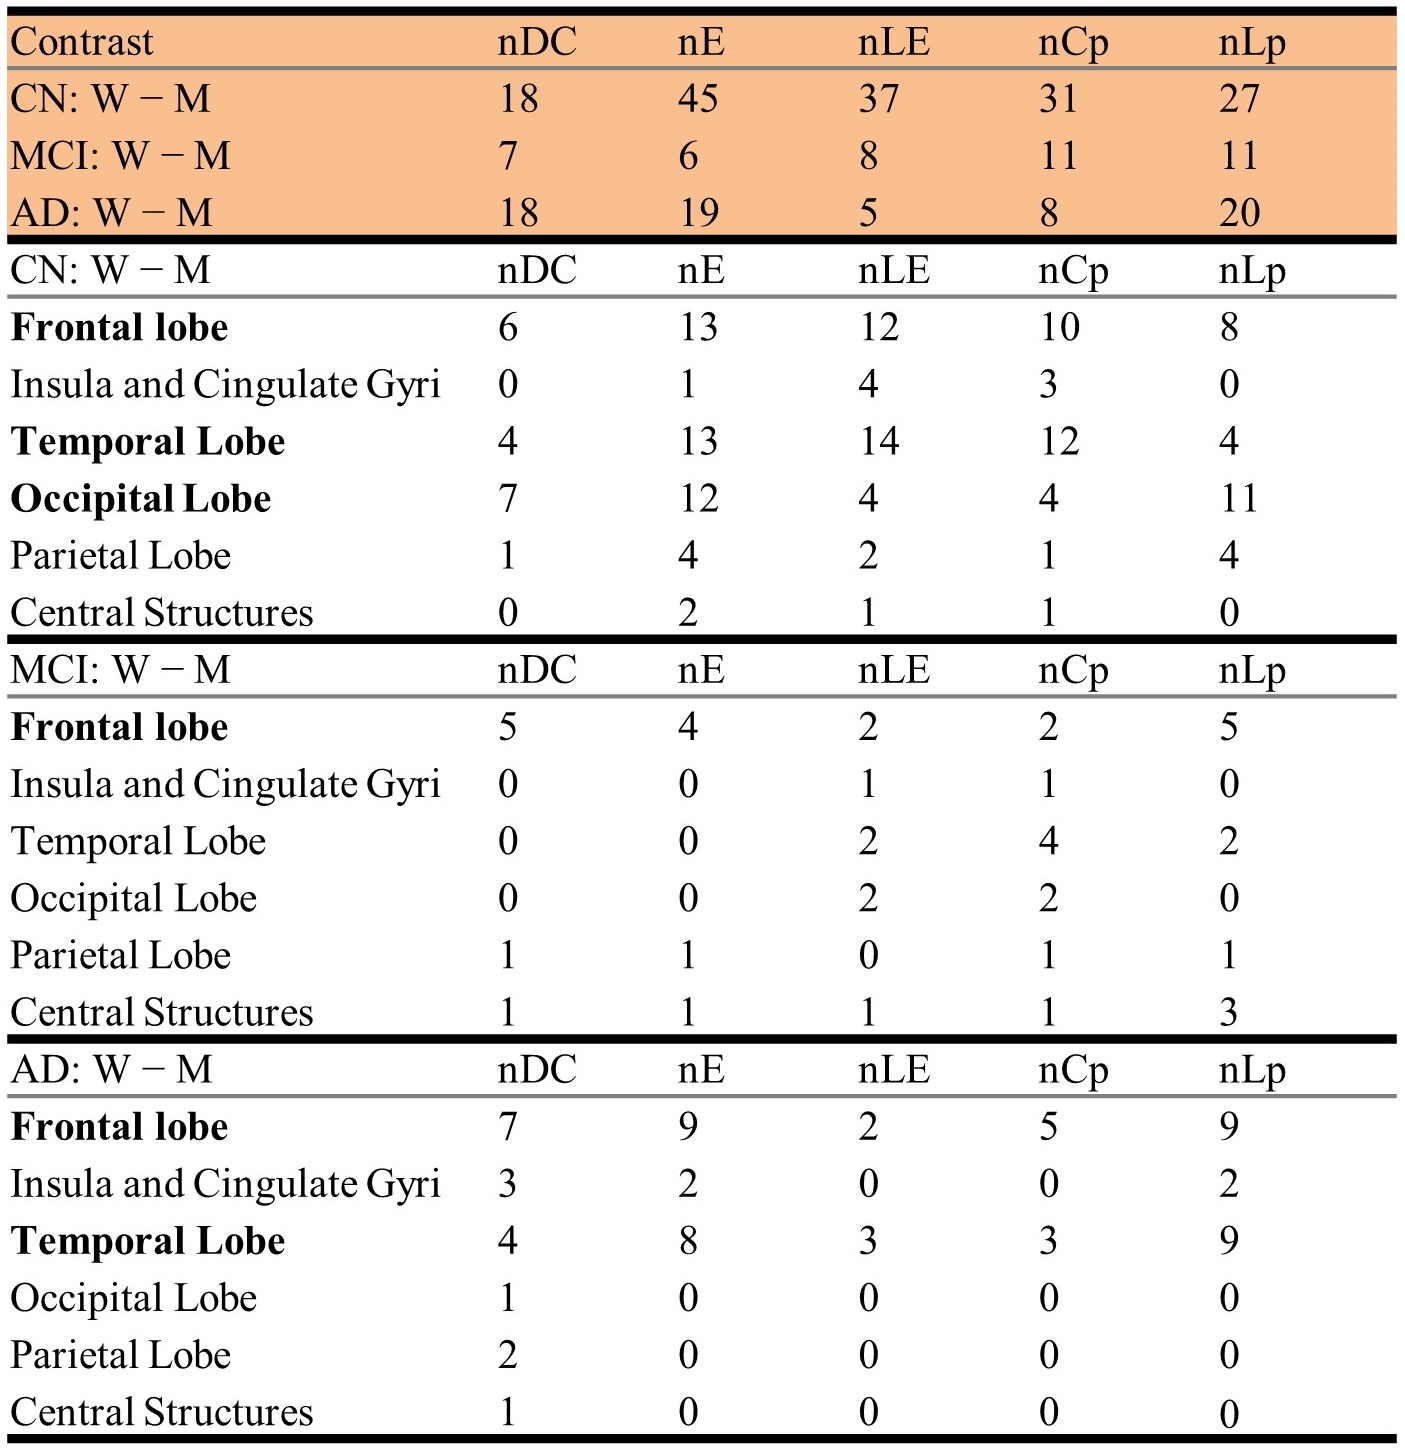
Table
1. Sex difference within each diagnostic group. Summary of the number of nodes
with |cohen’s d|≥ 0.5. To facilitate analysis, we have categorized the 94 ROIs
into six brain areas, including the frontal lobe (34 ROIs), temporal lobe (20
ROIs), insula and cingulate gyri (8 ROIs), occipital lobe (12 ROIs), parietal
lobe (12 ROIs), and central structures (8 ROIs).
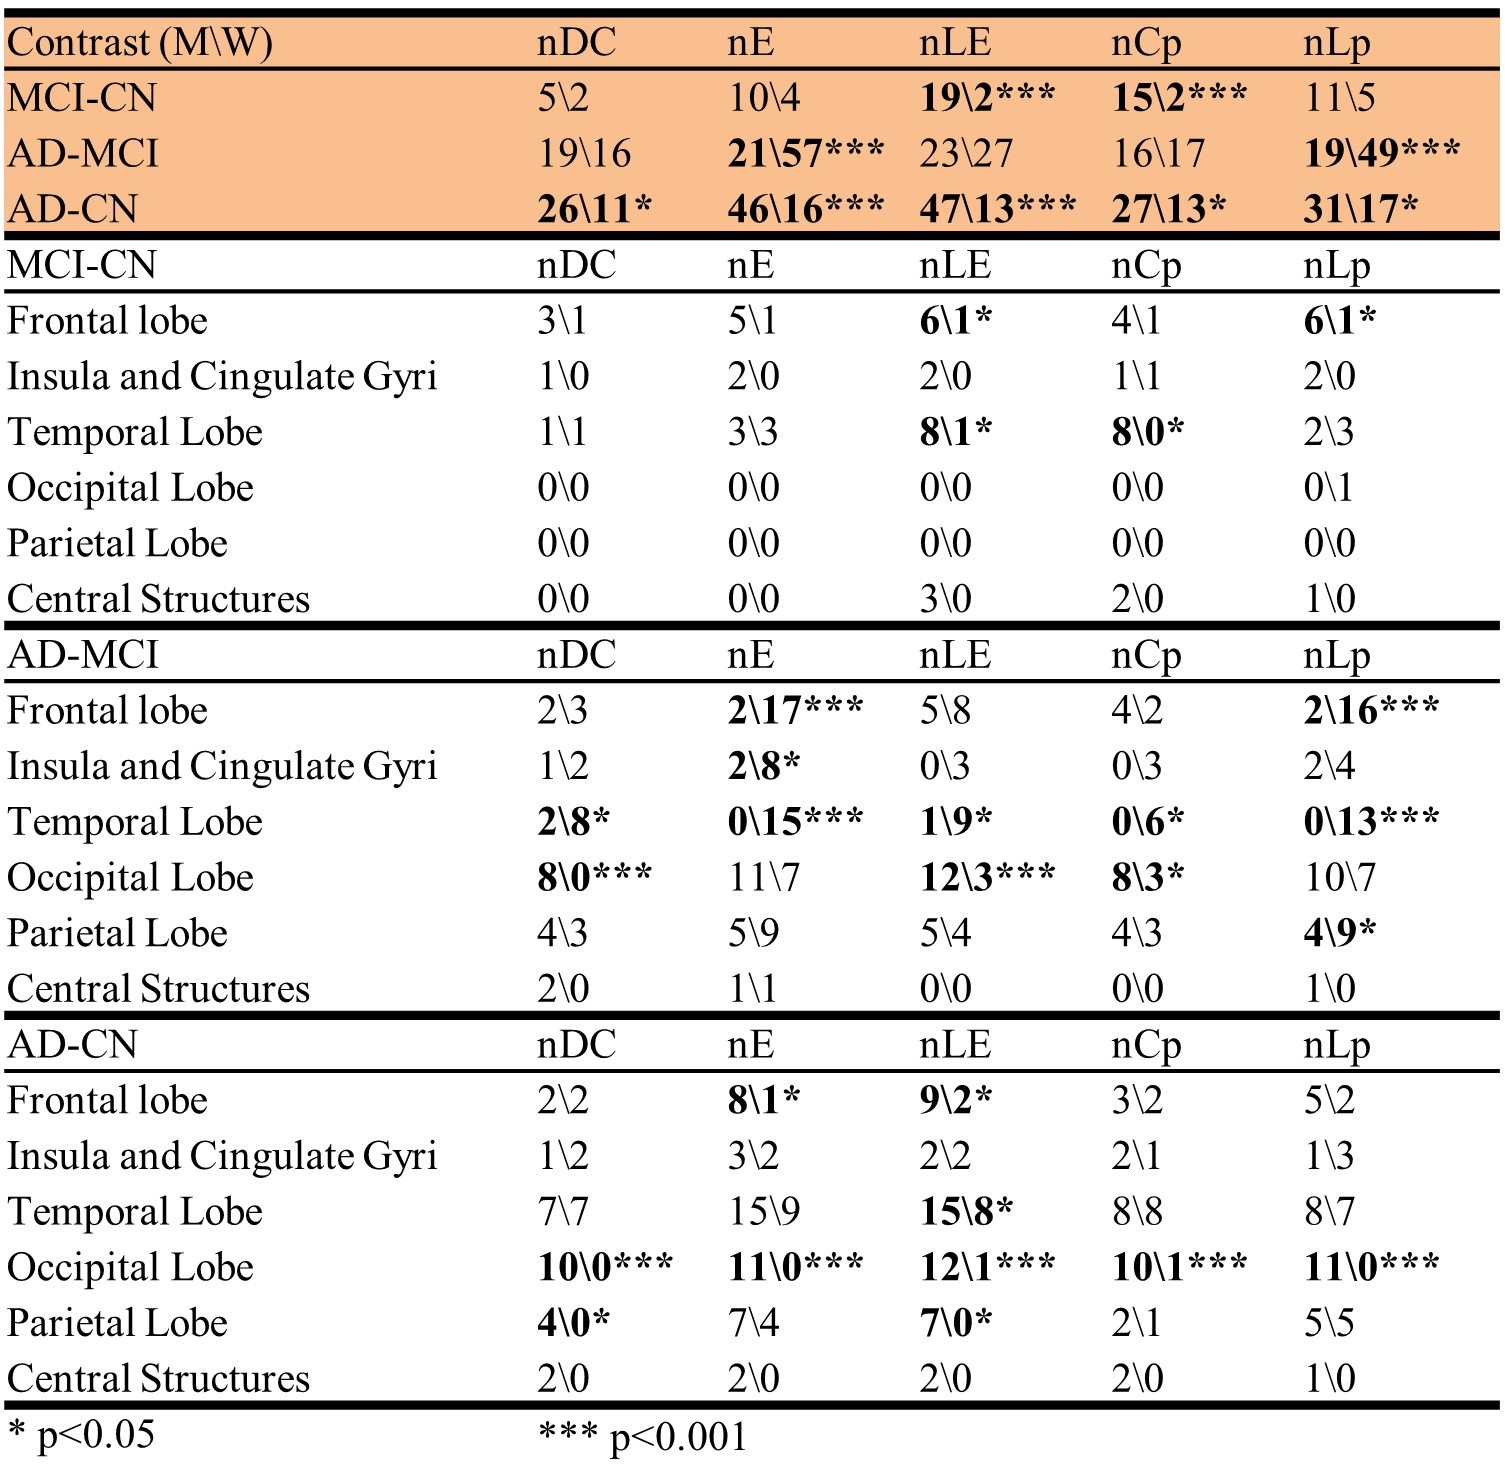
Table
2. Altered brain regions between diagnostic groups for women and men. Summary
of the number of nodes with |cohen’s d|≥ 0.5.
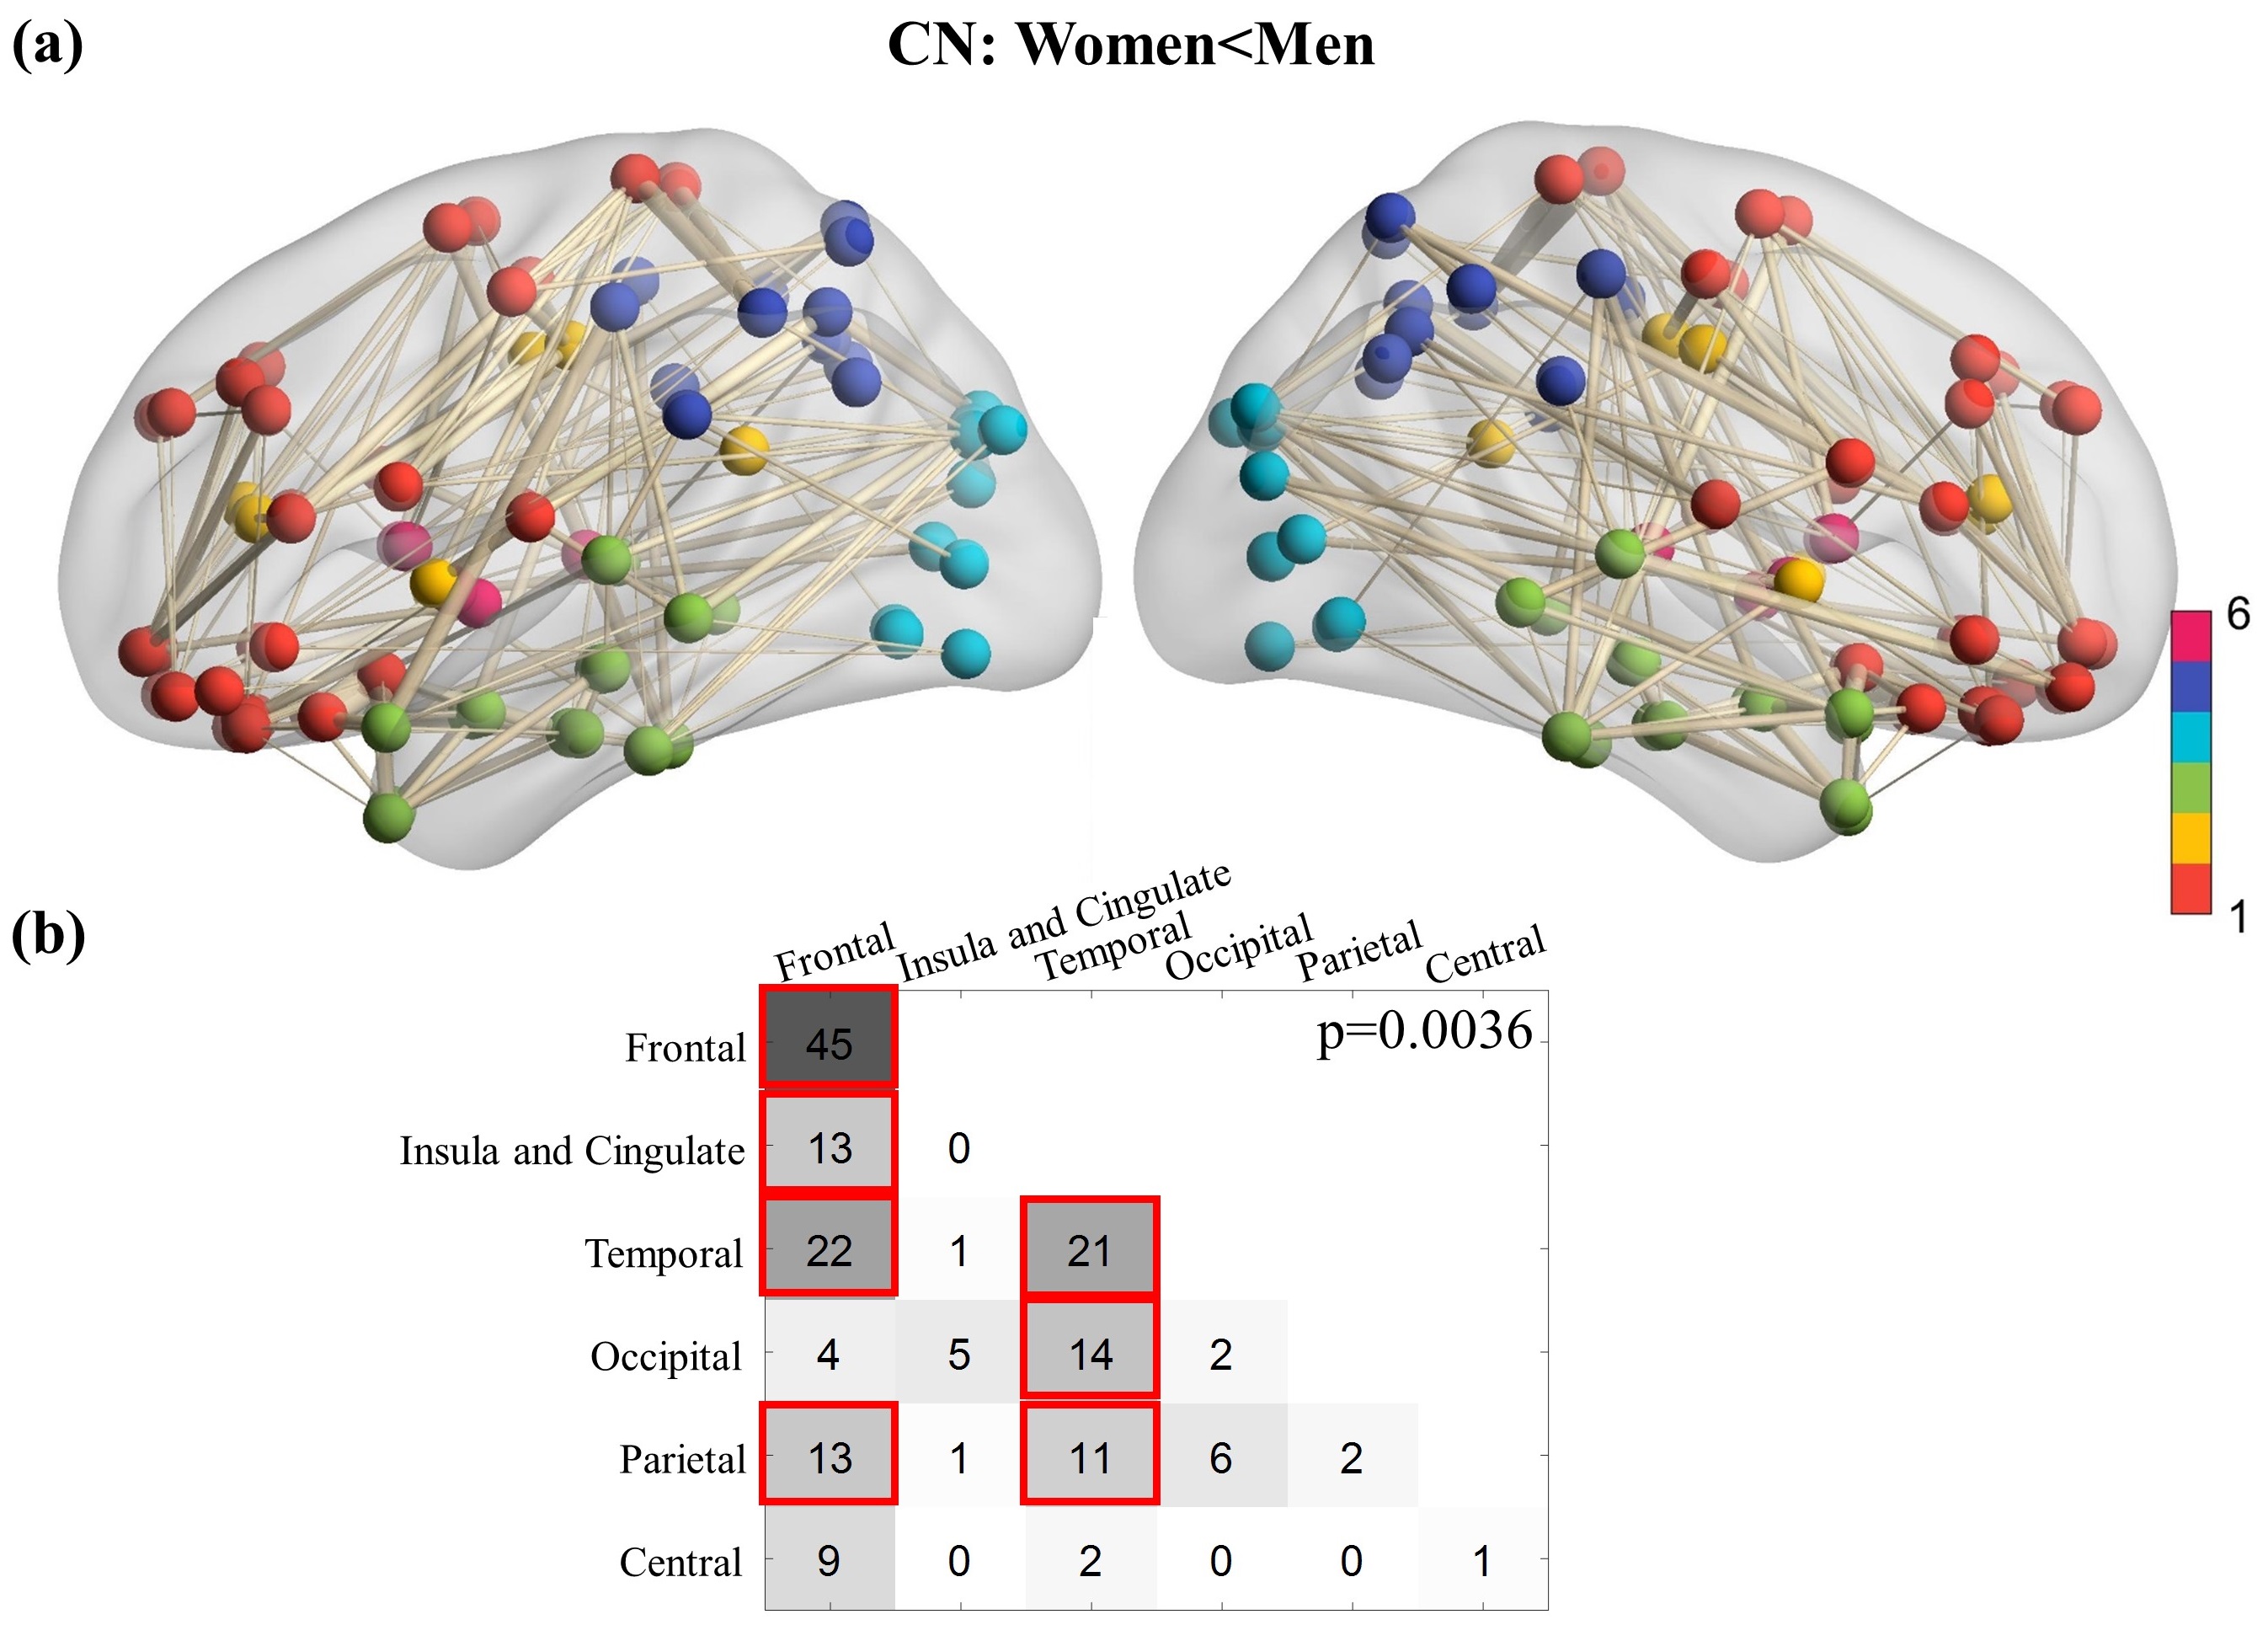
Figure
2. Cluster showing significantly lower functional connectivity in women than
men among CN subjects. There is no cluster showing significant functional
connectivity difference between women and men for the MCI and AD dementia
groups. (a) The cluster showing significantly lower functional connectivity in
women CN participants compared to men CN participants. (b) Summary of the
number of edges in the significant cluster. Red boxes are used to mark the
number of edges greater than 10.
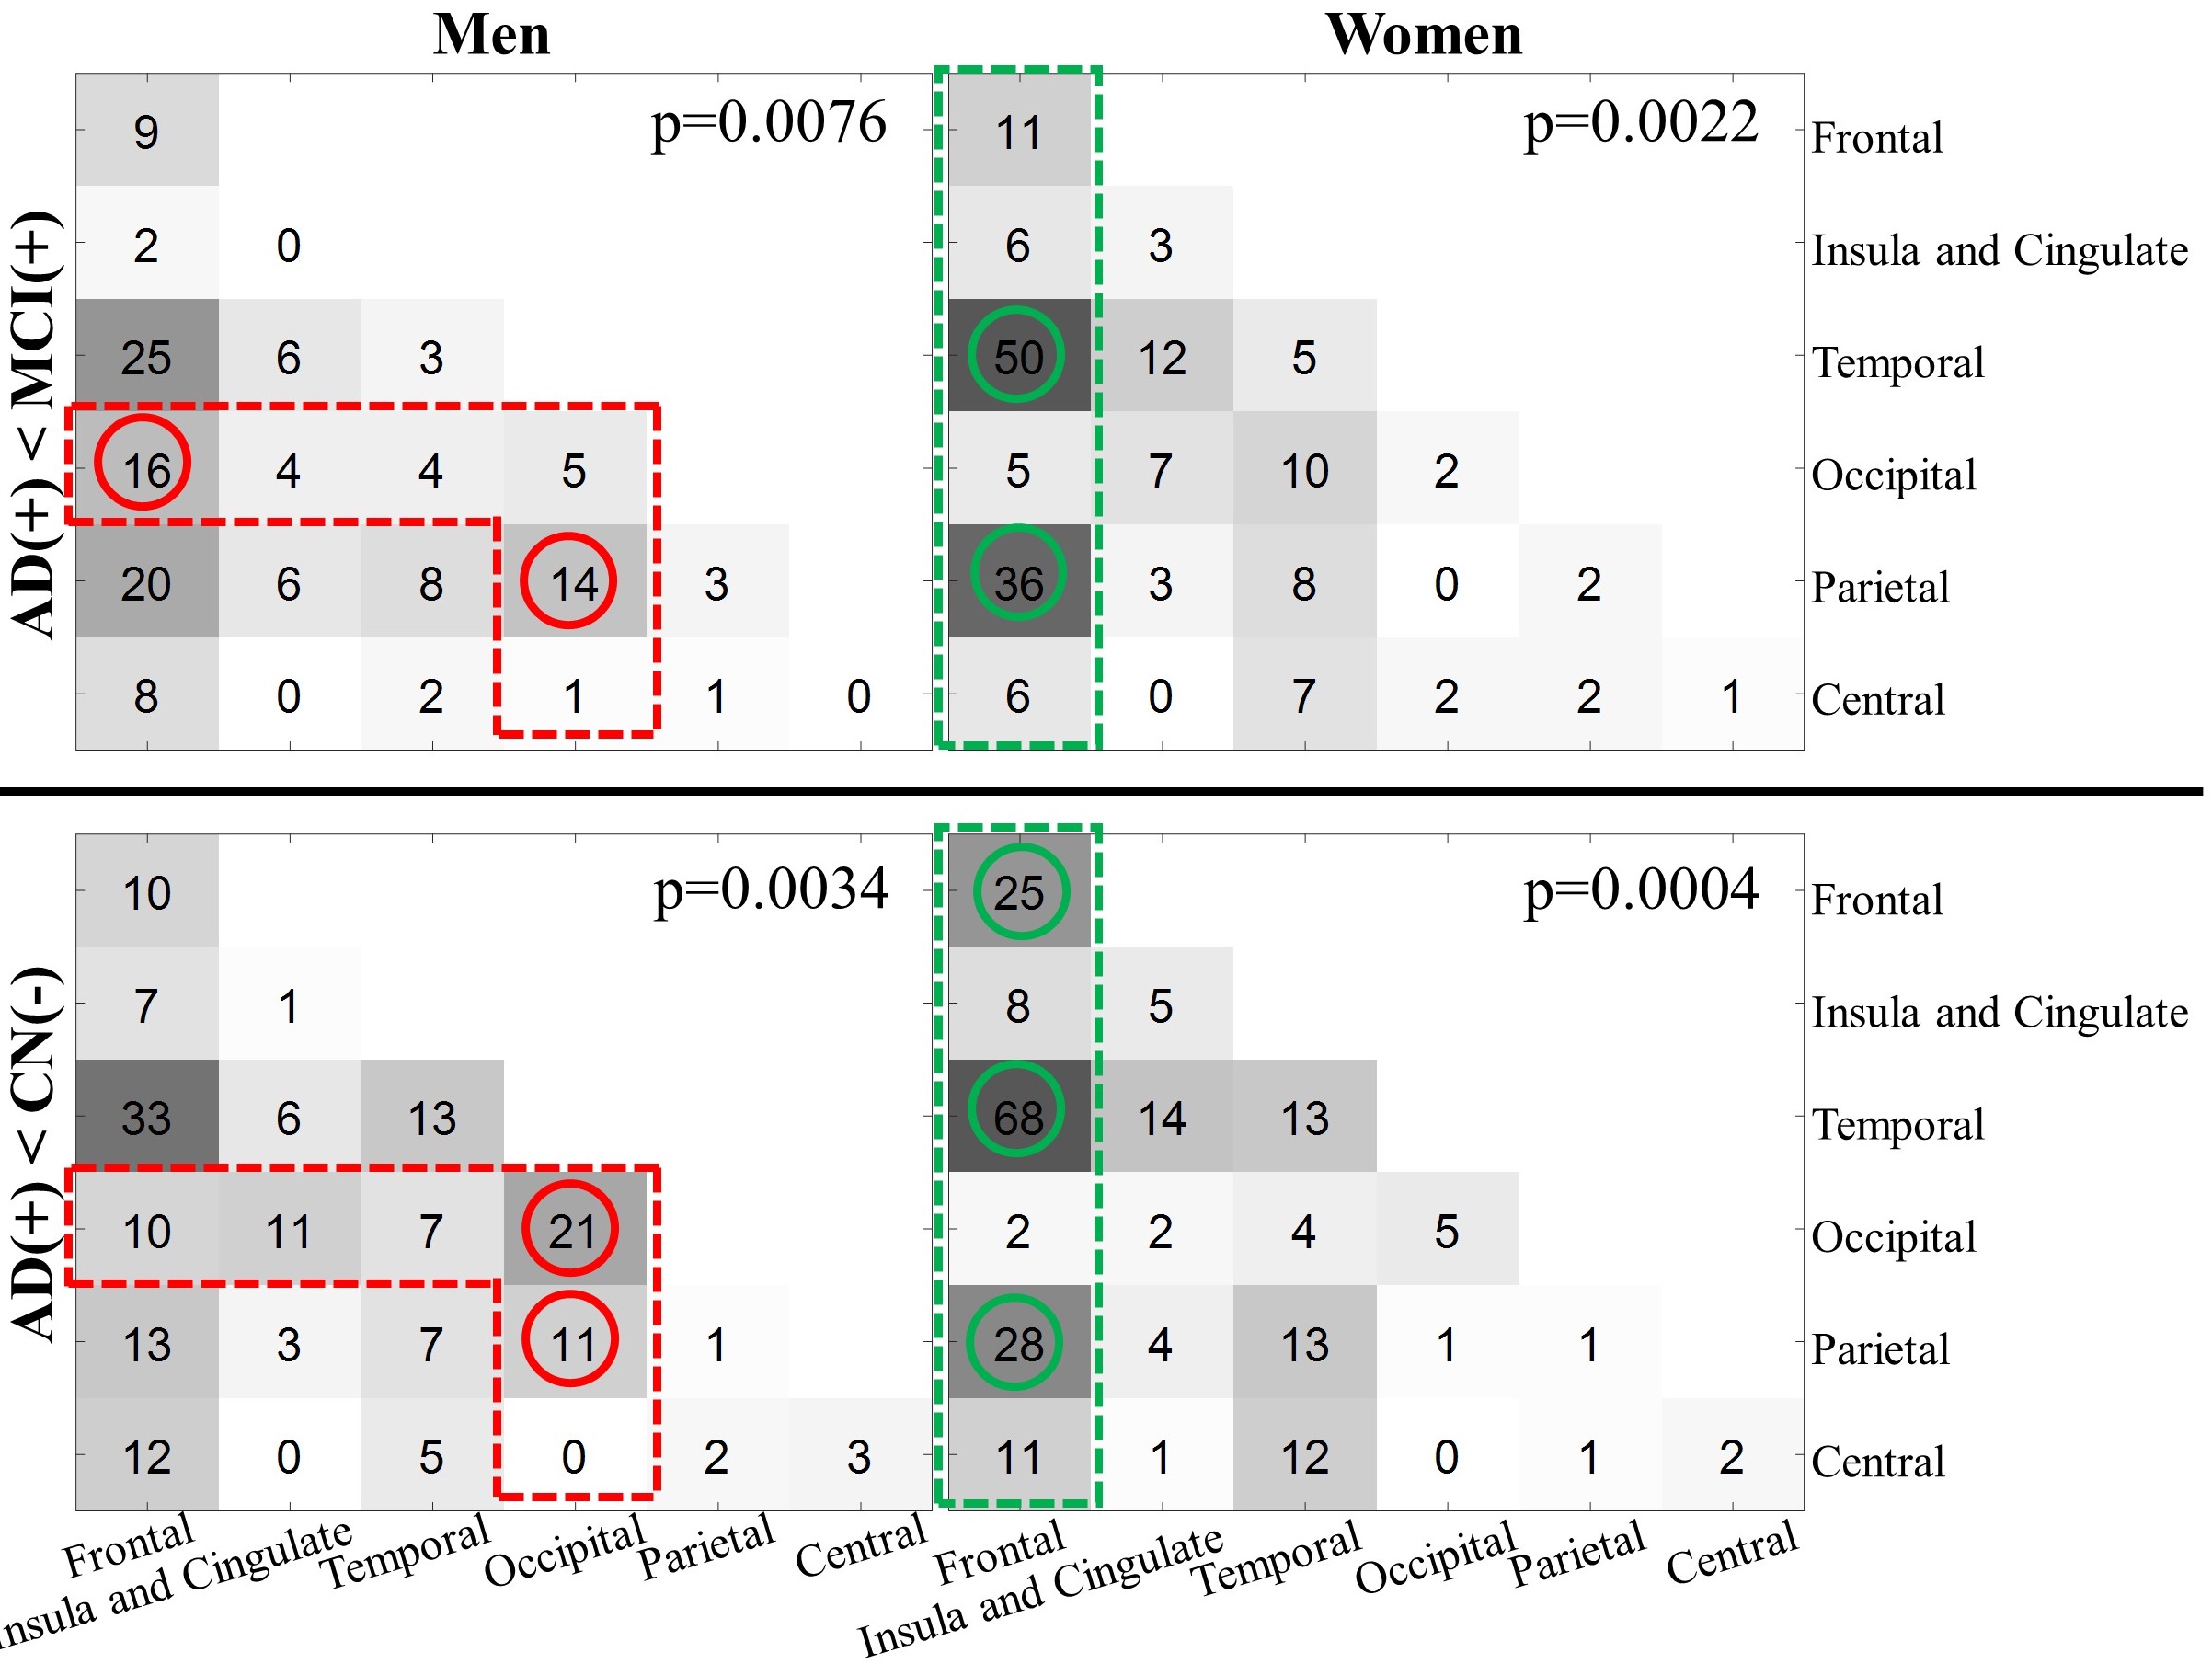
Figure
3. Summary of the edges in the significant clusters of contrast AD dementia
< MCI (top panel) and AD dementia < CN (bottom panel). Men and women
subjects are analyzed separately. The circles are used to mark the location
where women and men, for the same between-group contrast, have the difference
of the number of edges more than 10 (red: men>women; green: women>men).