1500
Reorganization of functional network topology in Parkinson’s disease patients with and without freezing of gait.
Karthik R Sreenivasan1, Xiaowei Zhuang1, Zhengshi Yang1, Dietmar Cordes1, Aaron Ritter1, Jessica Caldwell1, Zoltan Mari1, and Virendra Mishra1
1Cleveland Clinic Lou Ruvo Center for Brain Health, Las Vegas, NV, United States
1Cleveland Clinic Lou Ruvo Center for Brain Health, Las Vegas, NV, United States
Synopsis
Freezing-of-gait (FOG) can be attributed to overloading across neural networks in an attempt to compensate for reduced motor functions. Resting-state fMRI studies in Parkinson’s disease (PD) patients with FOG have implicated dysfunctional connectivity between cortical and subcortical regions over mainly the frontoparietal network, default mode, and visual networks. Our results suggest that despite not observing many global or local network differences there was a clear shift in the topological organization from occipital to frontal regions in both the PD-FOG patients and PD patients without FOG. Specifically, the PD-FOG groups showing significantly reduced rich-club connectivity when compared to the other groups.
Introduction
Freezing-of-gait (FOG) can be attributed to overloading across neural networks in an attempt to compensate for reduced motor functions1. This is in agreement with observational studies showing a correlation between gait variability and inability to “set-shift” among the different functional networks (e.g. motor and cognitive networks)2. Resting-state fMRI (rs-fMRI) studies in PD-FOG patients have implicated dysfunctional connectivity between cortical and subcortical regions over multiple resting-state networks (RSNs). Specifically, studies showed altered resting-state functional connectivity (rs-FC) involving mainly the frontoparietal network (FPN), default mode (DMN), and visual (VN) network and demonstrated that this disruption of connectivity between RSNs was correlated with FOG3,4. Despite the promising results of previous studies, there are some discrepancies in the results which remain to be clarified5. FOG in PD is considered one of the most debilitating motor symptoms and it is crucial to gain a better understanding of its pathophysiology. The goal of this study is to use rs-fMRI to explore and understand the topological organization of the RSNs in PD-FOG and PD patients without FOG (PD-nFOG).Methods
38 PD participants were recruited, and 17 participants were identified as PD-FOG and as 21 PD-nFOG. FOG was identified based on a self-report measure and a comprehensive battery of clinical testing and was confirmed by two movement disorders specialists and a physical therapist. Participants were classified to have FOG if they were observed to have a FOG episode during any of the clinical assessments for FOG. Participants were classified as PD-nFOG if there were no witnessed episodes of FOG. We included 20 normal controls (NCs) as a comparison group. All subjects underwent rs-fMRI scans and 850 volumes were acquired at a TR of 700 ms on a 3T Siemens scanner. A 32-channel head coil was used for data acquisition, and all PD participants were scanned in the clinically defined ‘ON’ state. After standard pre-processing, time series were extracted from 21 key cortical regions of interest (ROIs) belonging to the FPN, DMN, and VN6 (Figure 1). The connectivity between two ROIs was estimated using Pearson’s correlation between time-series, and subsequently, a connectivity matrix (21 x 21) was obtained for each subject. Various graph-theoretical properties were computed using GRETNA7 or in-house MATLAB scripts. Nonparametric statistical analyses of group differences between global and local network properties were then conducted using the permutation analysis of linear models (PALM) toolbox in FSL8. I addition to this, a rich-club analysis was performed to understand whether there was a functional reorganization of key network hubs in the different groups. All statistical measures were considered significant at family-wise error corrected p<0.05.Results
None of the demographic variables were significantly different between the groups (Table 1). Graph theory analysis showed that all groups (PD-FOG, PD-nFOG, and NC) demonstrated a small-world organization. There were no differences in any of the global network measures between the three groups. The left calcarine region showed reduced local efficiency in the PD-nFOG group when compared to NCs (Fig. 2). All three groups (NC, PD-nFOG, and PD-FOG) showed the presence of rich-club (Fig. 3a). In the NC group, the brain regions exhibiting rich-club properties were mostly VN (bilateral cuneus, lateral occipital, and calcarine) and DMN (bilateral posterior inferior parietal lobule) regions (Fig.3b). However, for the PD groups, the rich-club network was reorganized to include regions from the FPN and DMN. Specifically, in the PD groups bilateral anterior inferior parietal lobule, dorsolateral prefrontal cortex, and the posterior cingulate cortex showed rich-club properties. In the PD-FOG group, there were more VN regions (left cuneus, calcarine, and lateral occipital) that exhibited rich club properties than in the PD-nFOG group (only left cuneus) (Fig.3b). We also observed significantly different rich-club, feeder, and local network strength in PD groups when compared to the NCs (Fig.4). The NC group showed significantly higher rich-club and local network strength when compared to both the PD-FOG and PD-nFOG group; and higher feeder network strength than the PD-nFOG group (Fig.4). The PD-FOG groups showed significantly reduced rich-club network strength when compared to the PD-nFOG group (Fig.4).Discussion
The main findings of our study are (a) All three groups exhibited small-world topology, as reported previously9. (b) PD-nFOG patients showed decreased nodal local efficiency in the left calcarine region. (c) The rich-club analysis showed that all three groups while exhibiting a rich club organization showed different hub-like regions. Our results suggest that despite not observing many global or local network differences there was a clear shift in the topological organization from occipital to frontal regions in both the PD-FOG and PD-nFOG groups. Specifically, the PD-FOG groups showed significantly reduced rich-club connectivity when compared to the other groups which could lead to the disruption of within-network connectivity subsequently affecting dual-tasking and increasing the risk of FOG. Further studies to examine the relationship of functional connectivity with behavioral measures are underway.Acknowledgements
This study is supported by the National Institutes of Health (grant 1R01EB014284, R01NS117547, and P20GM109025), a private grant from the Peter and Angela Dal Pezzo funds, a private grant from Lynn and William Weidner, a private grant from Stacie and Chuck Matthewson and the Keep Memory Alive-Young Investigator Award (Keep Memory Alive Foundation).References
- Bluett B, Banks S, Cordes D, et al. Neuroimaging and neuropsychological assessment of freezing of gait in Parkinson's disease. Alzheimers Dement (N Y). 2018;4:387-394. Published 2018 Jun 13. doi:10.1016/j.trci.2018.04.010
- Naismith SL, Shine JM, Lewis SJ. The specific contributions of set-shifting to freezing of gait in Parkinson’s disease. Mov Disord 2010;25:1000–4.
- Bharti K, Suppa A, Tommasin S, et al. Neuroimaging advances in Parkinson's disease with freezing of gait: A systematic review. Neuroimage Clin. 2019;24:102059. doi:10.1016/j.nicl.2019.102059
- van Eimeren T, Monchi O, Ballanger B, Strafella AP. Dysfunction of the default mode network in Parkinson disease: a functional magnetic resonance imaging study. Arch Neurol. 2009;66(7):877–883. doi:10.1001/archneurol.2009.97
- Snijders AH, Takakusaki K, Debu B, et al. Physiology of freezing of gait. Ann Neurol. 2016;80(5):644-659. doi:10.1002/ana.24778.
- Klobušiaková P, Mareček R, Fousek J, Výtvarová E, Rektorová I. Connectivity Between Brain Networks Dynamically Reflects Cognitive Status of Parkinson's Disease: A Longitudinal Study. J Alzheimers Dis. 2019;67(3):971-984. doi:10.3233/JAD-180834
- J. Wang, X. Wang, M. Xia, X. Liao, A. Evans, Y. He, GRETNA: a graph theoretical network analysis toolbox for imaging connectomics, Front. Hum. Neurosci. 9 (2015) 386. doi:10.3389/fnhum.2015.00386.
- Winkler AM, Ridgway GR, Webster MA, Smith SM, Nichols TE. Permutation inference for the general linear model. Neuroimage 2014; 92: 381–397.
- Ruan X, Li Y, Li E, Xie F, Zhang G, Luo Z, Du Y, Jiang X, Li M, Wei X. Impaired Topographical Organization of Functional Brain Networks in Parkinson's Disease Patients With Freezing of Gait. Front Aging Neurosci. 2020 Oct 21;12:580564. doi: 10.3389/fnagi.2020.580564.
- M. Xia, J. Wang, Y. He, BrainNet Viewer: A Network Visualization Tool for Human Brain Connectomics, PLoS One. 8 (2013) e68910. doi:10.1371/journal.pone.0068910.
Figures
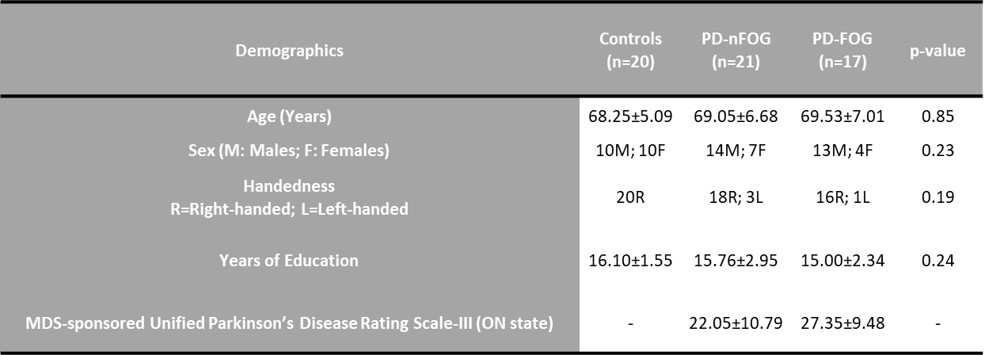
Table 1. Demographics. Various
demographics along with UPDRS in ON state (PD subjects only) are shown along
with their mean ± SD. Statistical comparison was conducted for every
demographic and the values are shown as p-values.
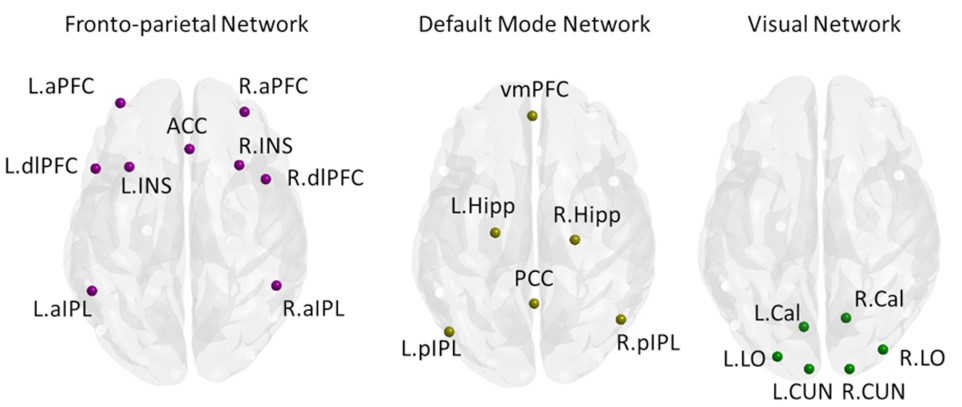
Figure 1. Regions of interest (ROIs) used in the current study. L – Left; R – Right.
aPFC-anterior prefrontal cortex; ACC-anterior cingulate cortex; aIPL-anterior
inferior parietal lobule; dlPFC-dorsal lateral prefrontal cortex; INS-insula; HF-hippocampus
formation; vmPFC-ventromedial prefrontal cortex; PCC-posterior cingulate
cortex; pIPL-posterior inferior parietal lobule; Cal-calcarine; CUN- cuneus; LO-lateral
occipital. Visualized using BrainNet Viewer10
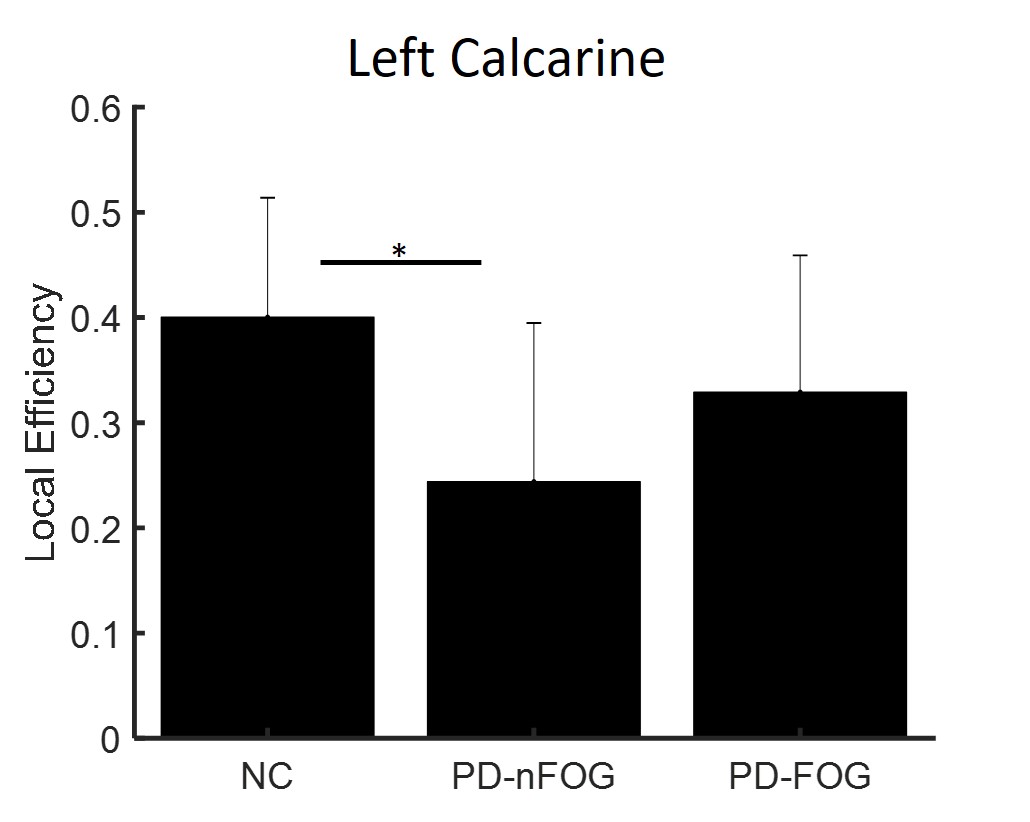
Figure 2. Reduced nodal network measure in PD-nFOG. Local efficiency of
the left calcarine region was significantly reduced in PD-nFOG when compared to
controls. * indicates statistical significance (pcorr<0.05).
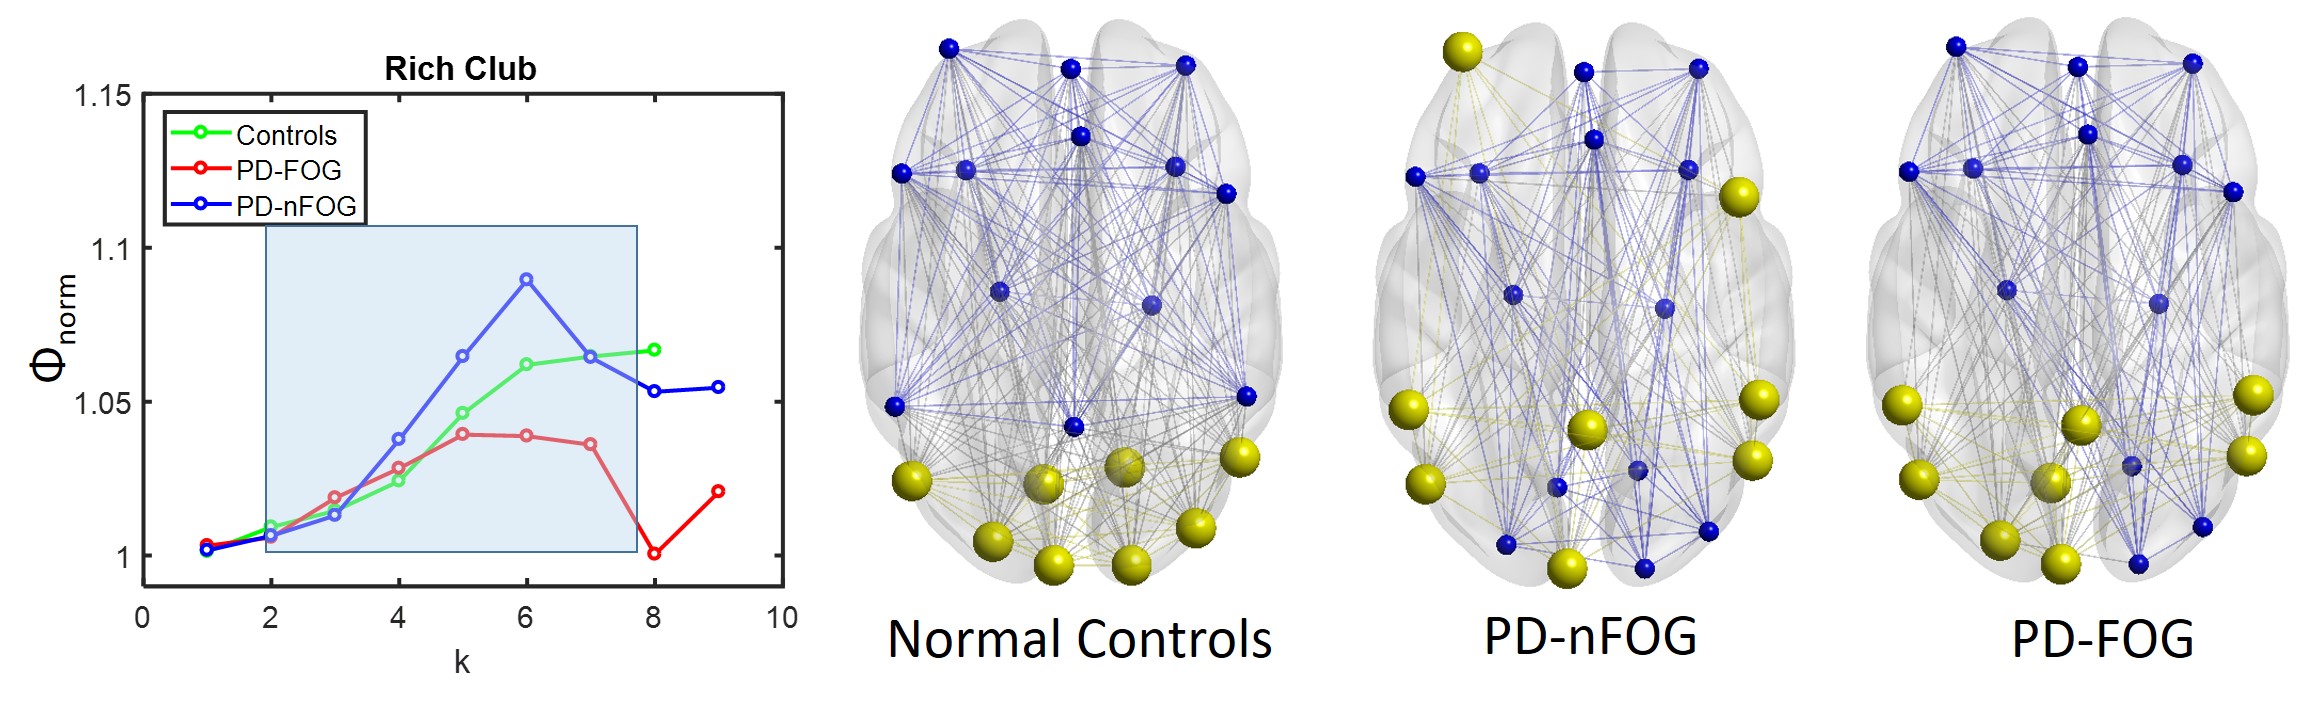
Figure 3. Rich-clubs are reorganized in the PD groups when compared to
controls. (A) The Rich-club regime for NC, PD-nFOG, and PD-FOG are shown in the blue-shaded
box. (B) Rich-club nodes are indicated in yellow color and non-rich-club nodes
are shown in blue color for NC, PD-nFOG, and PD-FOG. Red circle – default mode
network; purple circle – frontoparietal network; green circle – visual network.
‘k’ is the nodal degree. Visualized using BrainNet Viewer10
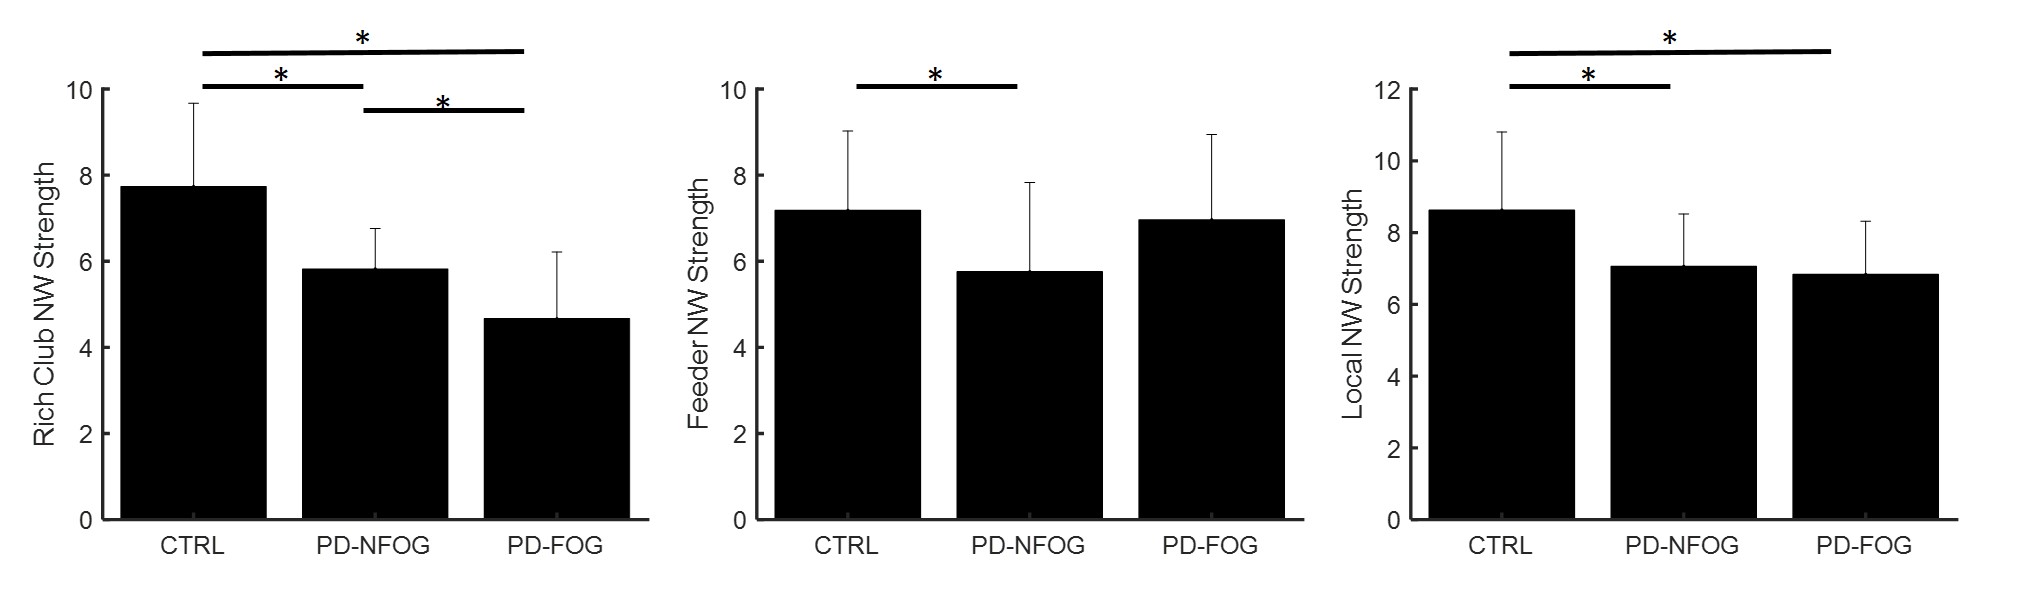
Figure 4. The difference in rich-club connectivity. Rich-club network strength,
feeder network strength, and local network strength are plotted as bar plots
for NC, PD-nFOG, and PD-FOG groups. Rich-club network – edges between rich-club
nodes; feeder network – edges connecting non-rich-club nodes and rich club
nodes; local network – edges between non-rich-club nodes. * indicates
statistical significance (pcorr<0.05)