1489
A comparison of recent motion-correction methods for CEST-MRI1Institute of Science and Technology for Brain-Inspired Intelligence, Fudan University, Shanghai, China
Synopsis
The motion in chemical exchange saturation transfer (CEST) image was overlooked in many published studies. Fortunately, several works have been reported to do motion correction for CEST processing. However, the performance of these methods has not been evaluated. The main purpose of this study is to compare the performance of these methods on motion correction for CEST imaging. We used NMSE, MCC, and UI to evaluate the performance of these methods. Our simulation and preliminary in-vivo data showed that the method of Reg2mean works the best.
Introduction
The quantification of CEST imaging is indispensable to analyze the exchangeable solute protons in vivo, such as proteins, peptides and many metabolites [1]. It was often overlooked that the motion of the CEST image can affect the quantification results. To date, several attempts have been made to address the problems. Zhang et al [2] proposed a comparative method via the registration CEST image to different reference images, and found that the reference image selection can affect the motion correction results. Tobias Wech et al [3] conducted a method independent of the reference layer to register CEST images to low-rank approximated images. Bie et al. [4] improved the previous method with a two-stage method of coarse registration and fine registration. However, the performance of these methods has not been evaluated. In this work, we aimed to compare the performance of these methods on motion correction for CEST quantification analysis.Methods
MRI: Four mice were imaged at a 11.7T BioSpec 117/16 USR MRI system equipped with a CryoProbe (Bruker BioSpin, Ettlingen, Germany). After a Localizer scanning, single-slice CEST images were obtained by a continuous wave (CW) RF irradiation followed by a RARE sequence to readout with parameters: matrix size =64×56, NA=1, FOV=16×14 mm, number of slices = 1. Z-spectra, presented as measured signals (Ssat) normalized by a reference signal (S0), were acquired with RF offsets from -3000 to -3000 Hz with a step of 75 Hz. S0 was obtained by setting the RF offset to 20000 Hz (40 ppm on 11.7 T).Simulation: The rigid transformation was simulated with the rotation and shift in the X and Y directions. The translation and rotation parameters in the X and Y directions with mean 0 and variance 1 were randomly generated, which applied to each CEST image at different offset. In order to enhance the robustness of the results, we carried out 10 repetitions of the simulation experiment.
Motion correction methods: For motion-correction methods each image acquired in a CEST scan was registered to different offset as reference images, including S0, mean image and ±3.5ppm. Because the simulation results were rigid motion, the rigid registration was used. In addition, we tested an iterative registration method using a low-rank approximate noise-reducing CEST image as a reference layer [3], which is not based on a specific reference layer. Here, the number of iterations was set to 20, and the proportion of singular values was set to 0.8, which usually guarantee reasonable results.
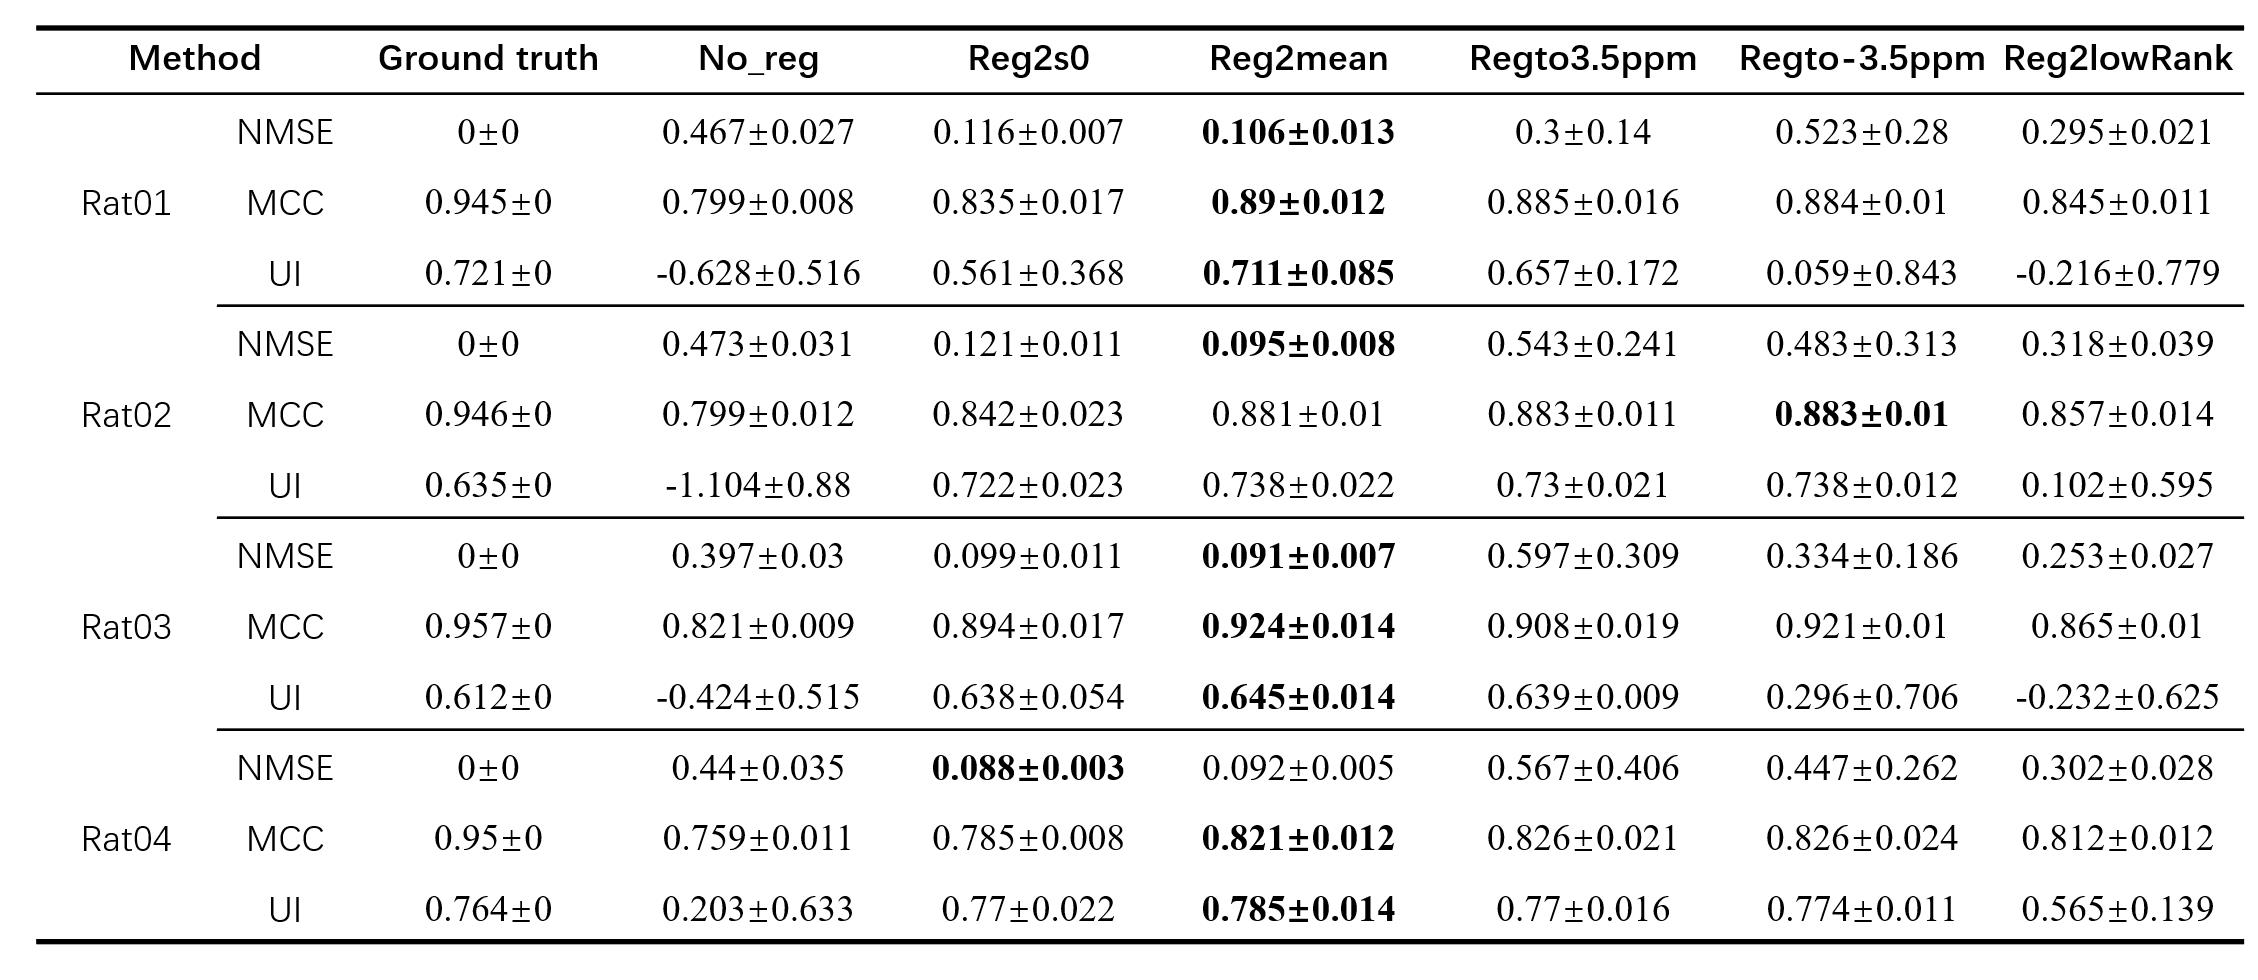
Evaluation metrics: For the simulated data, NMSE , MCC, and UI of amide proton transfer (APT) images were calculated to evaluate motion correction. The APT image at 3.5ppm was fitted by conventional magnetization transfer ratio (MTR) asymmetry analysis. These metrics are calculated as following:
$$NMSE(X,Y) = \frac{MSE(X,Y)}{MSE(X)}=\frac{||X-Y||_{2}^{2}}{||X||_{2}^{2}}$$;
$$MCC(X(\omega)) = \frac{1}{offset^{2}}\sum \limits_{k,j \in \omega} \frac{E((X(\omega_{k})-\mu_{X(\omega_{k})})((X(\omega_{j})-\mu_{X(\omega_{j})})))}{\sqrt{\sum_{i=1}^{n}(X(\omega_{k})-\mu_{X(\omega_{k})})(X(\omega_{j})-\mu_{X(\omega_{j})})}}$$
$$UI(X) = 1-MAD(X)=1-\frac{1}{N}\sum \limits_{i=1}^{n}|x_{i}-\mu(X)|$$
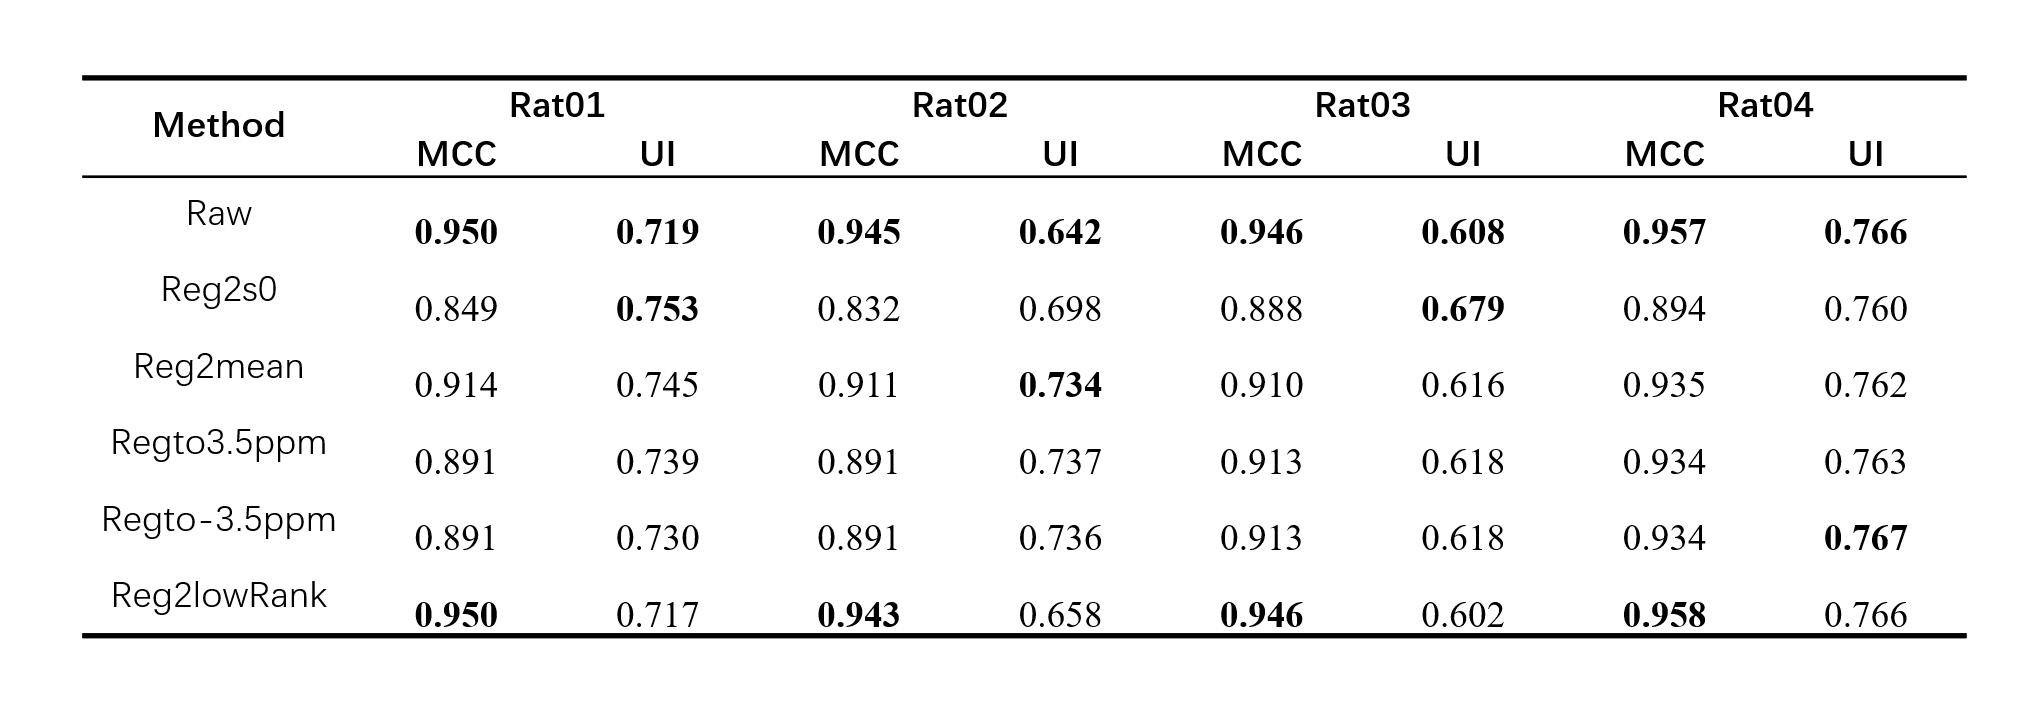
Among them, NMSE is the normalized MSE calculated by before and after motion-correction;MCC is the mean value of pearson correlation coefficient among each offset image and UI is calculated according to mean absolute deviation of APT. The images with lower NMSE and higher MCC and UI are thought of having less motion artifacts. For the in vivo experiment, only MCC and UI were calculated since there was no ground truth.
Results and Discussion
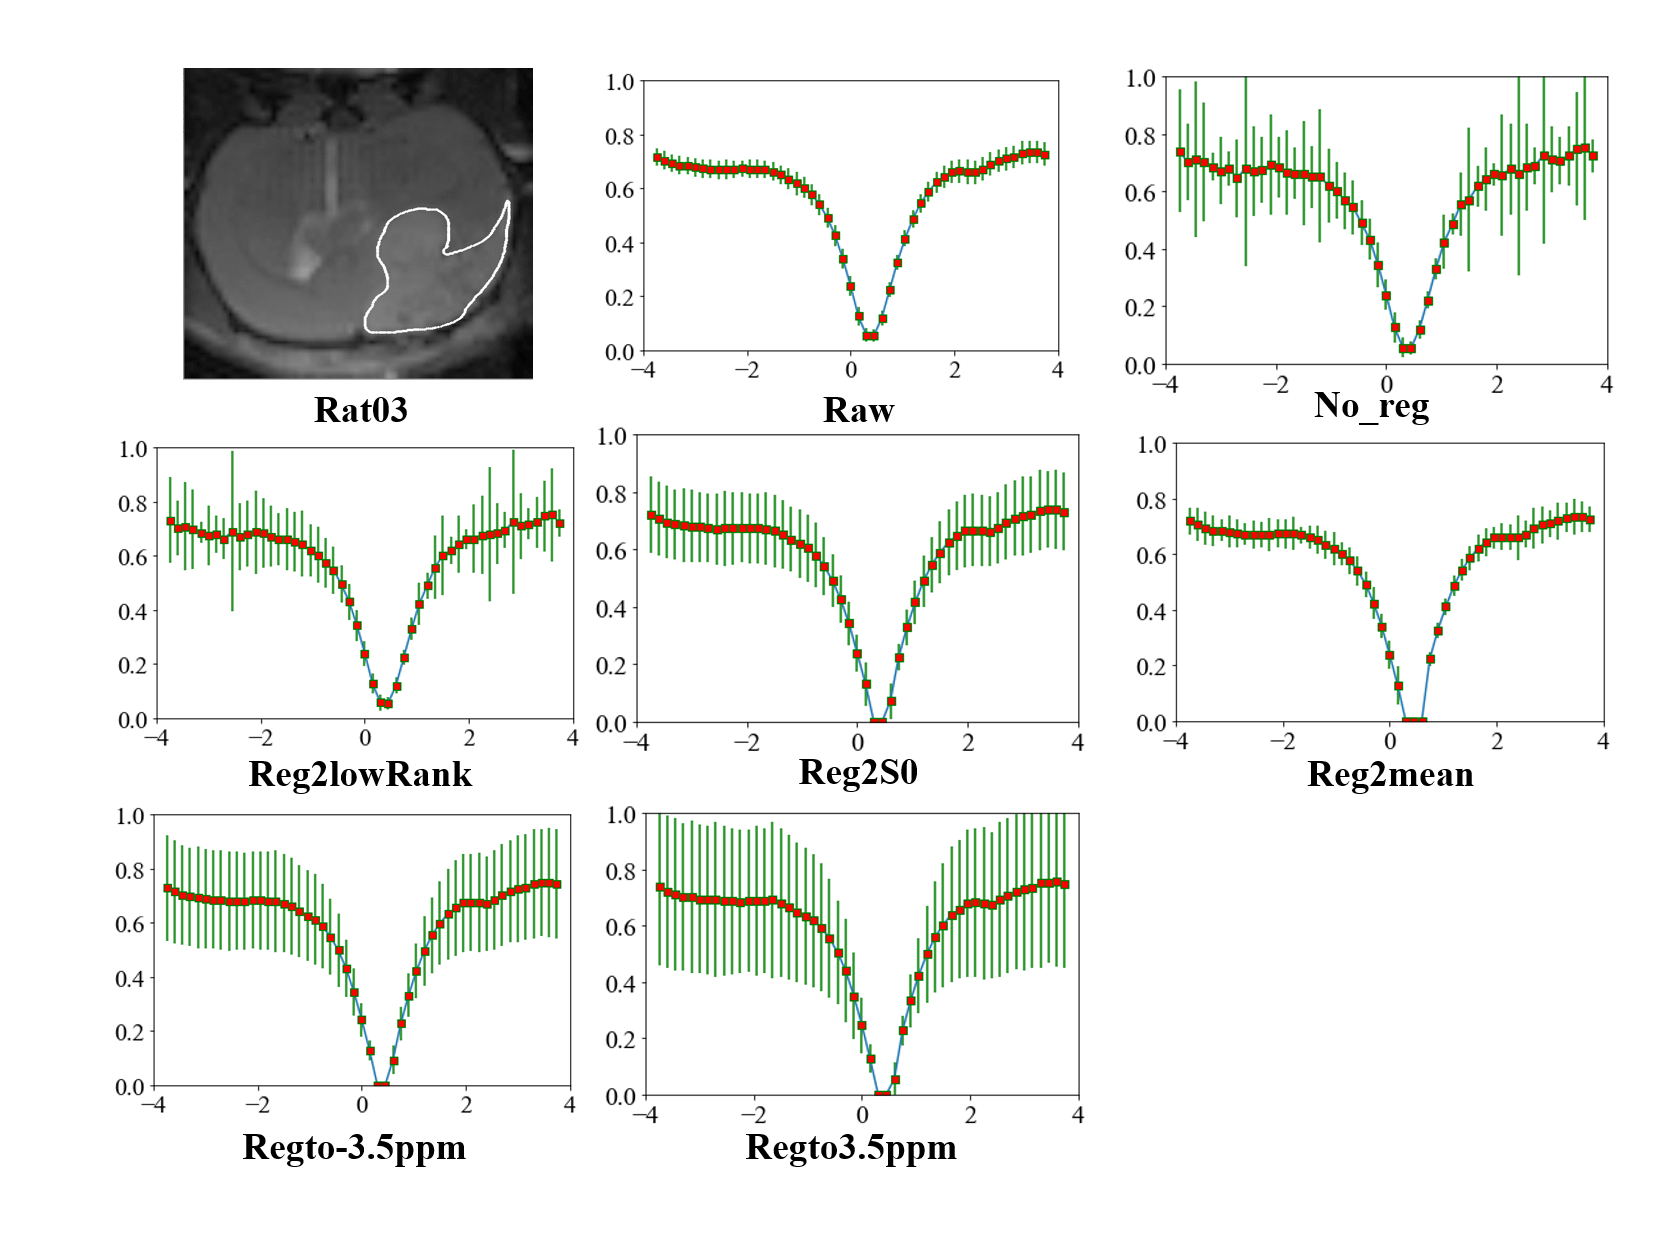
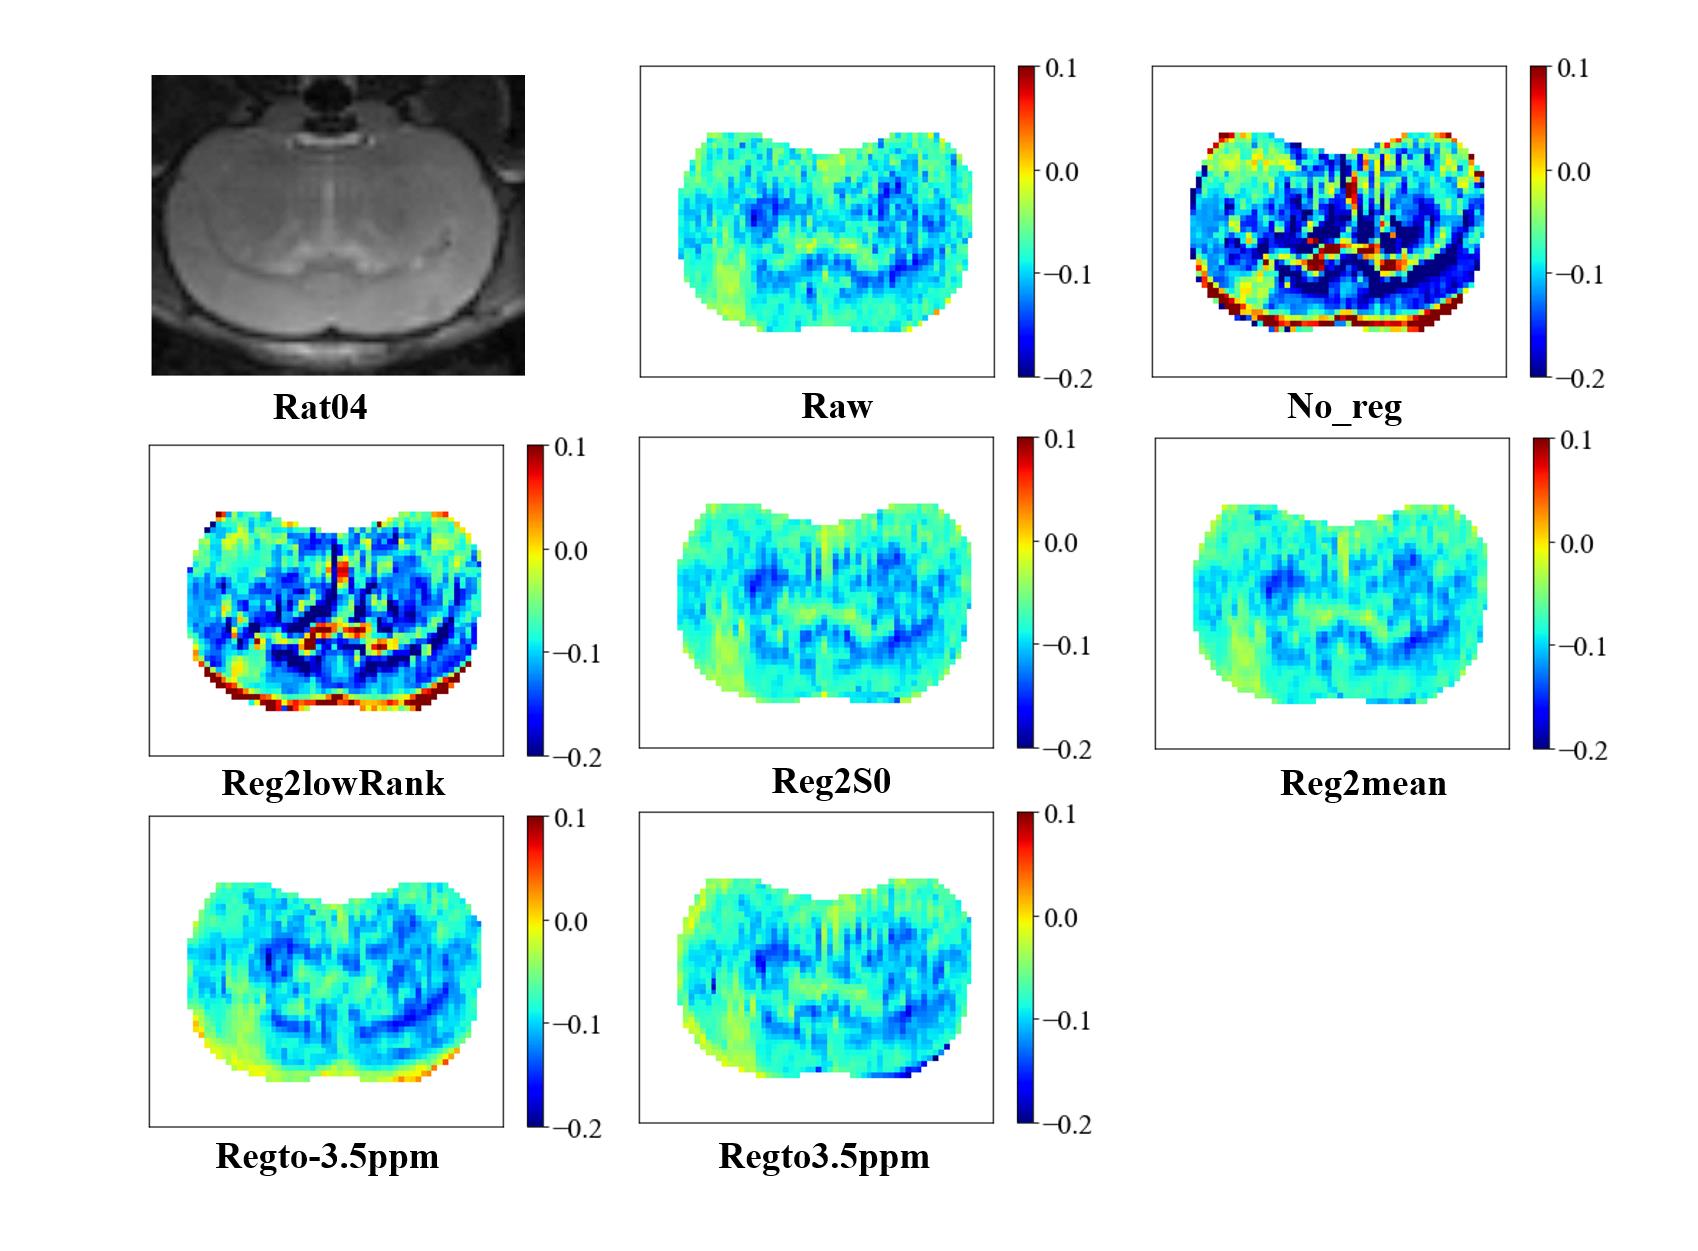
As shown in Table 1, Fig. 1, Fig. 2, after adding motion artifacts, the new images show a big difference from the original image in NMSE, MCC and UI,, and the added motion artifacts are significantly corrected by several motion-correction methods. Among them, the method of Reg2mean performs the best in all metrics except for MCC of Rat02, which is confirmed by the plotted Z spectra of the tumor region. The in vivo experimental results are shown in Table 2. The methods of registration to a certain reference image significantly reduce MCC for the motion artifacts, but its UI is improved. The method of iterative registration to low-rank approximation of the image shows that both MCC and UI do not change too much. But, the method of Reg2mean is stable when UI and MCC are considered together. To be noticed, a big difference exists between the simulation results and the in-vivo experiment data when the metrics, NMSE, UI, and MCC, are considered. The possible reason is that motion artifacts of real in-vivo data are different from the simulations.Conclusion
We compared several motion correction methods and found that the Reg2mean works the best for both simulated and in-vivo experiment data.Acknowledgements
This study was supported in part by grants from the Shanghai Municipal Science and Technology Major Project (2018SHZDZX01), Three-year action plan for key global partners (IDH6282008/050/001/004) and the National Natural Science Foundation of China (81873893).References
[1] van Zijl PC, Yadav NN. Chemical exchange saturation transfer (CEST): what is in a name and what isn't? Magn Reson Med. 2011 Apr;65(4):927-48. doi: 10.1002/mrm.22761. Epub 2011 Feb 17. PMID: 21337419; PMCID: PMC3148076.
[2] Zhang Y, Heo HY, Lee DH, Zhao X, Jiang S, Zhang K, Li H, Zhou J. Selecting the reference image for registration of CEST series. J Magn Reson Imaging. 2016 Mar;43(3):756-61. doi: 10.1002/jmri.25027. Epub 2015 Aug 13. PMID: 26268435; PMCID: PMC4752933.
[3] Wech T, Köstler H. Robust motion correction in CEST imaging exploiting low-rank approximation of the z-spectrum. Magn Reson Med. 2018 Nov;80(5):1979-1988. doi: 10.1002/mrm.27206. Epub 2018 Apr 15. PMID: 29656510.
[4] Bie C, Liang Y, Zhang L, Zhao Y, Chen Y, Zhang X, He X, Song X. Motion correction of chemical exchange saturation transfer MRI series using robust principal component analysis (RPCA) and PCA. Quant Imaging Med Surg. 2019 Oct;9(10):1697-1713. doi: 10.21037/qims.2019.09.14. PMID: 31728313; PMCID: PMC6828584.
Figures