1488
Glutamine contribution to GluCEST at 7.0T1Radiology, University of Pennsylvania, Philadelphia, PA, United States, 2Research Branch, Sidra Medical and Research Center, Doha, Qatar
Synopsis
Glutamate chemical exchange saturation transfer (GluCEST) is an emerging imaging technique and in the recent years has shown promising applications in Alzheimer’s, Parkinson’s, Epilepsy, Brain tumors and Schizophrenia. Due to structural similarity of glutamine with glutamate, often there is a misconception of glutamine contribution to CEST effect of glutamate. In this study, we investigated the glutamine contribution to glutamate CEST at 3ppm offset.
INTRODUCTION
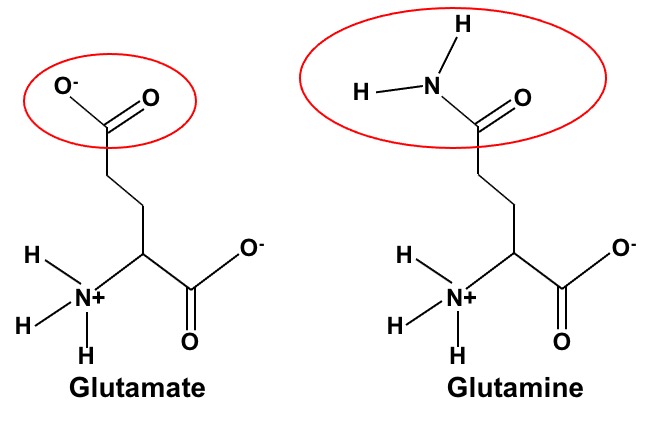
Chemical exchange saturation transfer (CEST) imaging of glutamate (GluCEST) is a new imaging technique that has gained importance as an in vivo neuroimaging biomarker in the recent years1-11. One question that often arises is the contribution of glutamine to gluCEST due to its structural similarity with glutamate as shown in Figure 1, with the former having the amide group instead of carboxylate in the side chain compared to the latter. To address this important question, we have performed the CEST experiments of glutamate and glutamine phantoms at 7.0T and the results are presented here.METHODS
Phantom Studies: Separate samples of 10 mM glutamate and 10mM glutamine phantom were prepared in phosphate buffer saline (PBS) and then the pH of the final solution was adjusted to 7. The samples were then transferred into the NMR tube (10 mm in diameter), which were immersed into a large cylindrical PBS phantom. The actual study protocol consisted of the following steps: a localizer, WASSR12, CEST acquisitions and B1 data collection. For WASSR acquisitions, offsets of -0.5 to +0.5ppm with step size of 0.05ppm was collected at a 200ms saturation pulse train (SPT) with B1rms of 0.29μT. For CEST acquisitions, offset ranges were ±2.6 to ±3.4ppm with 0.2ppm step-size, with a 2000ms SPT and at B1rms of 4.2μT. All the acquisitions were performed on the phantom at 37±0.5 °C on 7.0T Siemens Scanner using 32-channel phased array head coil.Data analysis: All the CEST data analysis was performed using in-house programs written in MATLAB. Relative B1 map was from the two images obtained using square preparation pulses with flip angles 30° and 60°. B0 map was computed using WASSR data12. CEST effect of the solute spins (exchangeable protons of interest from metabolite, here it is at 3ppm) is computed generally by using the following equation:
CEST(%)=100*[Msat(-Δω) – Msat(+Δω)]/ Msat(-Δω),
where Msat (±Δω) are the water magnetization obtained with saturation at a ‘+’ or ‘–’ Δω offset of the water resonance.
RESULTS
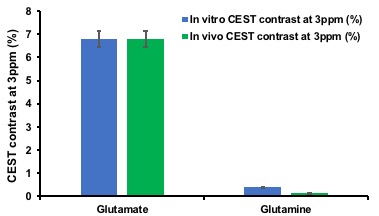
For both the phantoms, B0 inhomogeneity was less than <0.1 ppm and relative B1 varied from ~0.9-1.1 for the pixels from within the region of interest. Figure 2 shows the histogram of the CEST contrast from glutamate and glutamine phantom at 3ppm which were 6.8% and 0.4%, respectively in blue color while the once scaled from the same phantoms for the in vivo physiological concentration (Glutamate 10mM; Glutamine 4mM) is shown in green color.DISCUSSION
As shown in Figure 2 at a B1rms of 4.2μT and 2s pulse duration, 0.68% per mM of Glutamate and 0.04% per mM of Glutamine were observed, which is comparable to the already published results1,13 as shown in Figure 3, taking into the consideration the in vivo physiological concentration in brain.CONCLUSION
Since the in vivo brain glutamine levels are in the order of ~2 to 4mM, the contribution of glutamine amine proton at 3ppm would be of the order of ~ 0.08-0.16% to glutamate CEST based on the experiments we have done here. These results are consistent with the previously published studies1,13. Hence, from the experiments done here glutamine amine proton contribution to glutamate CEST at 3ppm offset is only of the order of <3%. Therefore, in in vivo conditions a change in 1-2mM of glutamine would not have appreciable effect on the Glutamate contrast at 3ppm.Acknowledgements
This project was supported by the National Institute of Biomedical Imaging and Bioengineering of the National Institute of Health through grant number p41-EB015893 and the National Institute of Neurological Disorders and Stroke through grant number R01NS087516.References
1. Cai K, Haris M, Singh A, et al. Magnetic resonance imaging of glutamate. Nat Med. 2012;18(2):302-6.
2. Singh A, Cai K, Haris M, et al. On B1 inhomogeneity correction of in vivo human brain glutamate chemical exchange saturation transfer contrast at 7T. Magn Reson Med. 2013;69(3):818-24.
3. Haris M, Nath K, Cai K, et al. Imaging of glutamate neurotransmitter alterations in Alzheimer's disease. NMR Biomed. 2013;26(4):386-91.
4. Crescenzi R, DeBrosse C, Nanga RPR, et al. In vivo measurement of glutamate loss is associated with synapse loss in a mouse model of tauopathy. Neuroimage. 2014;101:185-92.
5. Haris M, Singh A, Mohammed I, et al. In vivo magnetic resonance imaging of tumor protease activity. Sci Rep. 2014;4:6081.
6. Wermter FC, Bock C, Dreher W. Investigating GluCEST and its specificity for pH mapping at low temperatures. NMR Biomed. 2015;28(11):1507-17.
7. Davis KA, Nanga RPR, Das S, et al. Glutamate imaging (GluCEST) lateralizes epileptic foci in nonlesional temporal lobe epilepsy. Sci Transl Med. 2015;7(309):309ra161.
8. Pepin J, Francelle L, Carrillo-de Sauvage MA, et al. In vivo imaging of brain glutamate defects in a knock-in mouse model of Huntington's disease. Neuroimage. 2016;139:53-64.
9. Bagga P, Crescenzi R, Krishnamoorthy G, et al. Mapping the alterations in glutamate with GluCEST MRI in a mouse model of dopamine deficiency. J Neurochem. 2016;139(3):432-439.
10. Crescenzi R, DeBrosse C, Nanga RPR, et al. Longitudinal imaging reveals subhippocampal dynamics in glutamate levels associated with histopathologic events in a mouse model of tauopathy and healthy mice.Hippocampus. 2017;27(3):285-302.
11. Roalf DR, Nanga RPR, Rupert PE, et al. Glutamate imaging (GluCEST) reveals lower brain GluCEST contrast in patients on the psychosis spectrum. Mol Psychiatry. 2017;22(9):1298-1305.
12. Kim M, Gillen J, Landman BA, et al. Water saturation shift referencing (WASSR) for chemical exchange saturation transfer (CEST) experiments. Magn Reson Med. 2009;61(6):1441-50.
13. Harris RJ, Cloughesy TF, Liau, LM, et al. pH-weighted molecular imaging of gliomas using amine chemical exchange saturation transfer MRI. Neuro Oncol. 2015;17(11):1514-1524.
Figures