1483
Toward more specific imaging of fibrosis: The z-spectrum of collagen1University of Nottingham, Nottingham, United Kingdom
Synopsis
We have characterized the z-spectrum of collagen at 3T and 7T. We found two peaks +1.9 ppm and at +3.5 ppm and fitting to the Bloch McConnell equations yielded pool sizes that increased monotonically with concentration.
Introduction
Extra cellular matrix (ECM) changes are key to many disease processes. Fibrosis is the end product of chronic inflammation and is implicated in 45% of deaths in the industrial world. It is a dynamic process involving initial deposition of fibrin and subsequent built up of collagen. Fibrosis invariably co-exists with inflammation but despite MRI being a gold-standard for the measurement of inflammation, non-invasive quantification of fibrosis remains the holy grail across a number of disease processes.Crohn’s disease (CD) is an inflammatory bowel disease which is commonly associated with fibrosis, leading to bowel strictures invariably requiring surgery [1]. Medical treatment is aimed at treating inflammation so an accurate measure of inflammation and fibrosis would be a huge step change in clinical medicine. However no imaging markers of fibrosis exist.
The magnetisation transfer ratio correlates with bowel fibrosis scores in rat models and in humans [2], but such measurements are not very specific and are not robust in the abdomen due to variations in B1 and B0. The z-spectrum has the potential to provide more specific markers of the components of fibrosis, and indeed previous work at 16.4T has reported a broad asymmetric z-spectrum from collagen[3]. Z-spectrum analysis can also corrected for field inhomogeneities in the abdomen.
Aims
To fully characterise the z-spectrum of a collagen phantom at 3T and 7T in terms of pool sizes, exchange rate, and apparent T2 of the exchanging pools.Methods
Six small plastic balls were filled with 0%, 1%, 10%, 20%, 30% and 40% concentrations of pure bovine collagen peptide powder dissolved in distilled water. These were placed in a larger spherical phantom filled with agar. The phantom was kept in a fridge at 4oC between experiments.Z-spectra were acquired using a 3T Ingenia system with a 32ch receiver head coil, single channel transmit, and a 7T Achieva system with a NOVA 32ch receive, 8ch pTx head coil. The z-spectrum was sampled between ±10,000 Hz at 42 frequencies for 3T and 60 frequencies for 7T. A 3D-TFE readout was used for imaging (3T: 1x1x5mm3; 7T: 2x2x2mm3). The saturation consisted of 20 Gaussian-windowed sinc pulses in 1.2s for 3T and 3s semi-continuous wave saturation generated using the 8 pTx for 7T. B0 and B1 maps were also acquired.
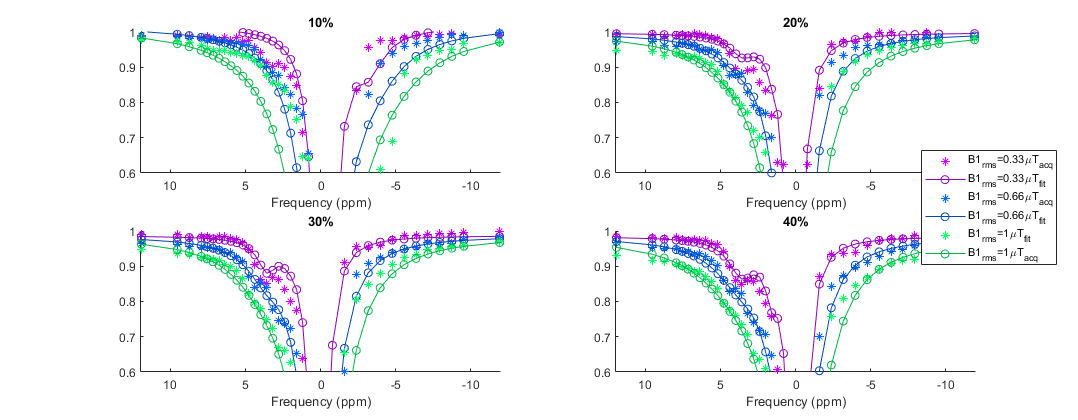
Each collagen phantom was masked on the images and used to create normalised z-spectra (Figs 1 and 2). The spectra were fitted to a five-pool model: free water, MT, NOE, and two peaks located at about +1.9 ppm and +3.5 ppm, respectively NH2 group (amine) and NH group (amide). This was done using the full Bloch-McConnell equations (BME) assuming a continuous wave saturation corrected for the measured B1. B0 shifts were negligible in the spherical phantom (3±7Hz at 7T and 15±9Hz at 3T). A particle swarm algorithm[4] was used for the fit: initially a full search of the parameters was performed and then refinement was carried out on each pool separately, before a final fit including all pools. This was repeated 1000 times and the median of the best 100 fits was taken. Only pool sizes are reported here.
Results
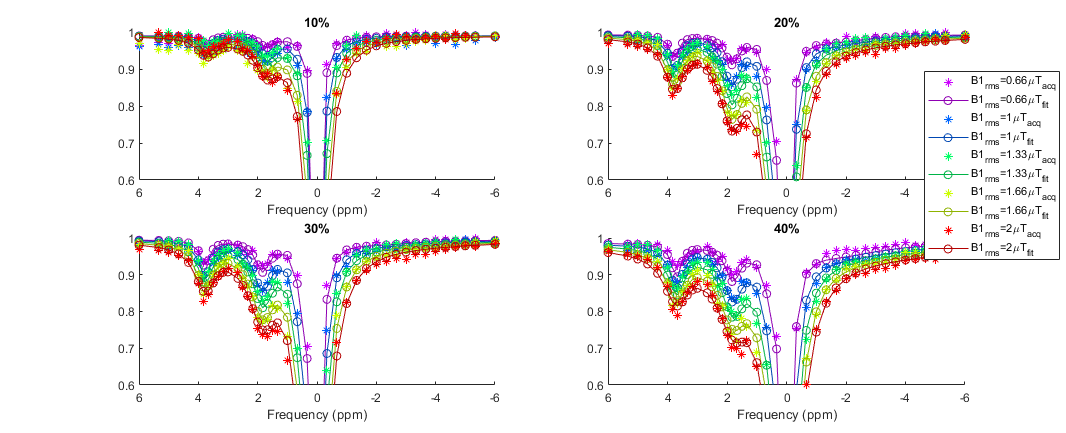
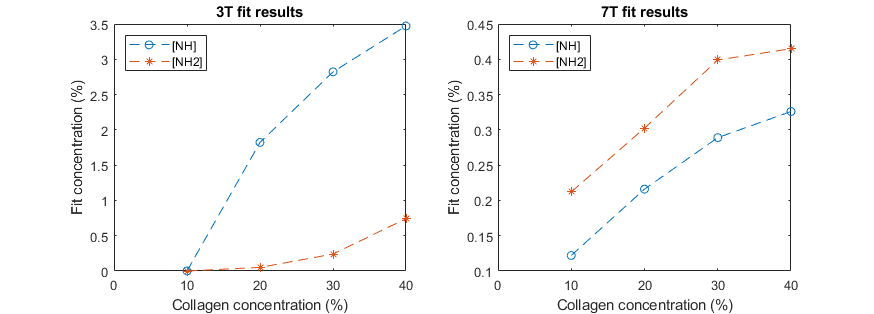
Raw spectra overlaid with the fit are displayed in Figure 1 (3T) and Figure 2 (7T). We were able to identify two different peaks in the collagen spectra at +1.9 ppm (NH2) and at +3.5 ppm (NH), with a good correlation between collagen concentration and both amide and amine concentration at 7T (Figure 3). The ratio between measured amide and amine varied between 3T and 7T, probably due to more prominent direct saturation effects at 3T. No change was detected in the observed T1 with concentration at either field strength (1.98±0.04s and 1.97±0.02s at 3T and 7T respectively).Discussion
The search space of the PSO fitting algorithm is wide (18 parameters overall), but can be successfully reduced using the piecewise approach adopted here [4]. While the amide peak was successfully fitted at both field strengths apart from the low concentration at 3T, the amine peak was more difficult to fit due to overlap with the water peak, due to direct water saturation effects. Continuous wave saturation is assumed for the solution of the BME model and this does not hold for the saturation strategy used at 3T which might explain the poorer fit observed particularly at lower concentration.Future work will involve acquiring spectra from phantoms containing various components of fibrous tissue including different types of collagen and fibrin, and considering the effects of cross-linking. Plans also include tests in ex-vivo tissue to optimise the model for in vivo application. Finally, an in vivo protocol is being established to allow us to acquire the z-spectra from the bowel walls of patients with Crohn’s disease, and to ultimately compare results to surgical histopathologic analysis.
Conclusion
We were able to detect changes in collagen concentration in vitro using CEST and a PSO fitting algorithm, detecting two peaks +1.9 ppm and at +3.5 ppm, namely amine and amide. Further optimisation will allow to derive a non-invasive imaging biomarker of fibrosis.Acknowledgements
No acknowledgement found.References
1. Rieder, F., Zimmermann, E. M., Remzi, et al. (2013). Crohn’s disease complicated by strictures: a systematic review. Gut, 62(7), 1072–1084.
2. Fang et al, Magnetisation transfer imaging adds information to conventional MRIs to differentiate inflammatory from fibrotic components of small intestinal strictures in Crohn’s disease. European Radiology 30, 1938–1947, 2020.
3. Jiang et al, Noninvasive Assessment of Renal Fibrosis with Magnetization Transfer MR Imaging: Validation and Evaluation in Murine Renal Artery Stenosis. Radiology, 283(1): 77–86, 2017. https://www.ncbi.nlm.nih.gov/pmc/articles/PMC5359024/
4. Carradus et al., Measuring the water exchange rate for various pools in the z-spectrum of the human brain, ISMRM proceedings 2019, abstract 3999.
Figures