1482
Super-Lorentzians and MT Asymmetries and Dipolar Order – Oh My!1Department of Radiology, University of Michigan, Ann Arbor, MI, United States
Synopsis
MT studies of model systems disentangle effects of MT asymmetry and dipolar oder. Choice of lipid materials controls amplitude of ihMT. These studies help outline the physical mechanisms of MT and provide guidance for design of MT, MTA, and ihMT phantoms.
Introduction
Like Dorothy on the Yellow Brick Road, those of us exploring MT between water and macromolecules must overcome a number of challenges. Early work realized that a Lorentzian lineshape for the solid component did not fit the data and a that Gaussian (1) or Super-Lorentzian (2) was more appropriate. Asymmetry in the MT profile is observed at higher magnetic field strengths as chemical shift differences between water and macromolecules becomes more apparent (3). Finally, rotational and translational diffusion of lipid molecules creates isolated dipolar regions, averaging intermolecular dipolar couplings between neighboring lipids while preserving intramolecular dipolar couplings along the lipid chain (4-6). This physics leads to magnetization with dipolar order that needs to be accounted for to understand the MT lineshape. This work aims to disentangle these complicated contributions to the MT lineshape created by chemical shift and molecular motions. Understanding the physics of simple systems is needed to understand MT in vivo and to aid in design of MT phantoms.Materials and Methods
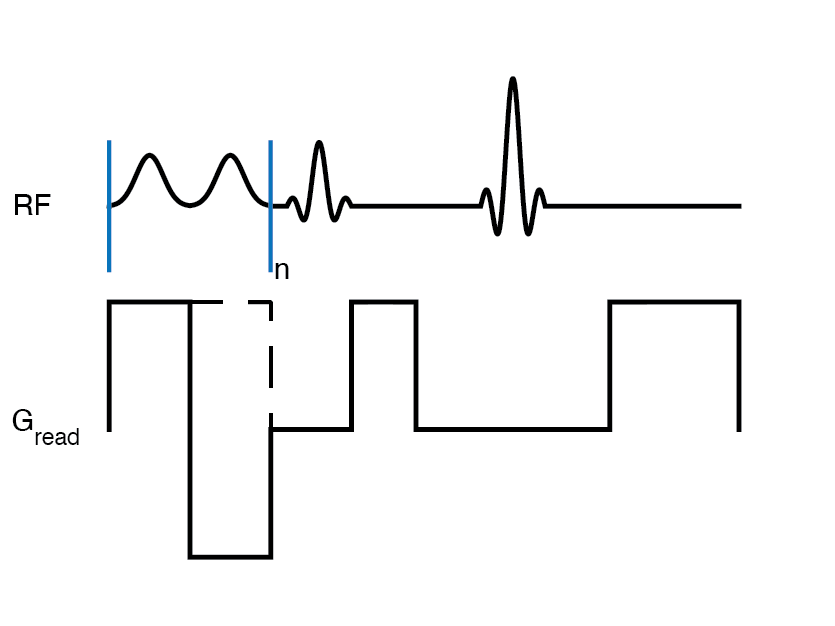
Several materials with MT properties were studied, including agarose at 2% and lipid phantoms of with decanol and cetyltrimethyl ammonium bromide (CTAB), and cetearyl alcohol (CA), behentrimethyammoniom chloride (BTAC), stearylamidopropyl dimethylamine (SD), and/or cholesterol (chol) at 12% (w/w).Single-shot MT z-spectra (7) were acquired at 16.7T with single-sided RF saturation (++) and (--) generated by gradient reversal. Enhanced MT (eMT) spectra were acquired with dual-sided (+-) and (-+) RF as previously outlined (6). MT asymmetry (MTA) was calculated as (++) -(--) RF saturation and ihMTR as {(++)+(--)}-{(+-)+(-+)} (6,8).
Results and Discussion
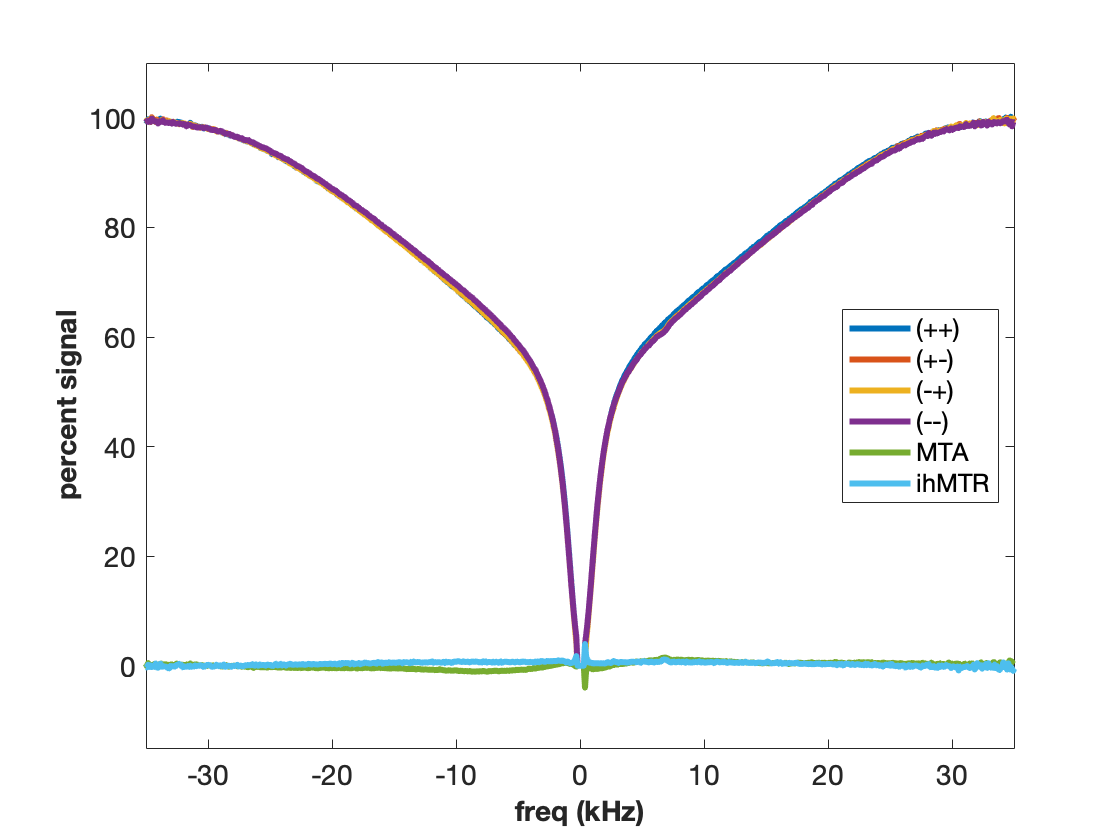
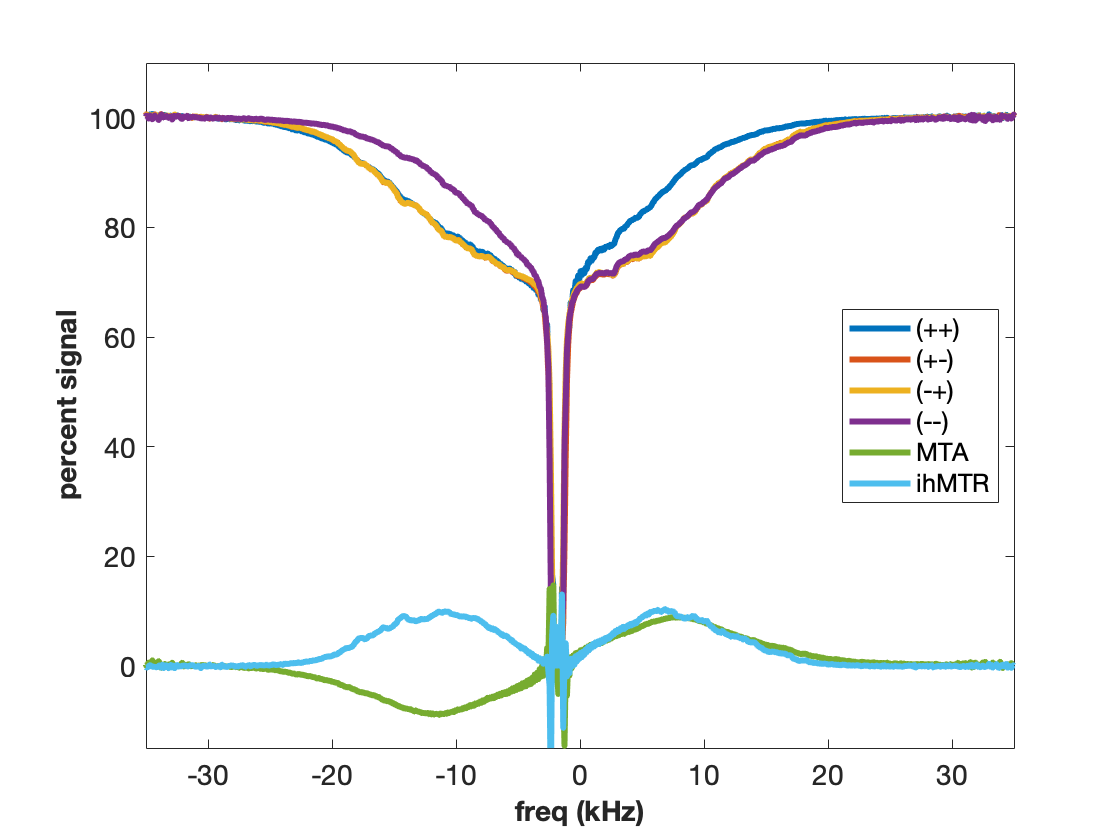
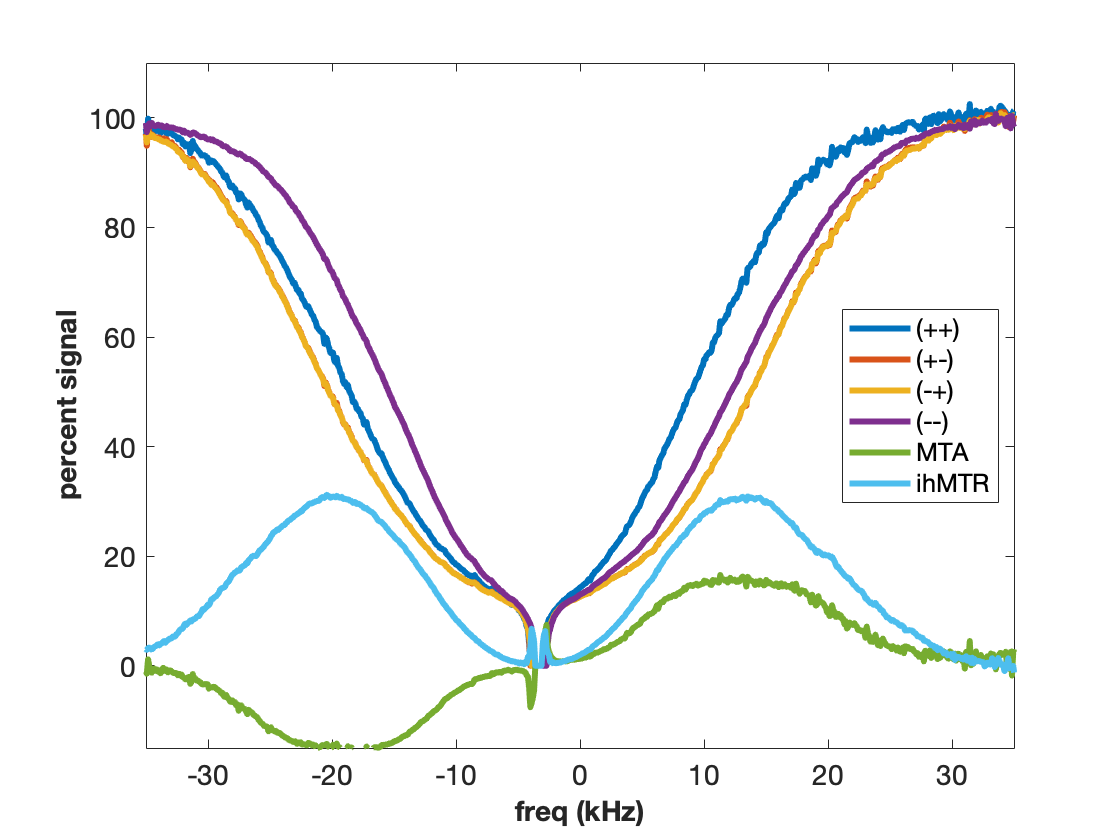
MT is often incorrectly described as an exchange between free water and “bound” water. We now know that this simplistic explanation is in general not correct, but in the case of agarose, it is spot on. The polysaccharide strands of form a double helical structure that binds structural waters which exchange with free water. Water in the agarose helix resonates at the same frequency as free water. In addition, the water is rigidly held and efficient spin-diffusion within the bound water pool creates a short dipolar order relaxation time (T1d) and small ihMT signal. Therefore agarose has minimal MT asymmetry and ihMTR (Figure 2).CTAB and decanol combine to form lamellar liquid crystals with demonstrated MT properties (6). MT occurs via proton exchange between water and decanol hydroxyl protons. The MT spectra have an asymmetry generated by the chemical shift of the aliphatic chain. MTA is clearly seen in Figure 3 as the difference between (++) and (--) saturation. Rapid motions of decanol average both intramolecular and intermolecular dipolar interactions resulting in a system with minimal ihMT; dipolar order is never established.
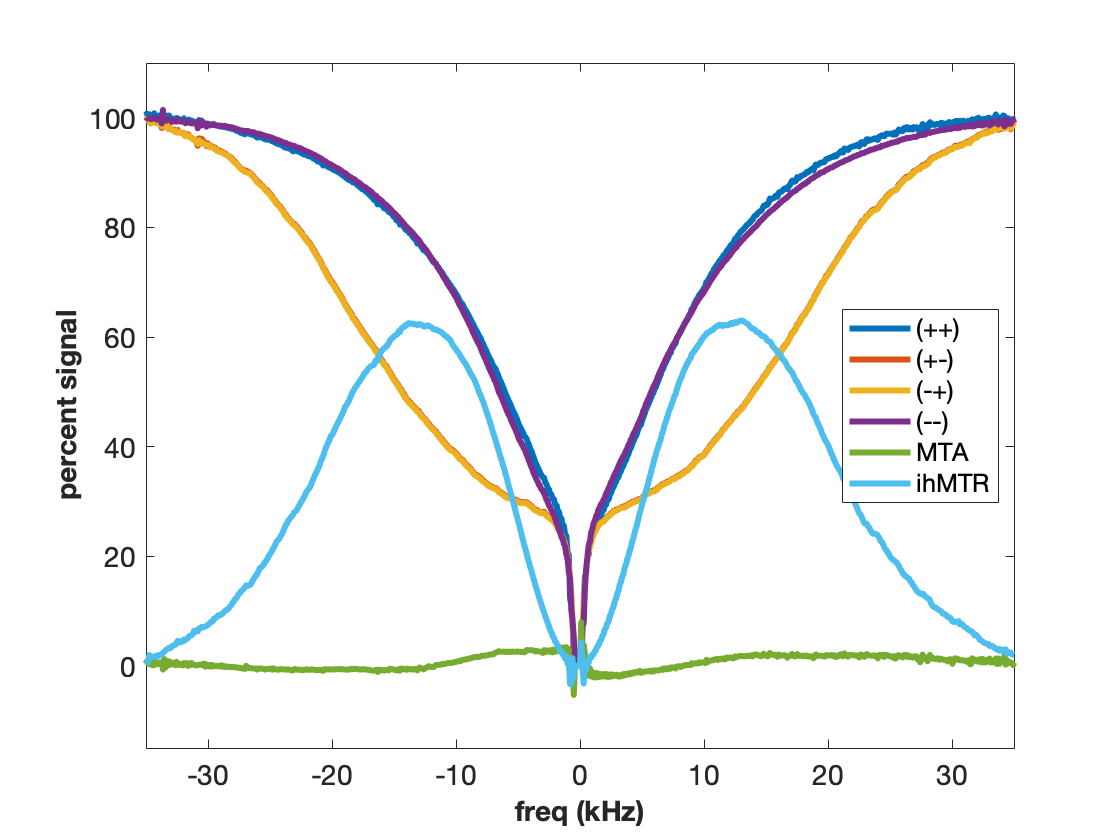
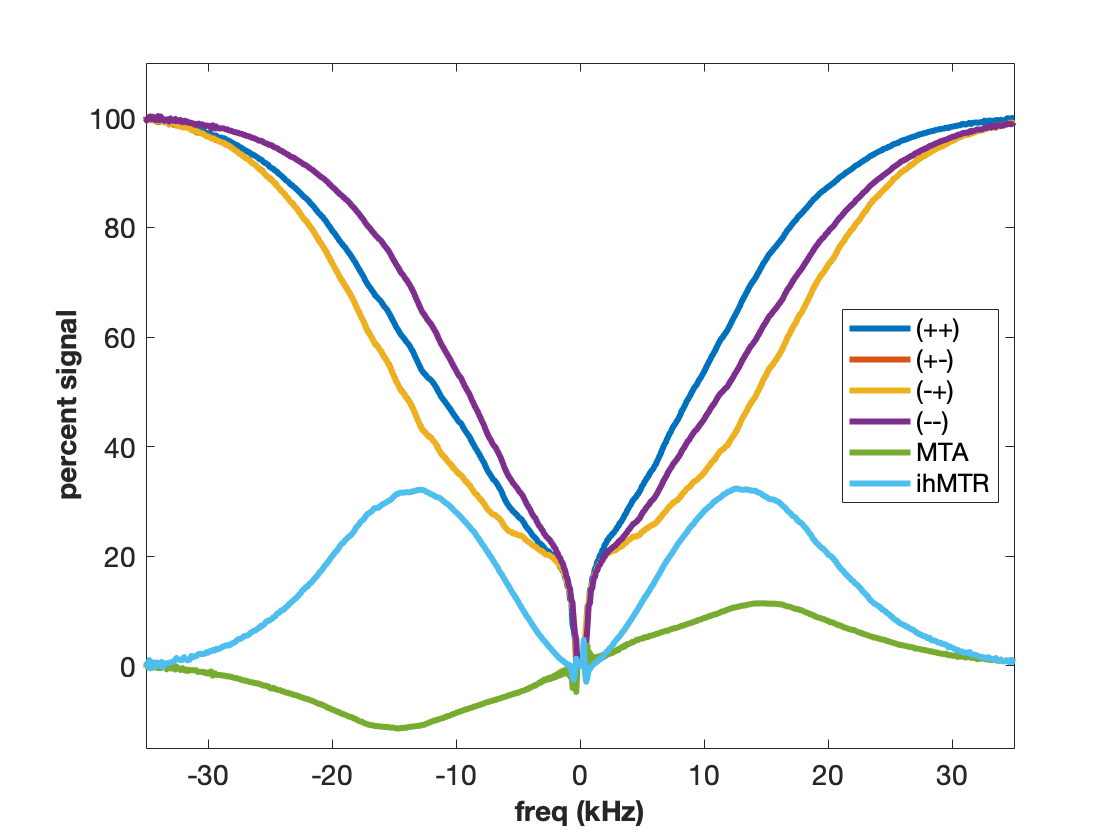
Using higher molecular weight cetearyl alcohol (CA) and a non-ionic surfactant (SD) with amide groups forms a sample with exchanging amide and hydroxyl protons (Figure 4). The two exchanging proton groups with different underlying proton spectra tend to balance the MT asymmetry effects, yielding minimal MTA in the CA:SD:BTAC sample. At the same time, ideal conditions for dipolar order are created as the lipid chains rotate freely to form isolated dipolar reservoirs with long proton T1d times. Hence the eMT signal is much larger than the MT signal and ihMTR is maximized. Curiously, the MT spectra appear to be almost super-Lorentlzian whereas the eMT spectra are Gaussian. This is a result of Provotorov theory and single vs. dual-sided RF saturation (4-6). Heating the CA:SD:BTAC sample to 50 °C causes return of the MT asymmetry (Figure 5) due to different exchange rates between amide and hydroxyl protons.
Adding cholesterol to the CA:SD:BTAC sample increase sample rigidity, adds an additional source for MTA, and decreases ihMTR wrt CA:SD:BTAC without cholesterol (Fig. 4).
Conclusions
MT in vivo is complicated. The MT effect is a function of pH, chemical shift, molecular components, molecular dynamics, and experimental conditions. The MT line shape is broad, but it is not featureless. We show here in several model systems that MT can exist with or without MT asymmetry and and with or without effects of dipolar order. MTA is zero for systems such as agarose with exchanging water molecules and large for systems with exchanging protons and a chemical shift from water. ihMTR is maximized in systems that preserve dipolar order but allow rotational motions of lipid molecules. Cholesterol adds rigidity, increases MTA and decreases ihMTR. These features and principles should be taken into account as we try to understand and exploit the features of the MT line shape in vivo. In addition, understanding MT is needed to create accurate and reproducible MT phantoms for future quantitative multisite clinical studies using MTR. Dorothy found her way home by clicking her heals. Our path may be a bit more complicated, but we now have proper tools to disentangle the complicated physics that determines the MT line shape.Acknowledgements
No acknowledgement found.References
1. Henkelman RM, Huang X, Xiang Q ‐S, Stanisz GJ, Swanson SD, Bronskill MJ. Quantitative interpretation of magnetization transfer. Magn Reson Med. 1993;29(6):759–766.
2. Malyarenko DI, Zimmermann EM, Adler J, Swanson SD. Magnetization transfer in lamellar liquid crystals. Magn Reson Med. 2014;72(5):1427–1434.
3. Hua J, Jones CK, Blakeley J, Smith SA, Van Zijl PCM, Zhou J. Quantitative description of the asymmetry in magnetization transfer effects around the water resonance in the human brain. Magn Reson Med. 2007;58(4):786–793. PMID: 17899597
4. Varma G, Girard OM, Mchinda S, Prevost VH, Grant AK, Duhamel G, Alsop DC. Low duty-cycle pulsed irradiation reduces magnetization transfer and increases the inhomogeneous magnetization transfer effect. J Magn Reson [Internet]. Elsevier Inc.; 2018;296:60–71. Available from: https://doi.org/10.1016/j.jmr.2018.08.004
5. Manning AP, Chang KL, MacKay AL, Michal CA. The physical mechanism of “inhomogeneous” magnetization transfer MRI. J Magn Reson. 2017;274:125–136.
6. Swanson SD, Malyarenko DI, Fabiilli ML, Welsh RC, Nielsen JF, Srinivasan A. Molecular, dynamic, and structural origin of inhomogeneous magnetization transfer in lipid membranes. Magn Reson Med. 2017;77(3):1318–1328.
7. Swanson SD. Broad-Band excitation and detection of cross-relaxation NMR-spectra. J Magn Reson. 1991 Dec;95(3):615–618.
8. Ercan E, Varma G, Mädler B, Dimitrov IE, Pinho MC, Xi Y, Wagner BC, Davenport EM, Maldjian JA, Alsop DC, Lenkinski RE, Vinogradov E. Microstructural correlates of 3D steady-state inhomogeneous magnetization transfer (ihMT) in the human brain white matter assessed by myelin water imaging and diffusion tensor imaging. Magn Reson Med. 2018;80(6):2402–2414.
Figures