1480
Fast 3D steady state inhomogeneous magnetization transfer imaging with Segmented Spoiled Gradient Echo - Echo Planar Imaging.1Research and Development Center, Canon Medical Systems Corporation, Kawasaki, Japan
Synopsis
Inhomogeneous magnetization transfer is a promising technique to provide high sensitivity and specificity of detecting myelinated content in tissue. 3D steady-state ihMT imaging with 3D segmented Spoiled Gradient Echo (SPGR) sequence can provide myelin information of the whole brain within 5-10min of acquisition time. In this work, we demonstrate 3D steady-state ihMT imaging with a 3D segmented Spoiled Gradient Echo - Echo Planar Imaging (SPGR-EPI) sequence instead of 3D segmented SPGR to reduce acquisition time. We successfully reduced approximately 30% of the acquisition time for 3D steady-state ihMT imaging by applying 3D Segmented SPGR-EPI compared to 3D segmented SPGR.
Introduction
Inhomogeneous magnetization transfer (ihMT)1) is a novel technique that can be weighted by dipolar order relaxation, and then the long-lived dipolar coupling within the myelin bilayer produces myelin-specific contrast2). Initial implementation for ihMT imaging used 2D single-shot EPI or HASTE with a long MT preparation pulse train2,3). This technique basically can obtain just a single slice per acquisition and this leads to a long acquisition time to obtain whole-brain data. Recent reports indicated 3D steady-state ihMT imaging using 3D segmented SPGR sequence4,5) can acquire the whole brain, but it is still necessary to use a long acquisition time to acquire the whole brain. Use of 3D segmented SPGR-EPI sequence on behalf of 3D segmented SPGR sequence will reduce acquisition time without SNR penalty for acquiring 3D steady-state ihMT imaging. The aim of this study is to demonstrate that the 3D segmented SPGR-EPI sequence can obtain comparable results to previous reports with reduced acquisition time.Materials and Methods
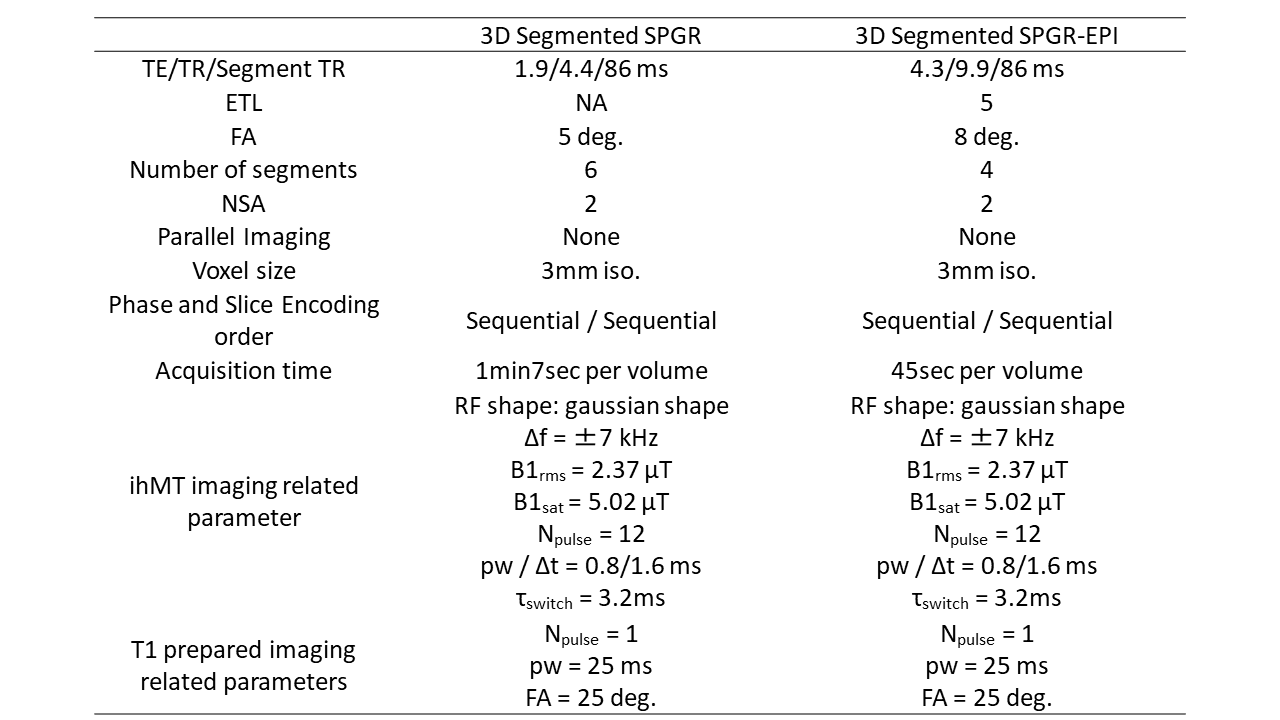
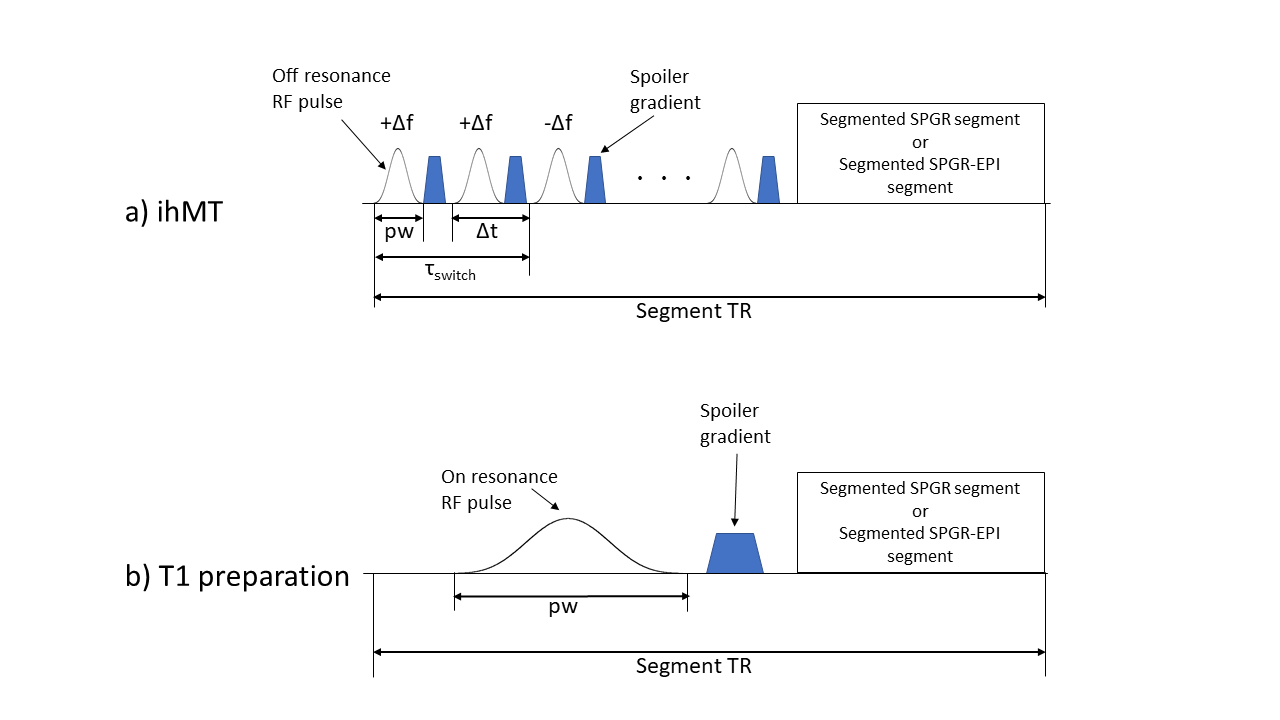
This study was approved by our institutional review board and informed consent was obtained. A healthy male was scanned at a clinical 3T MRI system (Vantage Galan 3T / ZGO, Canon Medical Systems Corp.) using a 32-channel head coil. Head sagittal scans through the whole brain were performed using 3D segmented SPGR and 3D segmented SPGR-EPI ihMT sequences to obtain four different MT saturated images (S++, S--, S+- and S-+) and the non-MT saturated image for reference image (S0). Furthermore, T1 prepared image (ST1ref) was acquired for the calculation of ihMTRinv. Table 1 shows the detailed acquisition parameters for each pulse sequence, and pulse sequence diagrams are shown in Fig .1. ihMTR and ihMTRinv were calculated as follows6):ihMTR = 100 * (S++ + S-- - S+- - S-+) / S0
ihMTRinv = 100 * ST1ref * (1/S+- + 1/S-+ - 1/S++ -1/S--)
All data were pre-processed using FSL [https://fsl.fmrib.ox.ac.uk/fsl/fslwiki/] for skull stripping, motion correction, and transforming to the standard spaces. Subregions of interest were extracted from white matter using two atlases, the "JHU ICBM-DTI-81 white-matter labels atlas" and the "JHU white-matter tractography atlas". In each subregion, mean and standard deviation (SD) values of ihMTR and ihMTRinv were measured.
Results
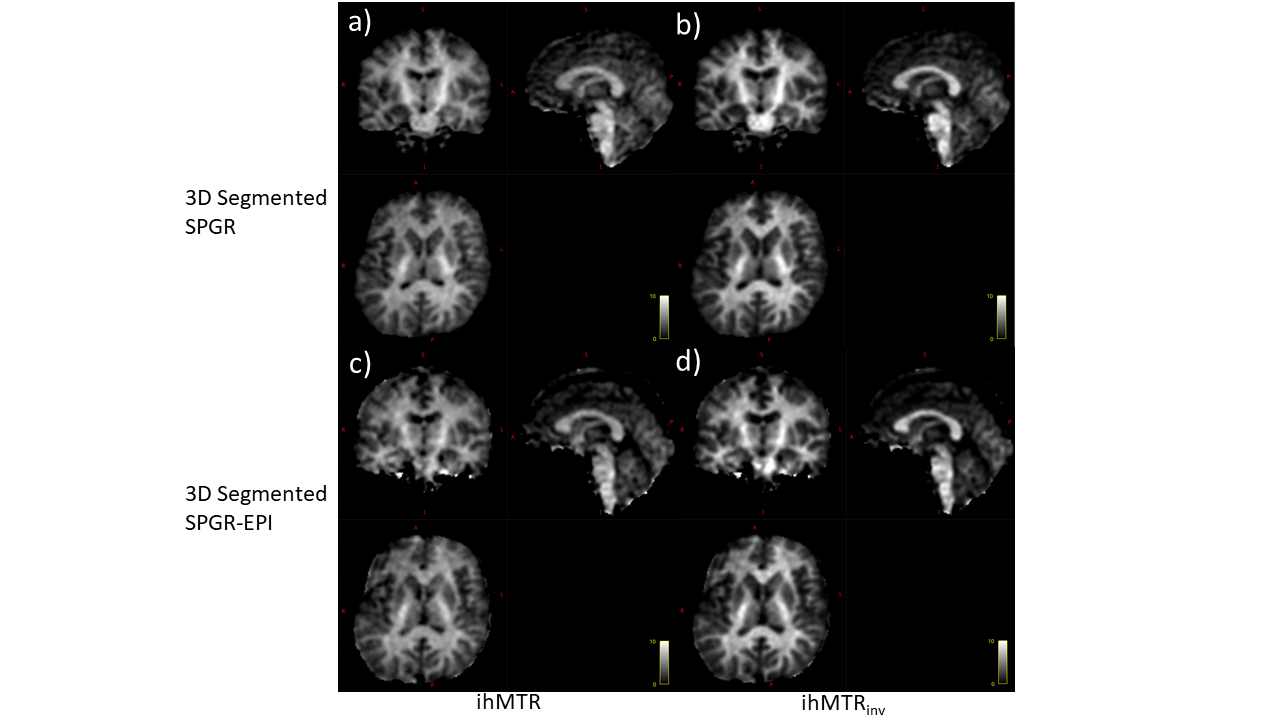
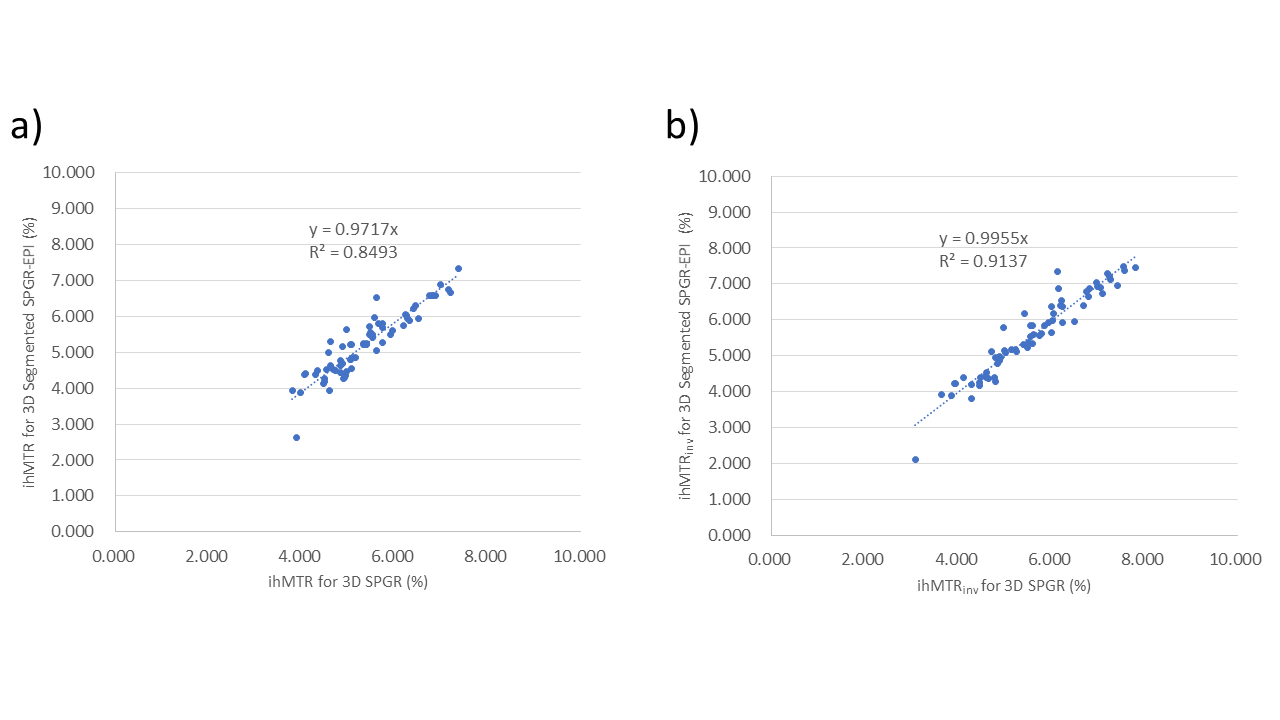
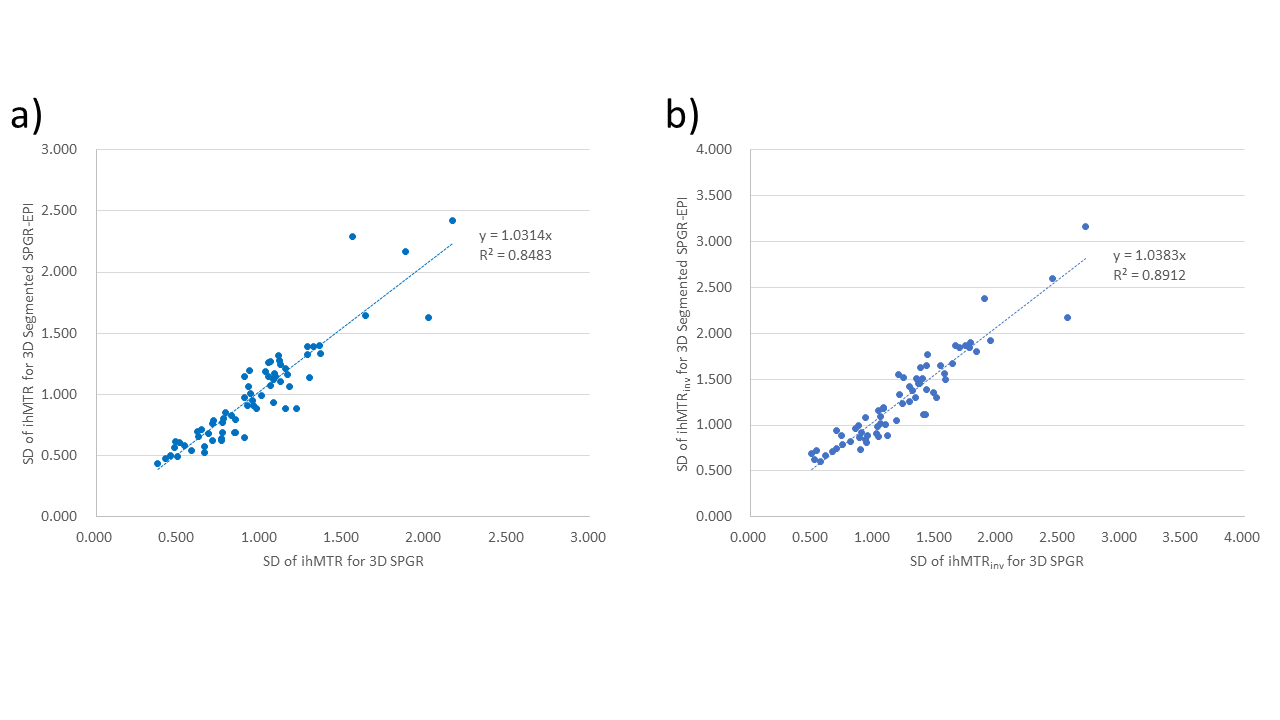
We achieved a 33% reduction of scan time for 3D ihMT imaging acquired using 3D segmented SPGR-EPI compared to 3D ihMT imaging with 3D segmented SPGR (See Table 1, acquisition time per volume). Figure 2 shows an ihMTR map and an ihMTRinv map which were acquired using 3D segmented SPGR and 3D segmented SPGR-EPI. Brain segment-wise comparison of ihMTR and ihMTRinv value revealed excellent agreement between 3D segmented SPGR and 3D segmented SPGR-EPI (Fig. 3), and standard deviation of ihMTR value and ihMTRinv value for each brain segmentation were almost the same for 3D segmented SPGR and 3D segmented SPGR-EPI (Fig. 4).Discussion
We have achieved scan time reduction without SNR penalty by implementing a 3D segmented SPGR-EPI sequence for 3D steady-state ihMT imaging compared to 3D ihMT imaging with 3D segmented SPGR. In this work, we did not apply parallel imaging techniques to keep enough SNR, since the signal difference between the single frequency excitations (S++ and S--) and the dual-frequency excitations (S+- and S-+) is so small. However, the use of parallel imaging might reduce acquisition time more. On the other hand, 3D segmented SPGR-EPI also has the potential to obtain higher spatial resolution ihMT imaging with comparable acquisition time to 3D segmented SPGR.Conclusion
This study shows the feasibility of using 3D segmented SPGR-EPI sequence to reduce acquisition time for 3D steady-state ihMT imaging compared to previous reports.Acknowledgements
References
1. Varma, G., Duhamel, G., de Bazelaire, C. & Alsop, D. C. Magnetization transfer from inhomogeneously broadened lines: A potential marker for myelin. Magn. Reson. Med. 73, 614–622 (2015).
2. Van Obberghen, E. et al. Evaluation of the Sensitivity of Inhomogeneous Magnetization Transfer (ihMT) MRI for Multiple Sclerosis. AJNR Am. J. Neuroradiol. 39, 634–641 (2018).
3. Girard, O. M. et al. Magnetization transfer from inhomogeneously broadened lines (ihMT): Experimental optimization of saturation parameters for human brain imaging at 1.5 Tesla. Magn. Reson. Med. 73, 2111–2121 (2015).
4. Ercan, E. et al. Microstructural correlates of 3D steady-state inhomogeneous magnetization transfer (ihMT) in the human brain white matter assessed by myelin water imaging and diffusion tensor imaging. Magn. Reson. Med. 80, 2402–2414 (2018).
5. Mchinda, S. et al. Whole brain inhomogeneous magnetization transfer (ihMT) imaging: Sensitivity enhancement within a steady-state gradient echo sequence. Magn. Reson. Med. 79, 2607–2619 (2018).
6. Varma, G., et al. An inhomogeneous magnetization transfer (ihMT) quantification method robust to B1 and T1 variations in magnetization prepared acquisitions. in Proceedings of the 27th annual meeting of the ISMRM #4911 (2019).
Figures