1479
Quantitative inhomogeneous MT with Cramer Rao lower bound optimized protocol to distinguish tissue from donors with/without Multiple Sclerosis1Radiology, Division of MR Research, Beth Israel Deaconess Medical Center, Harvard Medical School, Boston, MA, United States, 2CNRS, CRMBM, Aix-Marseille Univ, Marseille, France
Synopsis
Inhomogeneous magnetization transfer (ihMT) is predominantly associated with myelin imaging and shows promise in detection and monitoring myelin related disorders, including multiple sclerosis (MS). Extraction of quantitative parameters from ihMT data (qihMT) would ideally provide information independent of the ihMT sequence. We used Cramer Rao lower bound analysis to develop an optimized acquisition protocol for qihMT and simulations to test the fidelity of the protocol. Preliminary application to central nervous system samples showed differences in free pool longitudinal relaxation rate R1a, bound pool transverse relaxation time T2b, and dipolar relaxation time T1d between specimens from donors with and without MS.
Introduction
The signal from inhomogeneous Magnetization Transfer (ihMT) has been validated as a measure of myelin content1, and demonstrated advantage over MT in a study of multiple sclerosis (MS)2. The ihMT signal is a complex interaction of quantities relating to the underlying tissue but also scan parameters, making intra- and inter-site comparisons sensitive to the ihMT sequence.Extraction of these quantitative parameters would not only make such comparisons more meaningful, but also allow quantitative differentiation in studies of myelin related disorders such as MS. However, accurate extraction invariably requires more data thereby increasing scan times. In this work, we use Cramer Rao lower bound (CRLB) theory to optimize the scans acquired for extraction of quantitative parameters from ihMT data, i.e. qihMT.
The optimized acquisition strategy was tested to assess the robustness of quantitative parameters output, and used to determine if qihMT allows differentiation of ex-vivo tissue from donors with and without MS.
Methods
Simulations of and fits to ihMT data were conducted based on alterations to freely available code3. The code was altered to calculate a CRLB based on methods in prior literature dealing with quantitative MT4, with sensitivity to the following qihMT parameters: bound pool fractional size, F; free pool longitudinal magnetization relaxation rate, R1a; bound pool transverse magnetization relaxation rate, T2b; rate of magnetization exchange between free and bound pools, R; dipolar order relaxation time, T1d; and, the fraction of the bound pool with a non-zero T1d, f. Based on white matter (WM) qihMT values in 5,6, the output provided scan parameters for 10 ihMT experiments based on an MPRAGE sequence5. Data were simulated using the optimized acquisition strategy, with the WM qihMT values and changes to each parameter performed individually, and for different signal-to-noise ratios (SNRs), to ascertain its strength. A global fitting algorithm was applied to the simulated and experimental data with multiple starting or trial points. Formalin fixed cerebellum brain and cervical spinal cord samples were washed with phosphate buffered saline and placed in chamber slides for MRI. Data (FOV=48x24x14.4mm3; matrix=120x60x18) were acquired on a 9.4T preclinical scanner using a quadrature transmit/receive volume coil, with warm air used to maintain the samples’ temperature at 37°C.Results
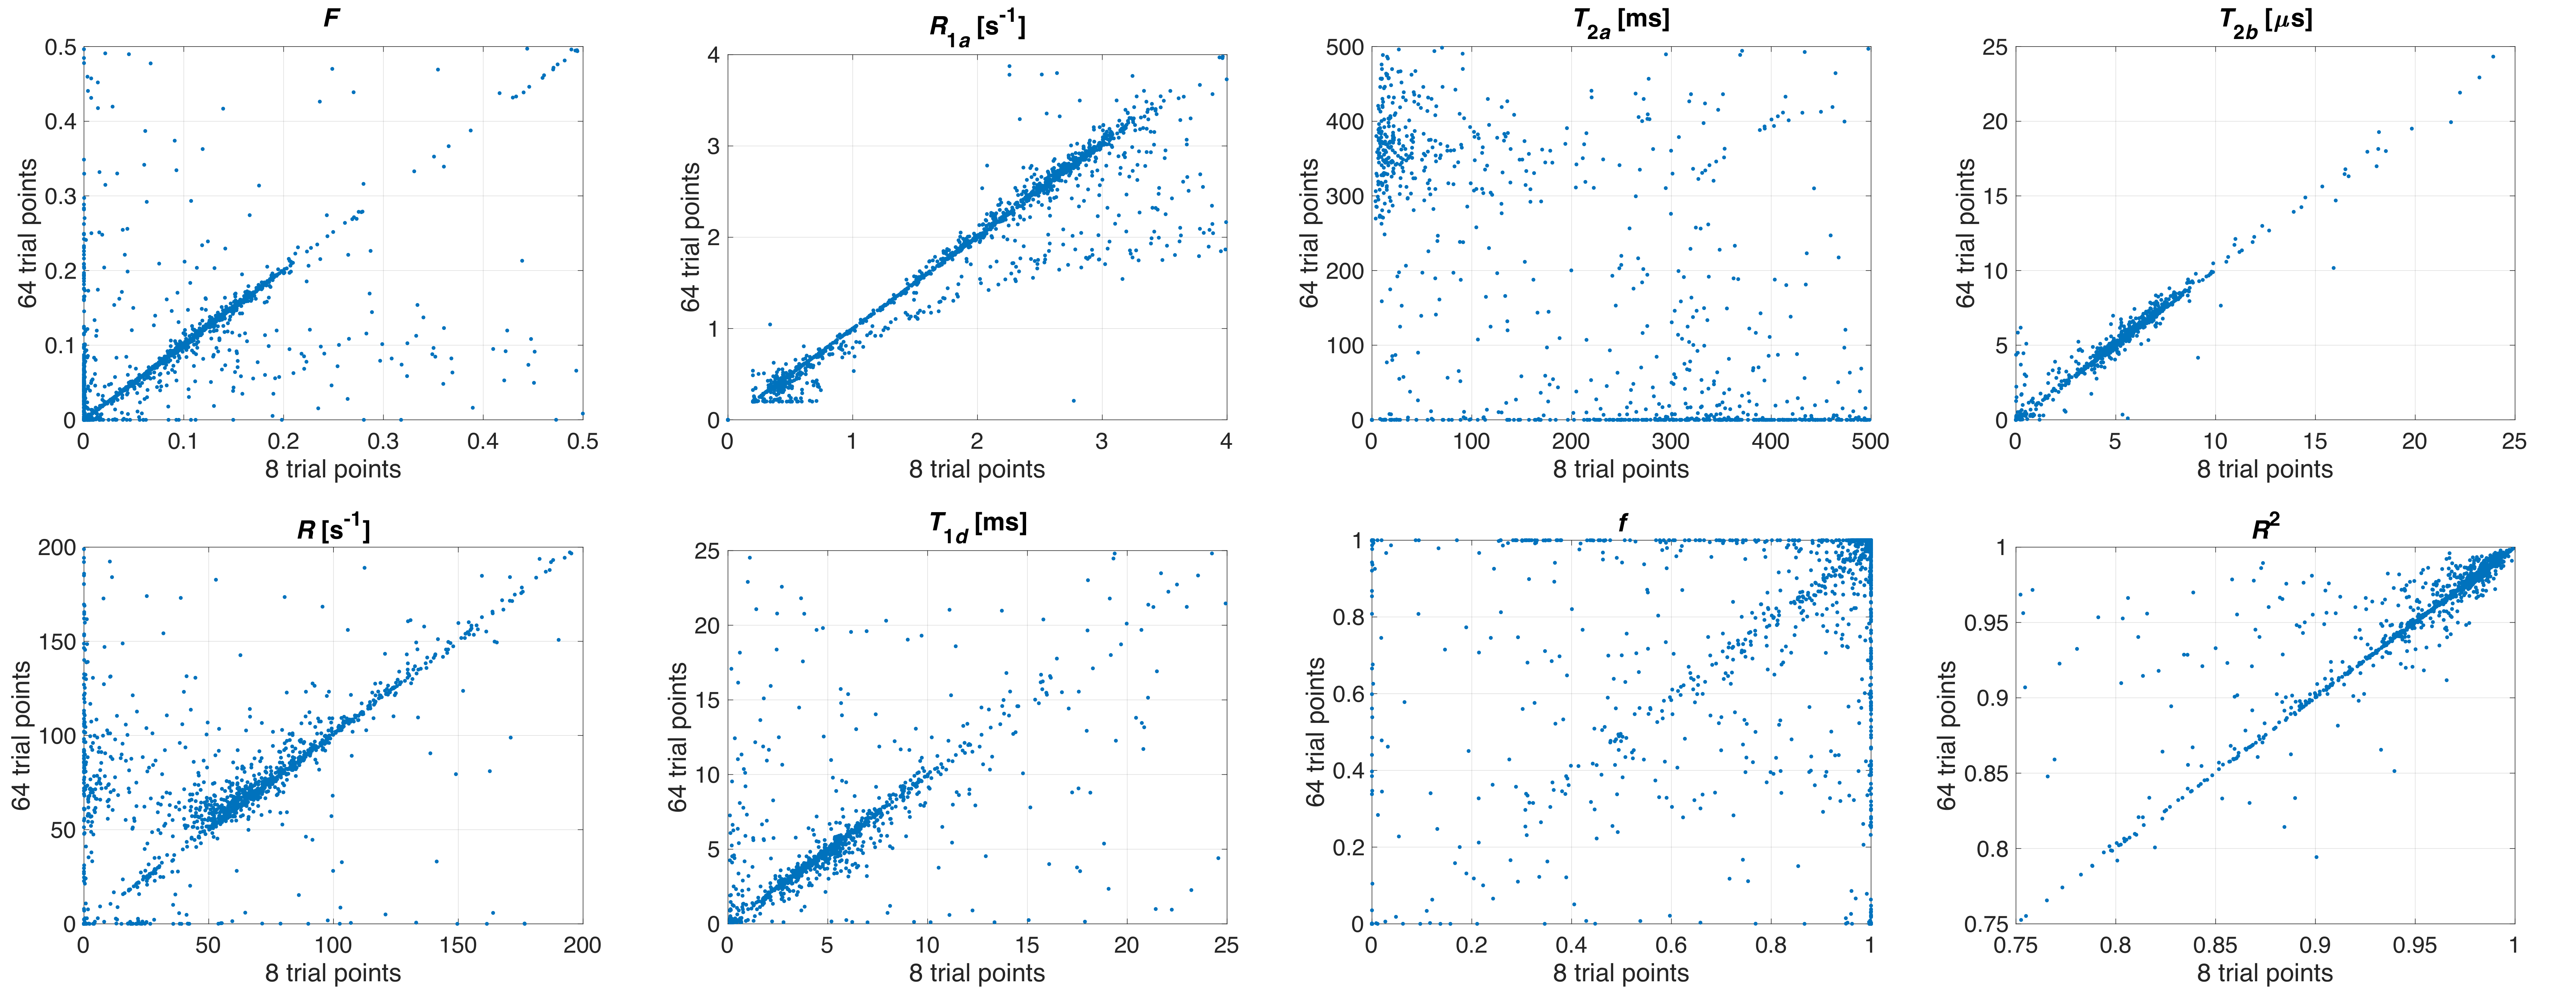
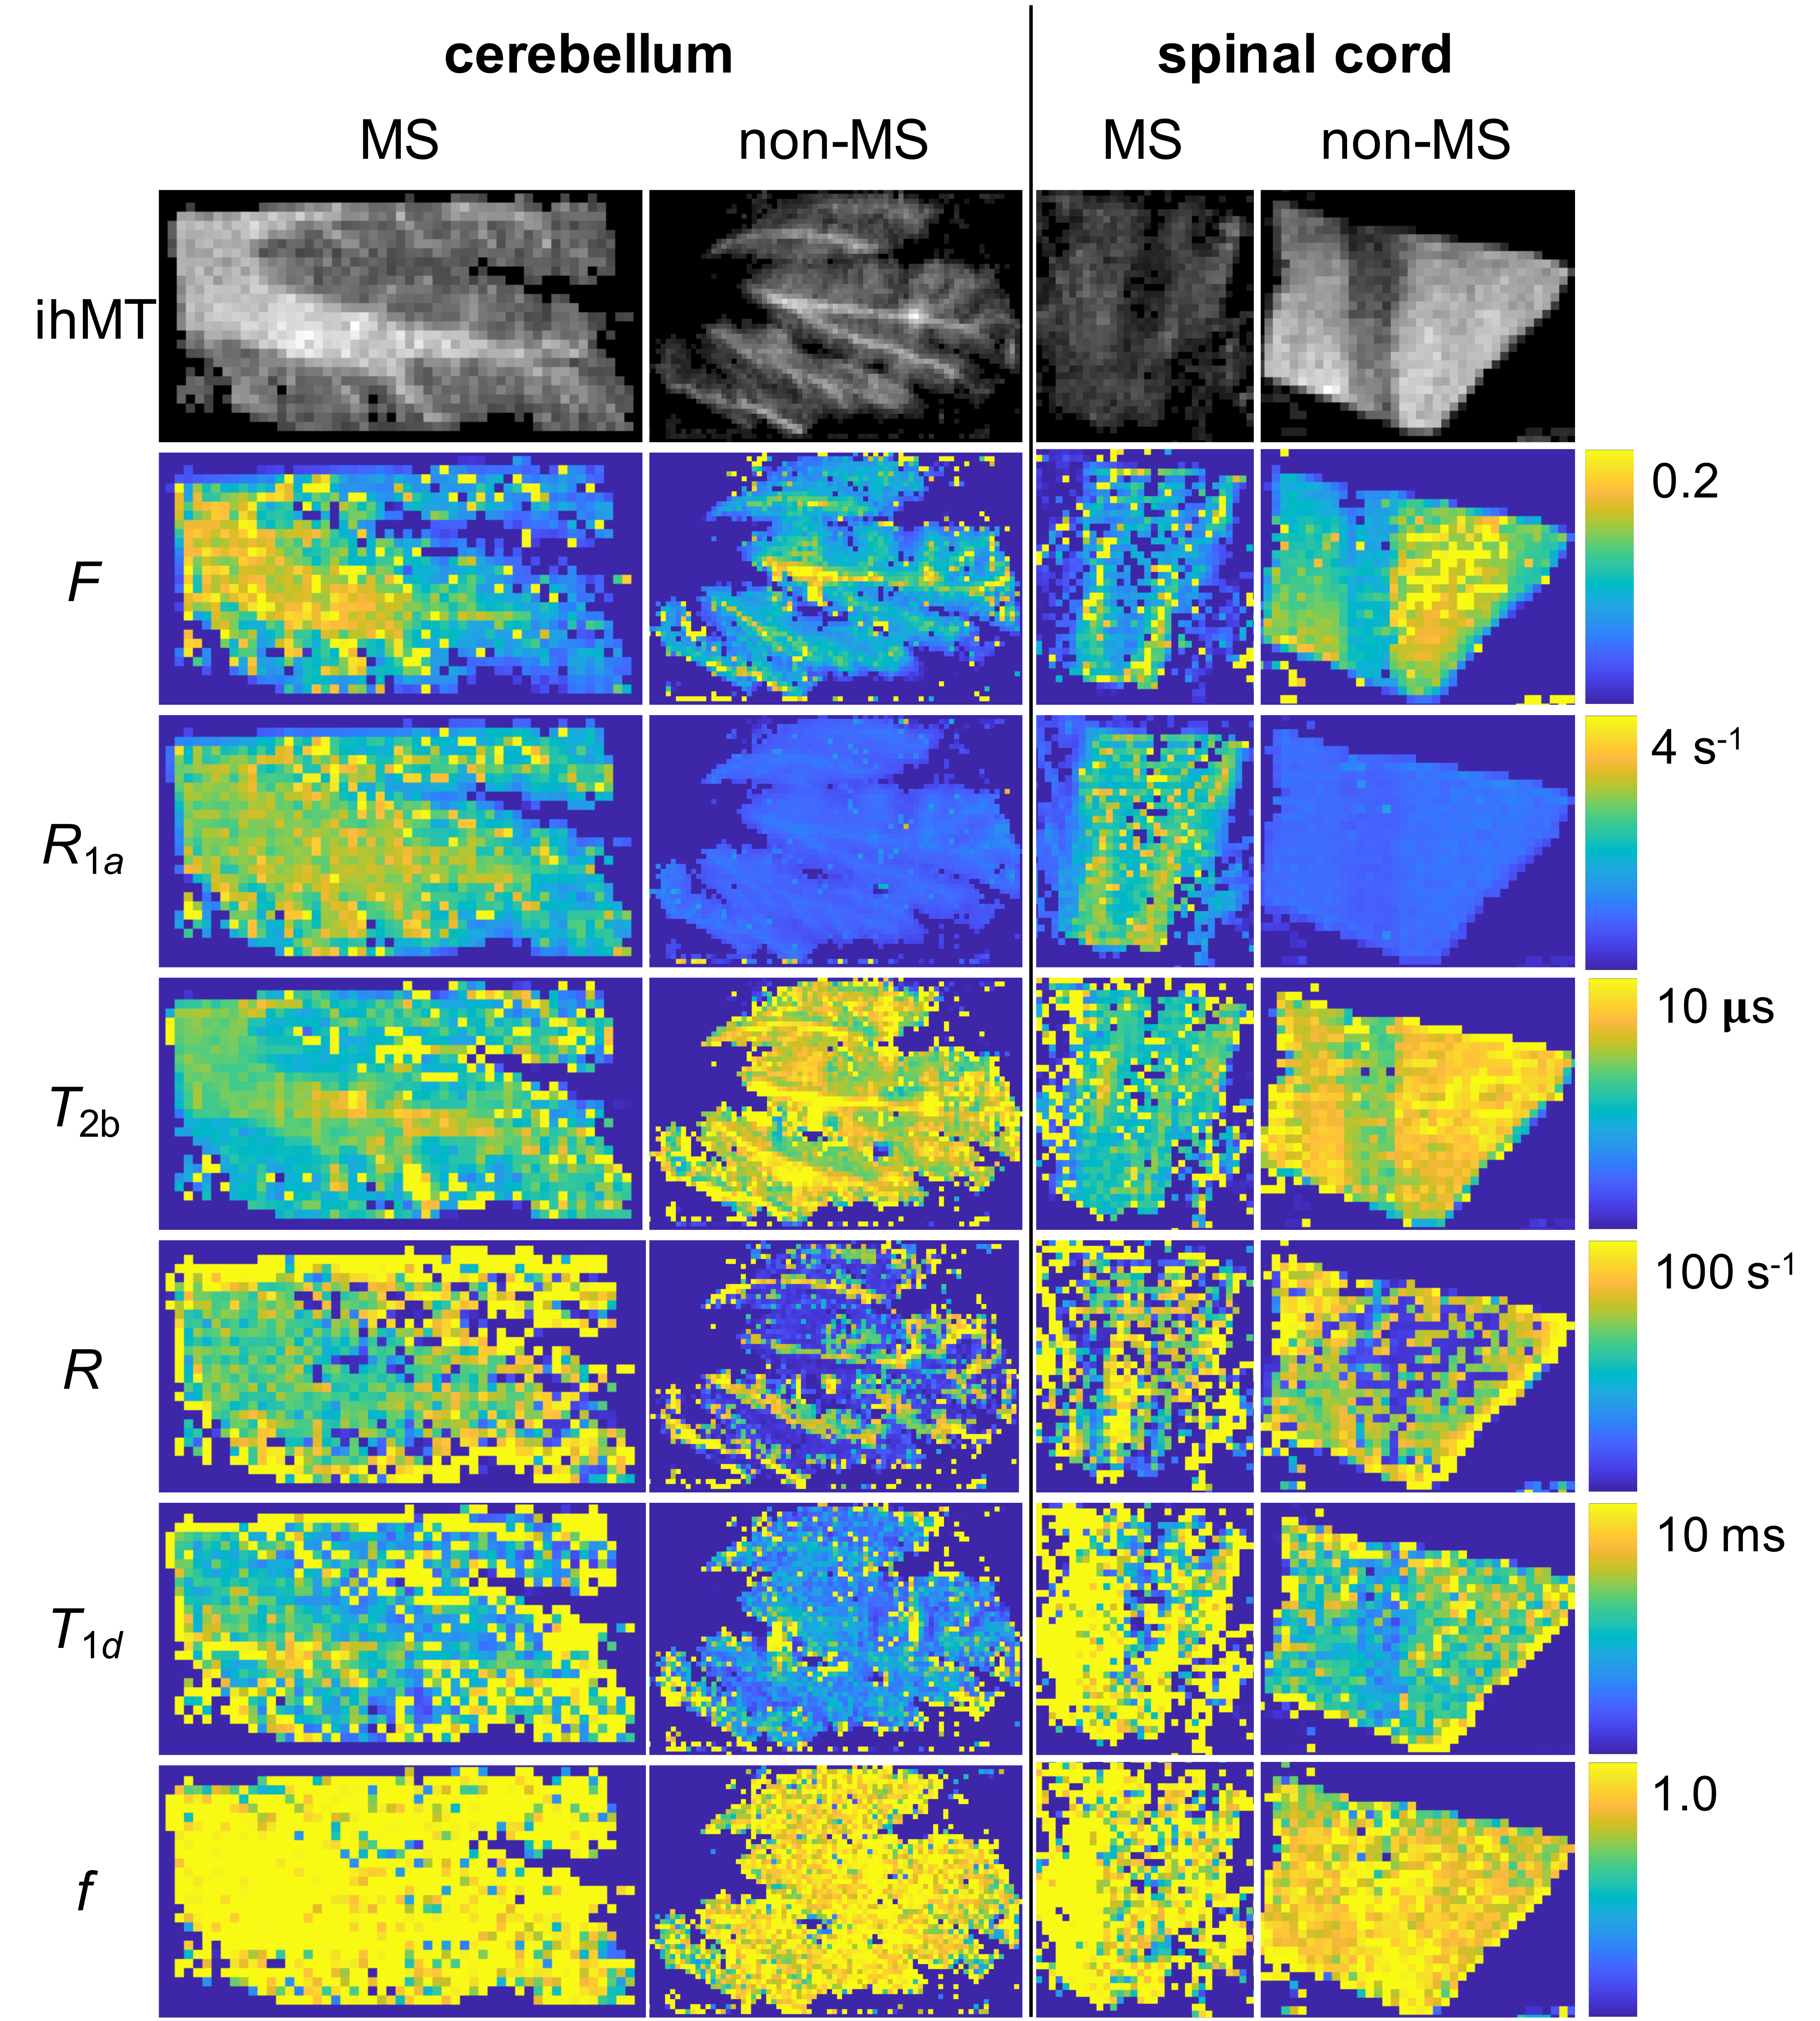
Despite allowing the readout flip angle (FA) to vary, the optimal solution tended to the same upper bound value (i.e. 16°). Thus, 6 parameters were considered during protocol optimization via the CRLB (Fig.1). Although the F parameter was mostly accurate for all SNRs considered, outputs from fits to simulated data provided values for other qihMT parameters that deviated from the truth for SNRs ≤ 40, particularly for simulated changes of R1a, T2b, and R (Fig. 2). T1d values were particularly sensitive to deviations in R1a and T2b, even for SNR=160. T2as were inaccurate across all SNRs. A strong linear correlation between output values was found from global fits with 64 versus 8 trial points for all qihMT parameters apart from T2a and f (Fig.3). Contrast between WM and gray matter (GM) was apparent for all samples in maps of F and T2b (Fig.4). Notably higher T2b, and lower R1a and T1d values going from the MS to non-MS tissue samples were visible. Average (± standard deviation) values in WM of cerebellum tissue from donors with/without MS included: F=(0.16±0.06)/(0.14±0.07); R1a=(2.7±0.3)/(0.9±0.1)s-1; T2b=(6.5±0.5)/(9.1±1.7)µs; R=(61.9±15.9)/(34.2±31.4)s-1; T1d=(6.2±3.7)/(4.8±2.7)ms; and, f=(1.0±0.1)/(0.9±0.1).Discussion
An optimized set of 10 scans for qihMT were obtained, specifically with B1,RMS capped at 3.1μT to allow translation to a clinical scanner for future comparison (Fig.1). Analysis of accuracy using simulated data suggests a SNR>40 is required for sufficient confidence in the output qihMT parameters (excluding T2a, which was not considered in calculation of the CRLB) (Fig.2). Although the protocol might be improved to output more accurate T1ds for R1as>3s-1 and T2bs>30µs, actual tissue values are expected to be lower4,5,7,8.A visible difference between WM and GM in the map of T1d from the non-MS cervical spinal cord sample (Fig.4) is promising given prior literature postulating a high B1,RMS is required for such a contrast8. A global fitting algorithm was used to circumvent bias based on the starting point10. Potential for improvement to the protocol is again indicated by the lower correlation in f between 64 versus 8 trial points (Fig.3). The results indicate R1a, T2b, and T1d parameters allow differentiation of central nervous system tissues from donors with and without MS (Fig.4), which would provide promise for non-invasive detection and monitoring of MS.
Although the samples came from sex matched donors of similar age, the differences in parameters might be due to autolysis based on different postmortem intervals, especially given the increase in T1d that seemingly contradicts decreases in ihMT with increasing MS disability2. Thus, we strive towards further experiments particularly using samples with similar postmortem intervals.
Conclusion
Our confidence in qihMT parameter values output from the fits increased by use of a CRLB optimized protocol and global fitting algorithm. Differences between fixed samples of central nervous system tissues from donors with and without MS were observed in the free pool longitudinal relaxation rate R1a, the bound pool transverse relaxation time T2b, and the dipolar relaxation time T1d upon which an ihMT signal is dependent.Acknowledgements
We gratefully acknowledge the National Institutes of Health (NIH) NeuroBioBank as the source of tissue used in this study, and support from the National Institute of Neurological Disorders and Stroke of the NIH under award number R21NS114546.References
- Duhamel G, Prevost VH, Cayre M, et al. Validating the sensitivity of inhomogeneous magnetization transfer (ihMT) MRI to myelin with fluorescence microscopy. NeuroImage 2019;199:289–303 doi: 10.1016/j.neuroimage.2019.05.061.
- Van Obberghen E, Mchinda S, le Troter A, et al. Evaluation of the Sensitivity of Inhomogeneous Magnetization Transfer (ihMT) MRI for Multiple Sclerosis. AJNR Am J Neuroradiol 2018;39:634–641 doi: 10.3174/ajnr.A5563.
- Malik SJ, Teixeira RPAG, West DJ, Wood TC, Hajnal JV. Steady-state imaging with inhomogeneous magnetization transfer contrast using multiband radiofrequency pulses. Magnetic Resonance in Medicine 2020;83:935–949 doi: 10.1002/mrm.27984.
- Cercignani M, Alexander DC. Optimal acquisition schemes for in vivo quantitative magnetization transfer MRI. Magnetic Resonance in Medicine 2006;56:803–810 doi: 10.1002/mrm.21003.
- Varma G, Munsch F, Burns B, et al. Three-dimensional inhomogeneous magnetization transfer with rapid gradient-echo (3D ihMTRAGE) imaging. Magnetic Resonance in Medicine 2020;84:2964–2980 doi: 10.1002/mrm.28324.
- Varma G, Girard OM, Mchinda S, et al. Low duty-cycle pulsed irradiation reduces magnetization transfer and increases the inhomogeneous magnetization transfer effect. Journal of Magnetic Resonance 2018;296:60–71 doi: 10.1016/j.jmr.2018.08.004.
- Stanisz GJ, Odrobina EE, Pun J, et al. T1, T2 relaxation and magnetization transfer in tissue at 3T. Magn. Reson. Med. 2005;54:507–512 doi: 10.1002/mrm.20605.
- Bagnato F, Hametner S, Franco G, et al. Selective Inversion Recovery Quantitative Magnetization Transfer Brain MRI at 7T: Clinical and Postmortem Validation in Multiple Sclerosis. Journal of Neuroimaging 2018;28:380–388 doi: 10.1111/jon.12511.
- Carvalho VND, Hertanu A, Grélard A, et al. MRI assessment of multiple dipolar relaxation time (T1D) components in biological tissues interpreted with a generalized inhomogeneous magnetization transfer (ihMT) model. J Magn Reson 2020;311:106668 doi: 10.1016/j.jmr.2019.106668.
- West DJ, Teixeira RPAG, Wood TC, Hajnal JV, Tournier J-D, Malik SJ. Inherent and unpredictable bias in multi-component DESPOT myelin water fraction estimation. NeuroImage 2019;195:78–88 doi: 10.1016/j.neuroimage.2019.03.049.
Figures
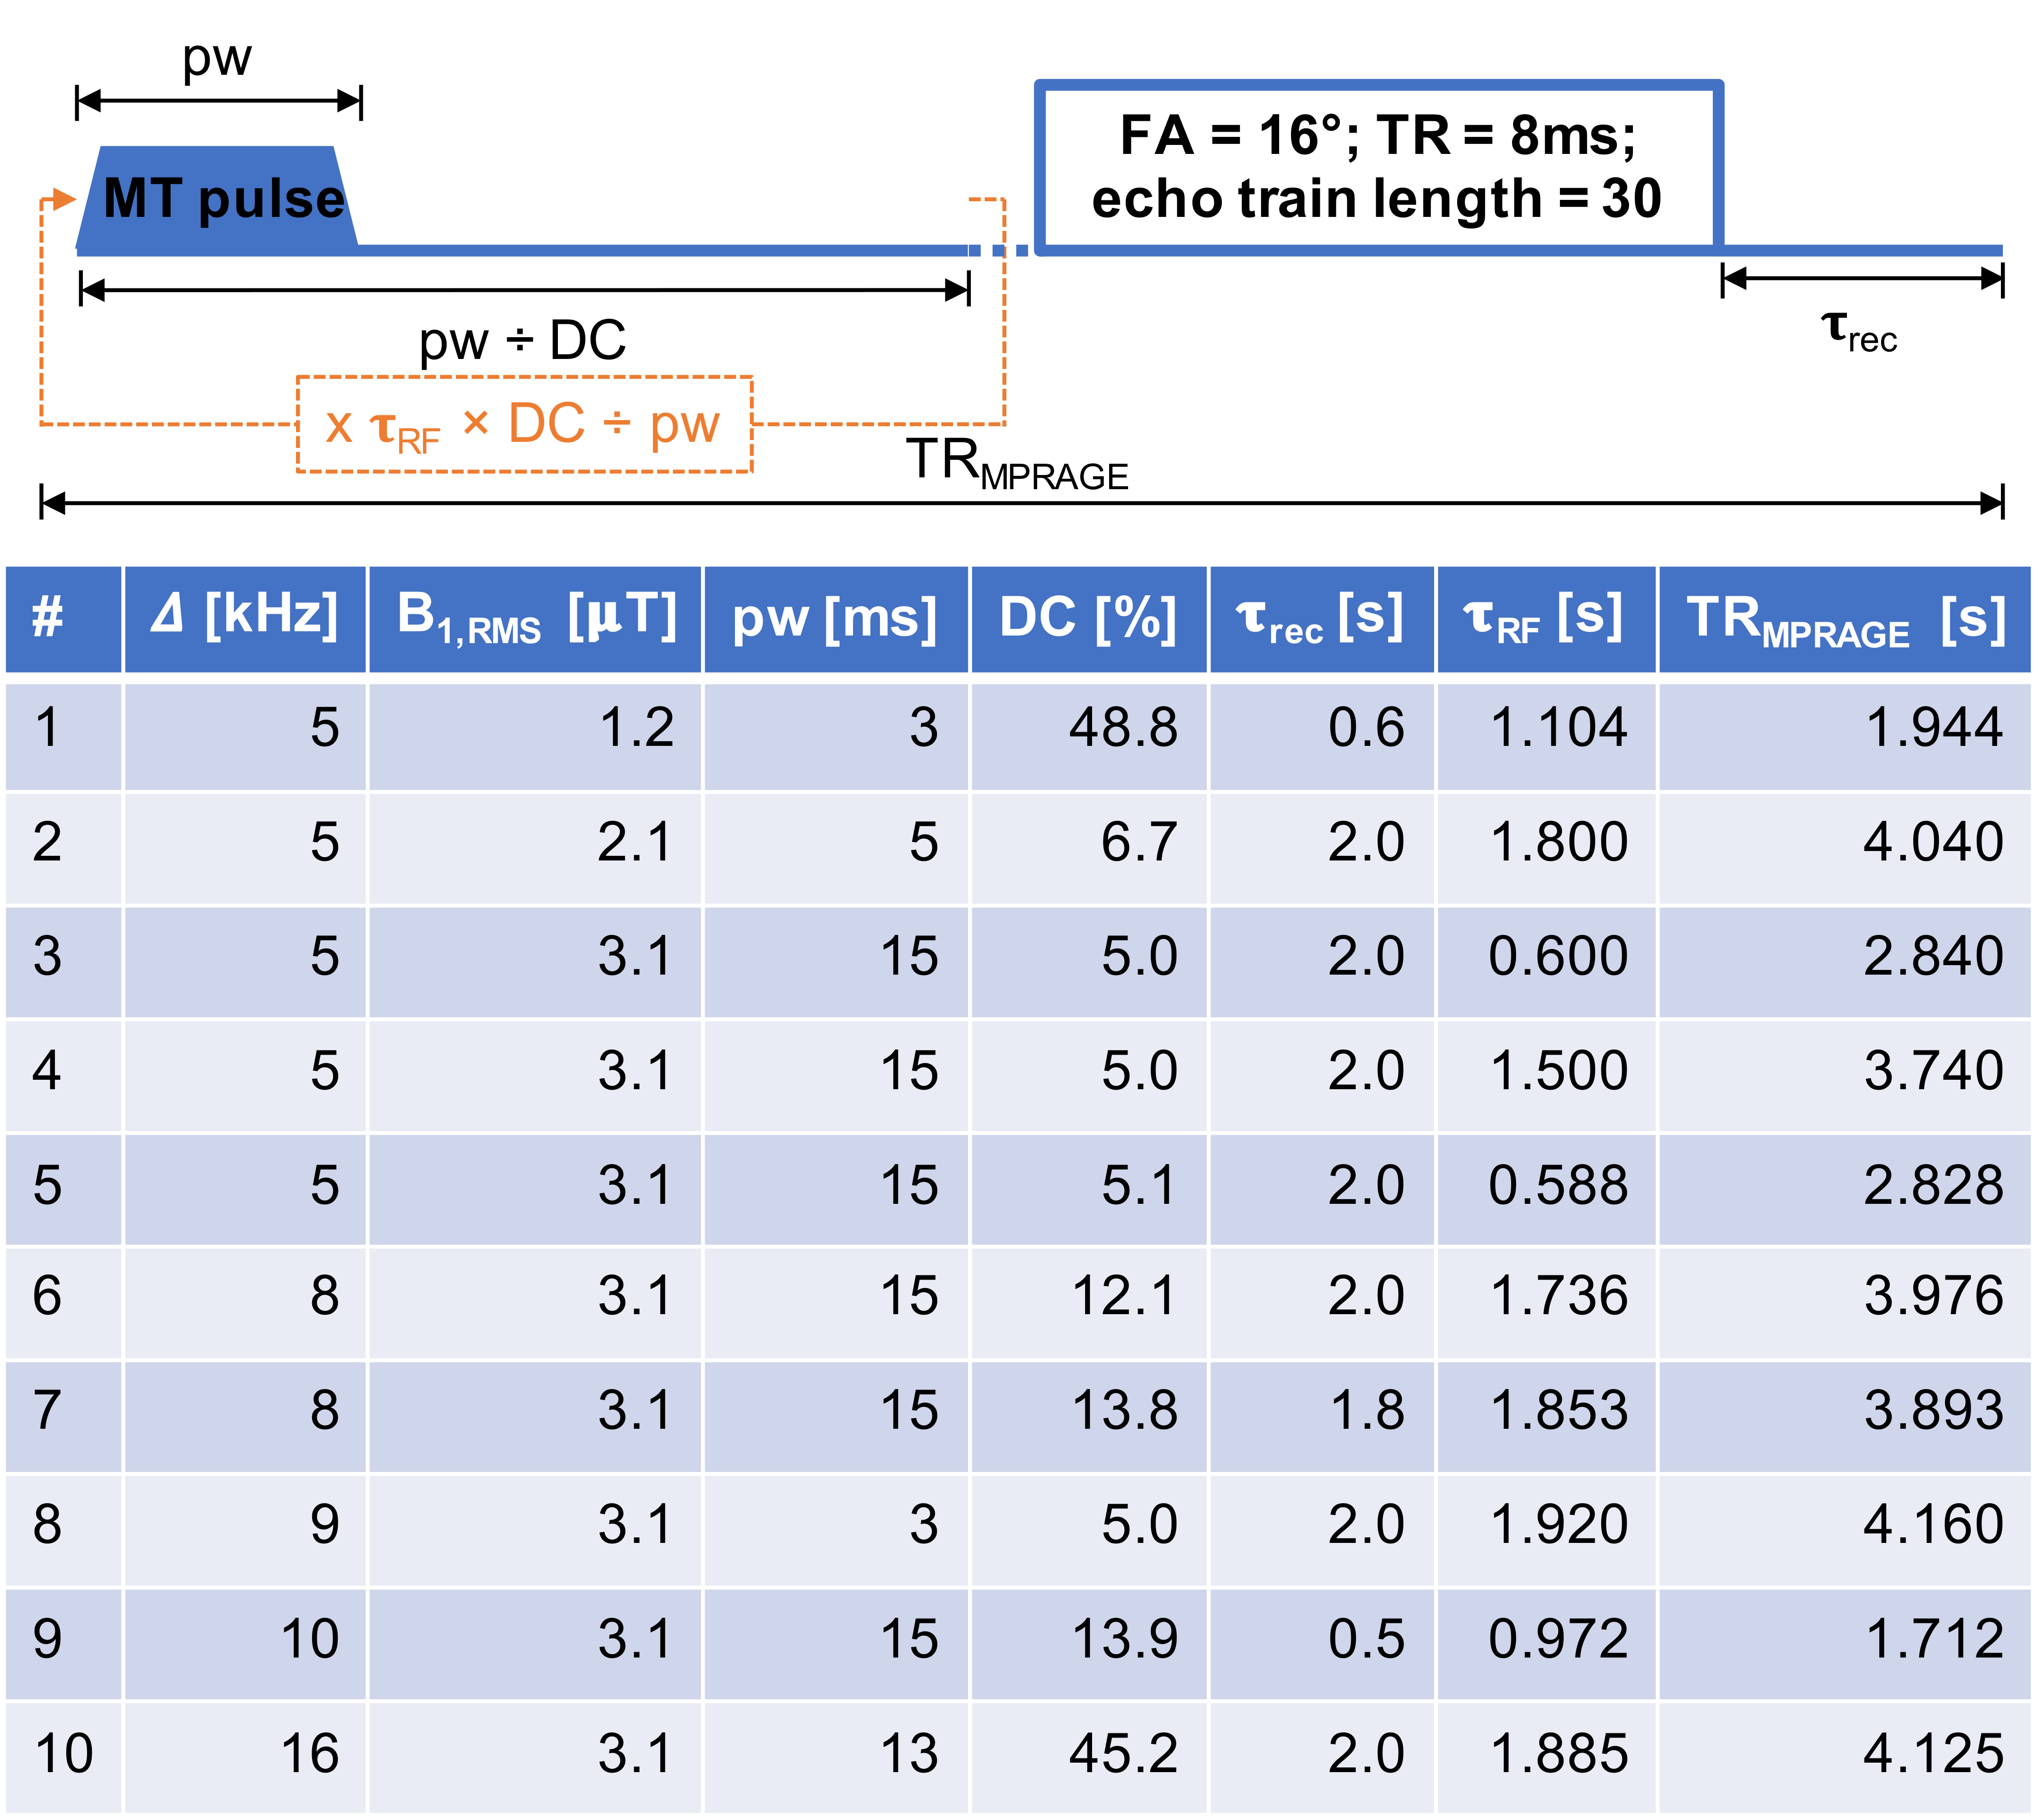
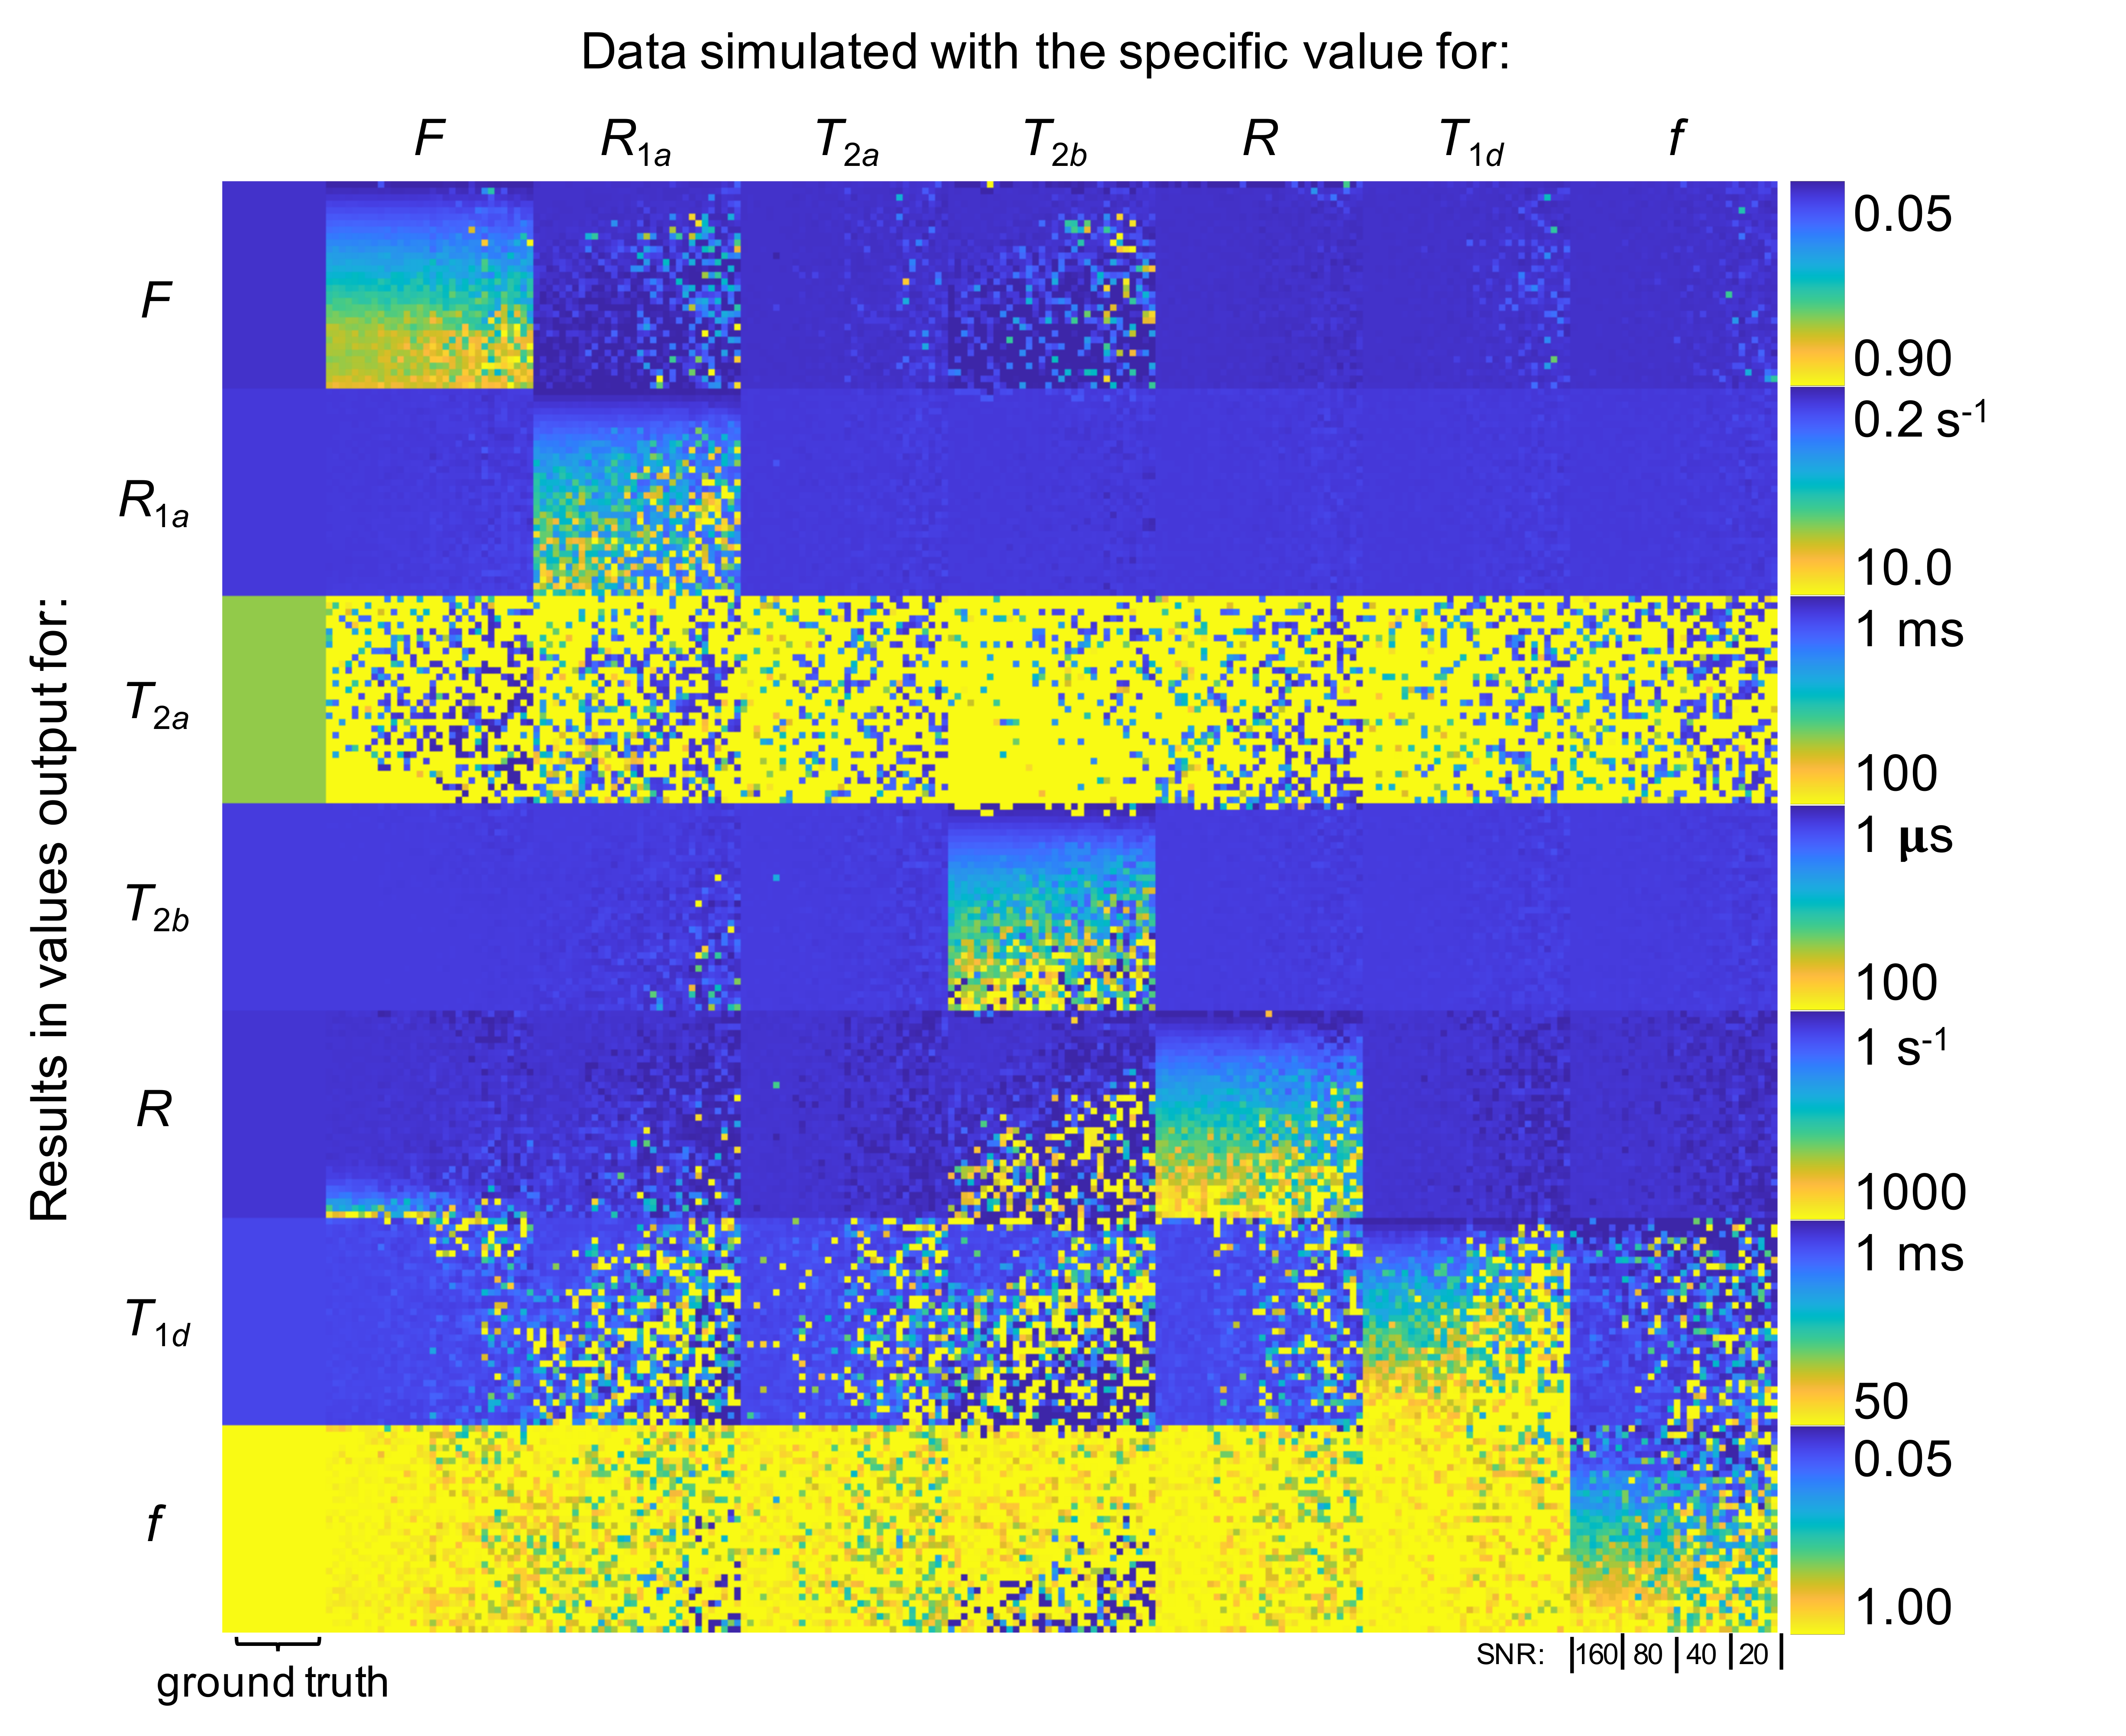
Figure 2 Results from Monte Carlo analysis of simulated ihMT data using CRLB optimized protocol. The qihMT parameters used to simulate the ihMT data are provided in the left (half sized) column. Outputs from the fit are provided in each block, with each quarter in the horizontal direction relating to SNRs of 160, 80, 40, and 20. Each simulated qihMT parameter was changed from that based on in-vivo WM separately according to the range permitted in global fits with 8 trial points. Thus, ideally only the diagonal blocks would change according to the color bars provided on the right.