1478
Comprehensive T1Ρ Measurement of in vivo Lumbar Intervertebral Discs using a 3D Adiabatic T1Ρ Prepared UTE (UTE-Adiab-T1Ρ) Sequence1Department of Radiology, UC San Diego, San Diego, CA, United States, 2Institute of Electrical Engineering, Chinese Academy of Sciences, Beijing, China, 3University of Chinese Academy of Sciences, Beijing, China, 4Department of Orthopedic Surgery, UC San Diego, San Diego, CA, United States, 5Radiology Service, Veterans Affairs, San Diego Healthcare System, San Diego, CA, United States
Synopsis
To assess the feasibility of using a 3D ultrashort echo time sequence with adiabatic T1ρ preparation (UTE-Adiab-T1ρ) to map the T1ρ of entire lumbar intervertebral discs (IVDs), 17 human subjects’ lumbar spines were scanned. Correlations between T1ρ values of all of the components of the IVD and disc degeneration grades and subjects' ages were calculated. T1ρ differences between subjects with and without low back pain were also assessed. The study showed that the UTE-Adiab-T1ρ sequence can measure T1ρ values of the whole IVD. These may be useful for assessment of IVD degeneration.
Introduction
With aging and degeneration, the intervertebral disc (IVD) undergoes changes to its morphology and biochemical composition including proteoglycan loss, dehydration, cartilaginous endplate (CEP) degradation/calcification, disc height loss, annular tears and extrusion1-3. T1ρ is a biomarker that reflects low frequency motional biological processes including macromolecule–water interactions4. Studies have demonstrated that quantitative T1ρ mapping can detect biochemical changes in IVDs during the process of degeneration4-9. To date, research on T1ρ measurements of IVDs has focused on the changes in the nucleus pulposus (NP)6,8-12, with a few studies describing T1ρ changes in the annulus fibrosis (AF)9,11-12. To the best of our knowledge, no quantitative T1ρ measurement study has been performed to evaluate the CEP during aging and degeneration. This is because conventional clinical sequences cannot capture the fast decaying CEP MR signal (i.e., short T2/T2*) effectively due to their relatively long echo times13. To address this problem, we have created a 3D ultrashort echo time sequence with adiabatic T1ρ preparation (UTE-Adiab-T1ρ) which allows T1ρ mapping of entire lumbar IVDs, including the NP, AF and CEP. Moreover, the Adiab-T1ρ preparation is much less sensitive to the magic angle effect than conventional continuous-wave T1ρ method14. In this feasibility study, 17 human subjects were scanned and IVD T1ρ values were correlated with the IVD degeneration grades and ages. The T1ρ value difference between subjects with low back pain (LBP) and without LBP (No-LBP) was also assessed.Methods
The features of the UTE-Adiab-T1ρ sequence are described in Figure 1 of reference 14. A set of spin-locking preparations containing an even number of adiabatic full passage pulses is followed by multiple UTE acquisition spokes with an equal time interval τ between acquisitions to allow fast data collection14. The signal S(TSL) at the acquisition time is given by:$$S(TSL)=M_{0}\sin\left(\alpha\right)e^{-\frac{TSL}{T_{1\rho}}}+C~~~~~~~~~~~~~[1]$$
where M0 is the equilibrium state magnetization, α is the flip angle (FA), and C is the constant describing non-T1ρ related signals.
Seventeen human subjects (43±16 years, nine females) were recruited for this study and informed consent was obtained from all of them in accordance with guidelines of the Institutional Review Board. A phased array spine coil was used for signal reception. Both the UTE-Adiab-T1ρ and a clinical 2D T2-weighted fast spin echo (T2w-FSE) sequences were used to scan the lumbar spine of each subject with a 3T clinical MRI scanner. The sequence parameters were: (i) UTE-Adiab-T1ρ sequences: TE=0.1 ms, TR=2000 ms, FA=6°, field of view (FOV)=280$$$\times$$$280$$$\times$$$56mm3, matrix=320$$$\times$$$320$$$\times$$$14, bandwidth = 250 kHz, spin lock time (TSL)=0, 34.56, 69.12, and 103.68 ms, number of spokes per-Adiab-T1ρ preparation (Nsp)=41, total scan time is around 16min; (ii) 2D T2w-FSE sequence: TE=102 ms, TR=4041 ms, slice thickness=3.5 mm, FOV=340$$$\times$$$340mm2, matrix=384$$$\times$$$384, bandwidth = 250 kHz, slice number =14, scan time=1min50sec.
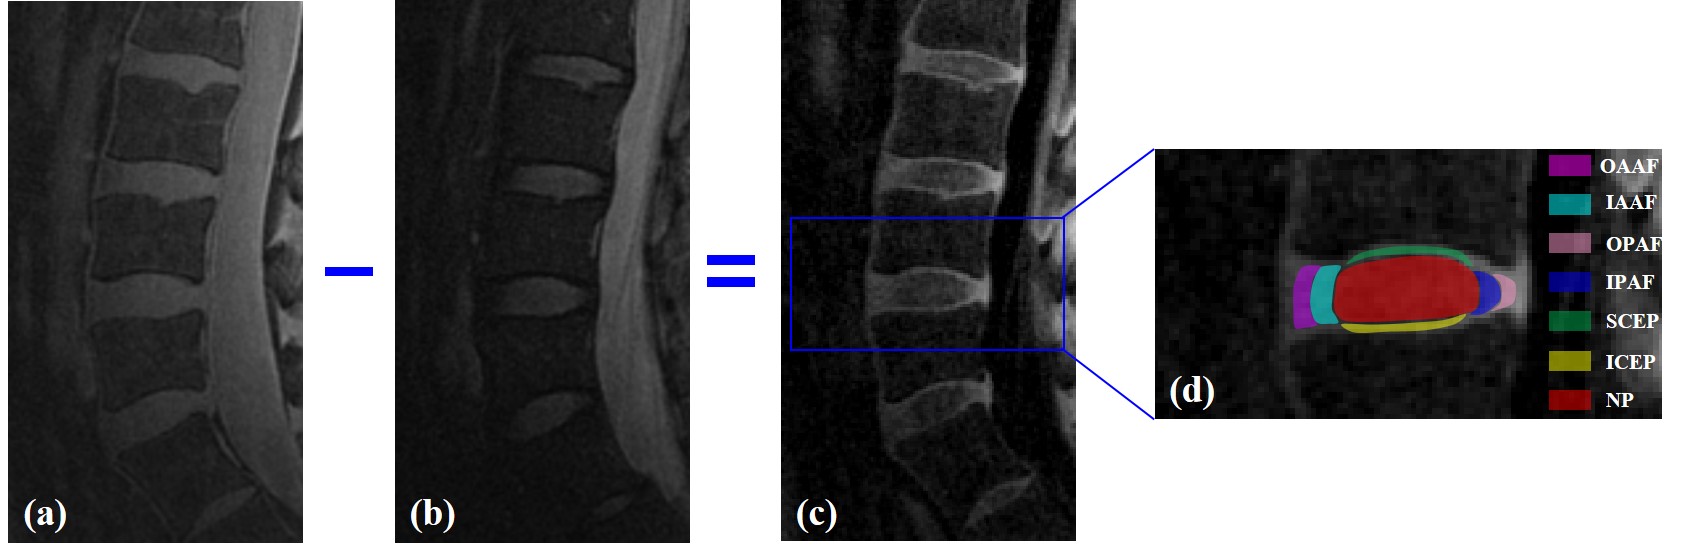
A total of 85 lumbar IVDs were analyzed. Each IVD was manually segmented into seven regions (i.e., outer anterior AF (OAAF), inner anterior (IAAF), outer posterior AF (OPAF), inner posterior AF (IPAF), superior CEP (SCEP), inferior CEP (ICEP), and NP), as shown in Figure 1. The IVDs were graded according to the modified Pfirrmann system based on the T2w-FSE images by two observers (an experienced musculoskeletal radiologist and a trained Ph.D. student). The T1ρ values of the sub-regions were correlated with the modified Pfirrmann grades and ages using Spearman's Rank Order Correlation. In addition, the T1ρ difference between subjects with and without LBP was evaluated using Student’s t-test.
Results and Discussion
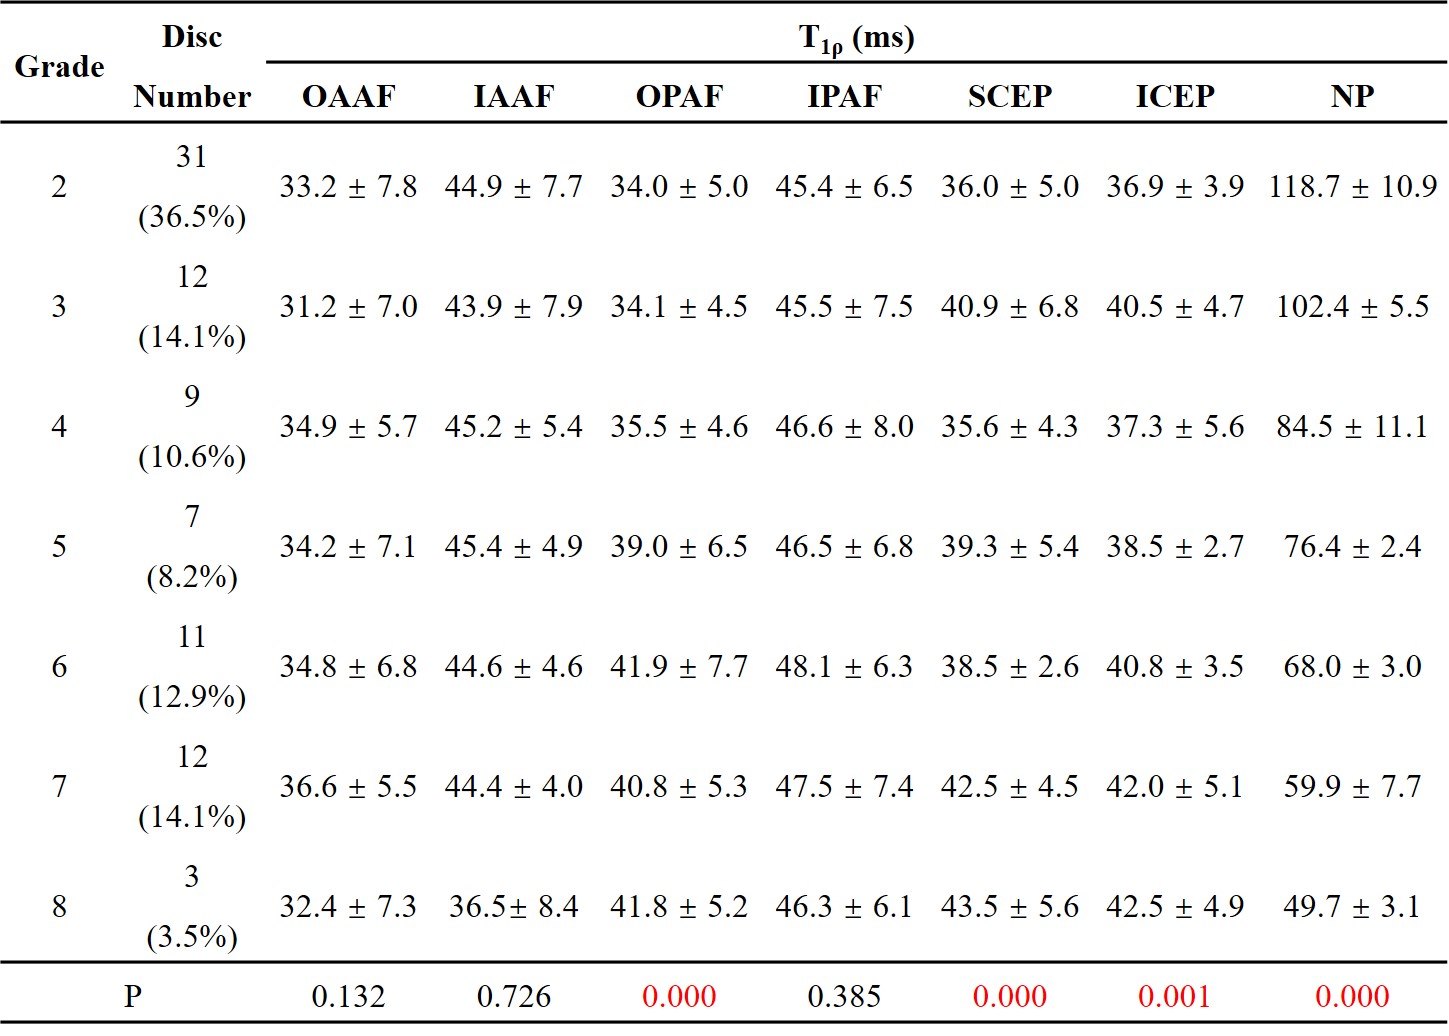
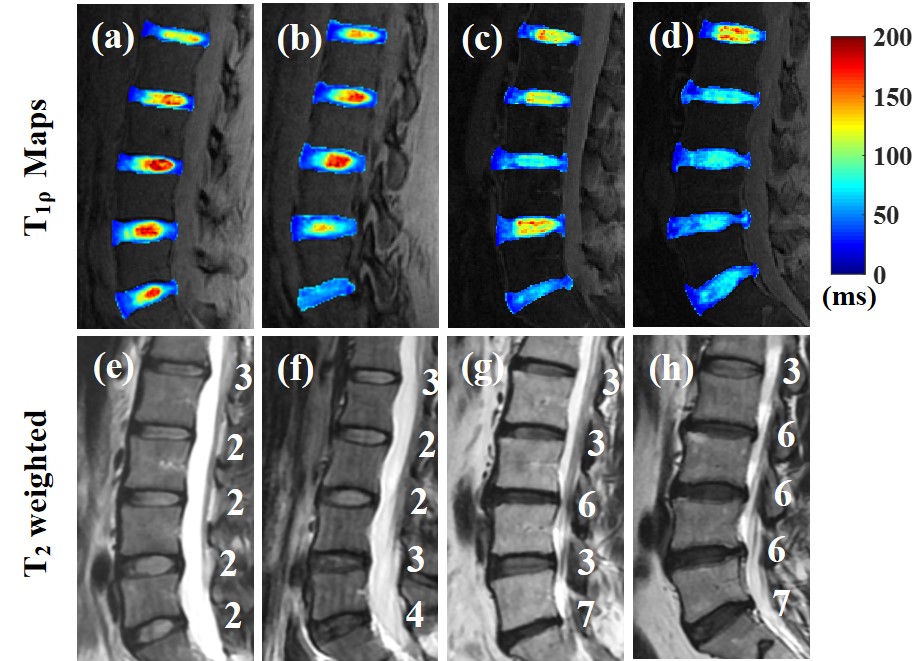
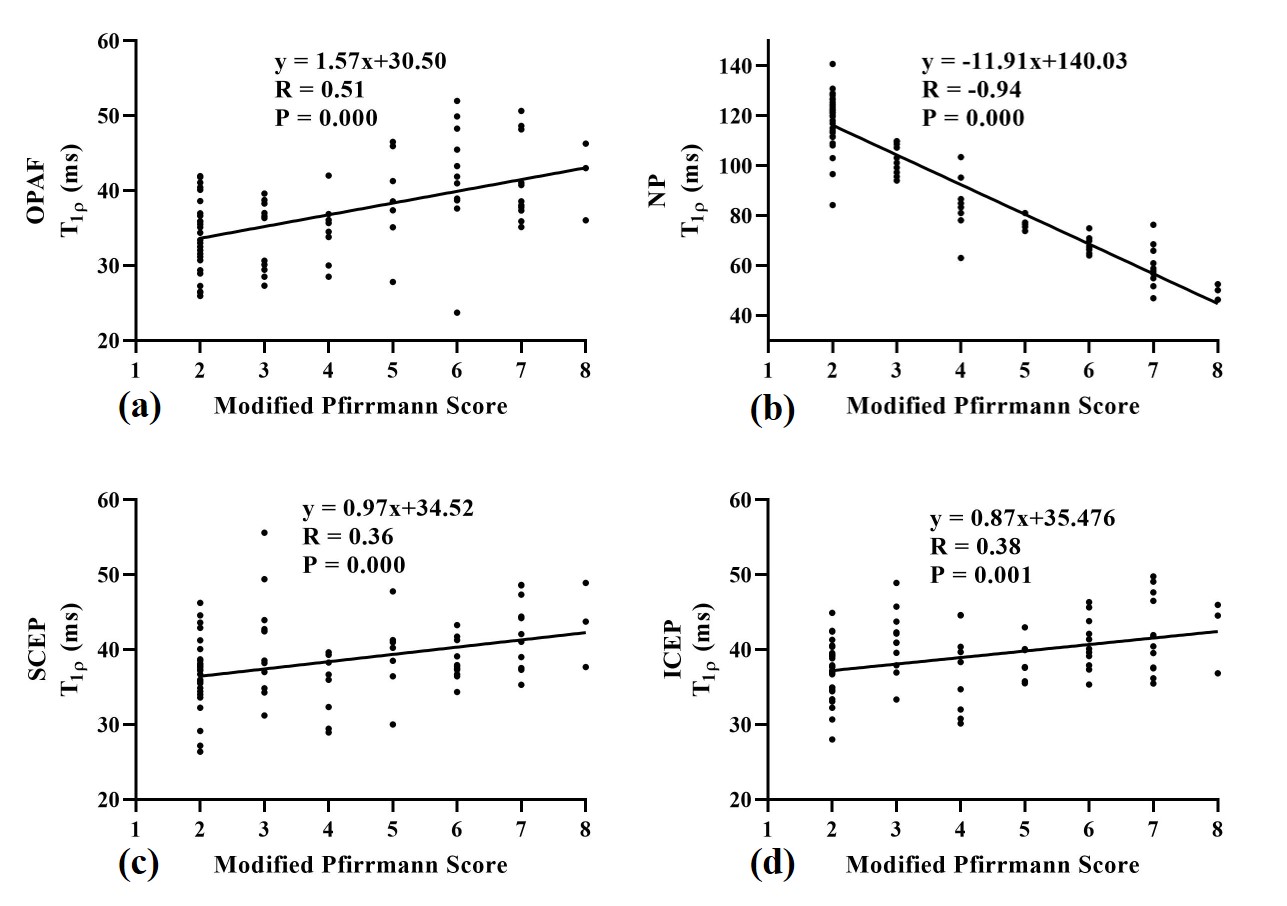
Figure 2 shows representative T1ρ maps of lumbar IVDs from four subjects with the corresponding T2w-FSE images. The T1ρ maps demonstrate that the UTE-Adiab-T1ρ sequence can measure T1ρ values of the whole IVD, including the CEP. The CEP regions were very low signal on the T2w-FSE images. Qualitatively, Figure 2 shows lower T1ρ values in the NPs of the discs that are associated with higher modified Pfirrmann grades.The IVDs were grouped by their modified Pfirrmann grades and the corresponding T1ρ values are shown in Table 1. There were significant correlations between T1ρs of the OPAF, SCEP, ICEP, and NP and modified Pfirrmann grades (P values < 0.05). The corresponding correlation coefficients were 0.51, 0.36, 0.38, and -0.94, respectively (Figure 3). These results demonstrate the potential of T1ρ values of OPAF, SCEP, ICEP, and NP as quantitative markers of lumbar IVD degeneration.
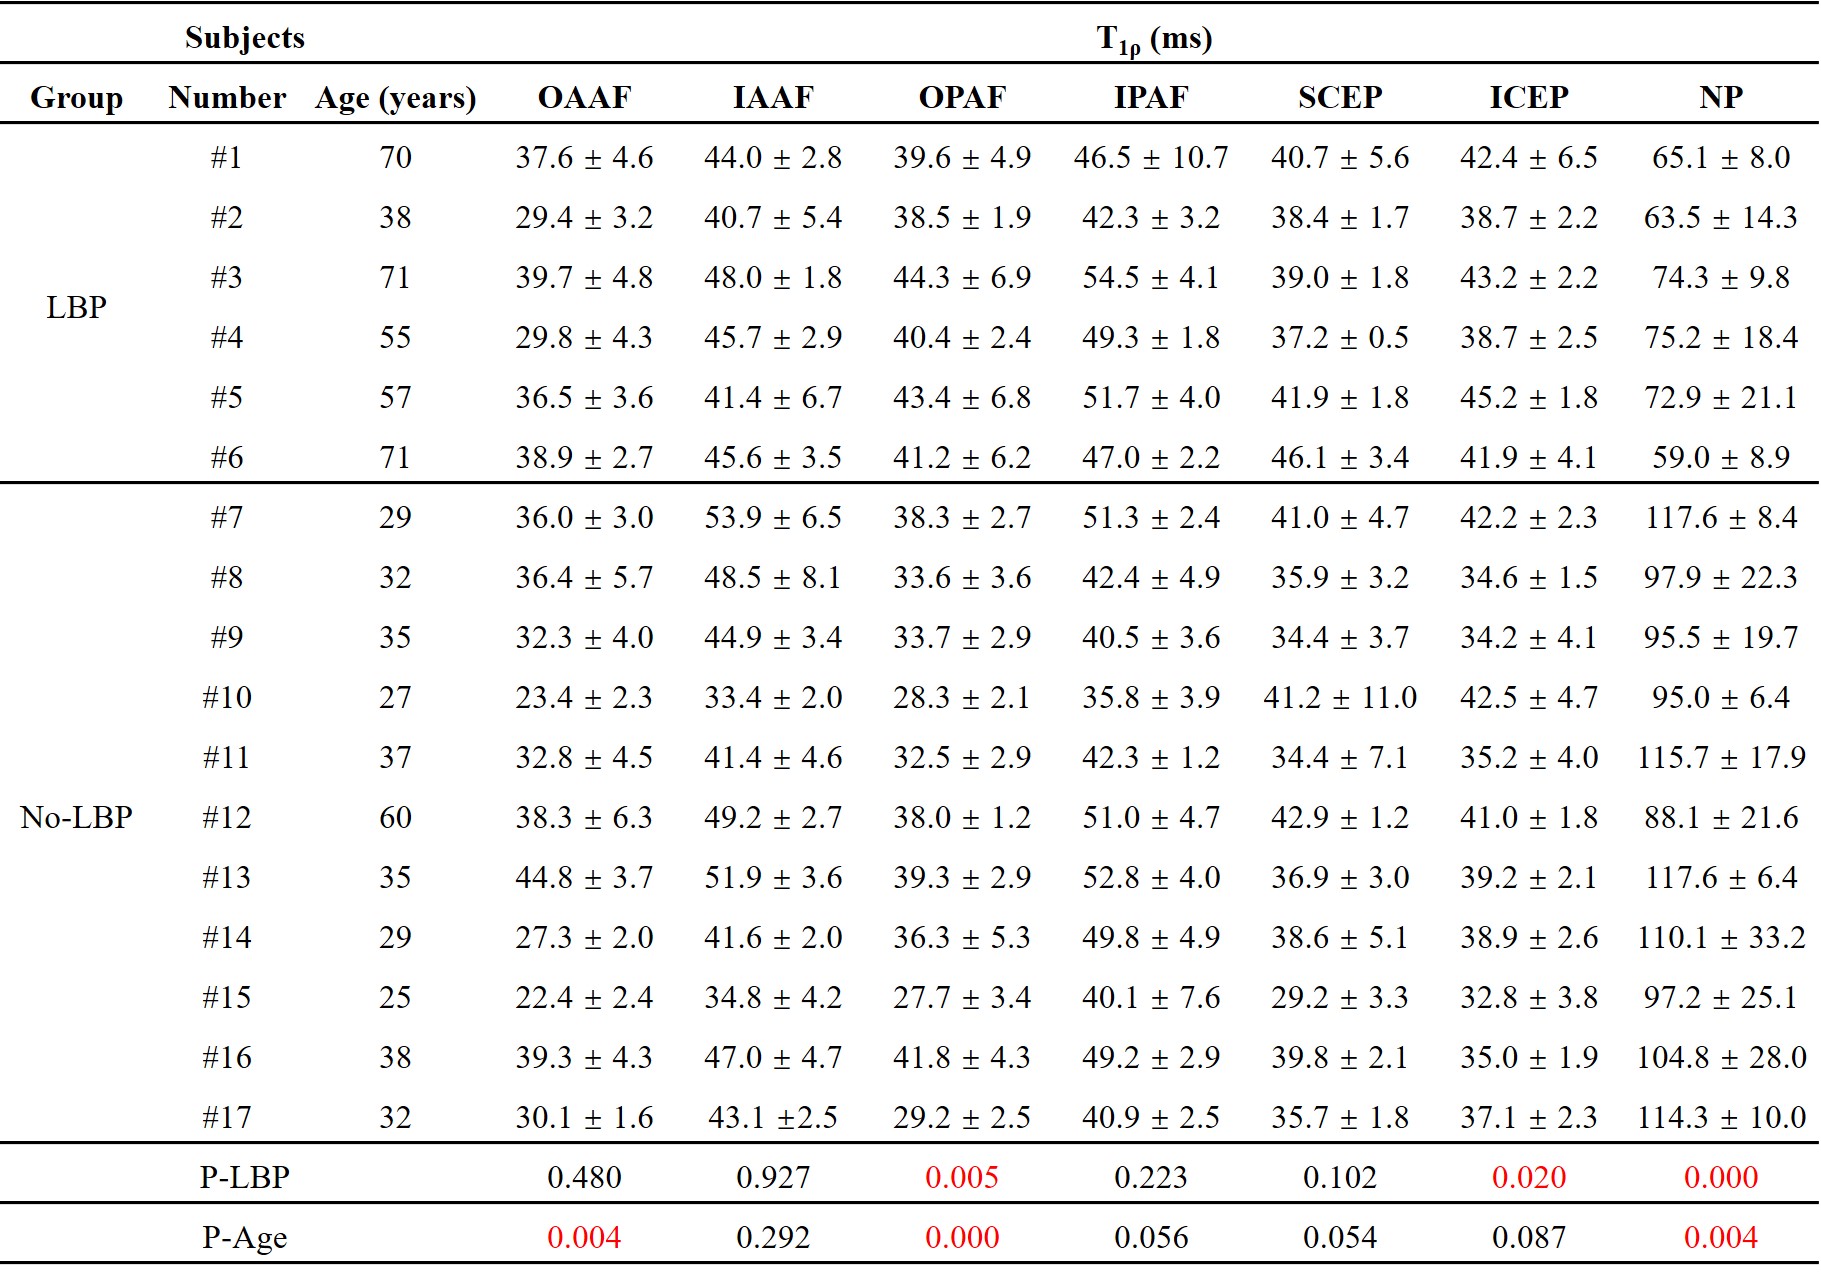
As can be seen in Table 2, the correlations between T1ρ values of the OAAF, OPAF, and NP and ages were significant with P values of 0.004, 0.000, and 0.004 (positive correlations for OAAF and OPAF and negative for NP), respectively. These findings imply that the UTE-Adiab-T1ρ measurement of the OAAF, OPAF, and NP is also associated with age. In addition, T1ρ value differences between the LBP and No-LBP groups in the OPAF, ICEP, and NP were significant with P values of 0.005, 0.020, and 0.000, respectively. These findings imply that the UTE-Adiab-T1ρ measurement of the OPAF, ICEP, and NP is related to LBP, possibly via effects due to IVD degeneration and age.
Conclusion
The 3D UTE-Adiab-T1ρ technique can provide comprehensive volumetric T1ρ mapping of all the components of the lumbar IVD including the CEP. This may be valuable for assessment of age related changes and disease in the IVD in patients with LBP.Acknowledgements
The authors acknowledge grant support from NIH (R01AR068987, R01NS092650, and R21AR075851), Veterans Affairs (I01RX002604 and I01CX001388), GE Healthcare and scholarship support from the Joint Ph.D. Training Program of the University of Chinese Academy of Sciences (UCAS).References
1. Antoniou J, Steffen T, Nelson F, et al. The human lumbar intervertebral disc: Evidence for changes in the biosynthesis and denaturation of the extracellular matrix with growth, maturation, ageing, and degeneration. J. Clin. Invest. 1996;98:996–1003.
2. Adams MA, Roughley PJ. What is intervertebral disc degeneration, and what causes it? Spine (Phila. Pa. 1976). 2006;31:2151–2161.
3. Farshad-Amacker NA, Farshad M, Winklehner A, Andreisek G. MR imaging of degenerative disc disease. Eur. J. Radiol. 2015;84:1768–1776.
4. Wáng Y-XJ, Zhang Q, Li X, Chen W, Ahuja A, Yuan J. T1ρ magnetic resonance: basic physics principles and applications in knee and intervertebral disc imaging. Quant. Imaging Med. Surg. 2015;5:858–885.
5. Nguyen AM, Johannessen W, Yoder JH, et al. Noninvasive quantification of human nucleus pulposus pressure with use of T1ρ-weighted magnetic resonance imaging. J. Bone Jt. Surg. - Ser. A 2008;90:796–802.
6. Johannessen W, Auerbach JD, Wheaton AJ, et al. Assessment of human disc degeneration and proteoglycan content using T1ρ-weighted magnetic resonance imaging. Spine (Phila. Pa. 1976). 2006;31:1253–1257.
7. Blumenkrantz G, Li X, Han ET, et al. A feasibility study of in vivo T1ρ imaging of the intervertebral disc. Magn. Reson. Imaging 2006;24:1001–1007.
8. Zhou Z, Jiang B, Zhou Z, et al. Intervertebral disk degeneration : T1ρ MR imaging of human and animal models. Radiology 2013;268:492–500.
9. Zhang Y, Hu J, Duan C, Hu P, Lu H, Peng X. Correlation study between facet joint cartilage and intervertebral discs in early lumbar vertebral degeneration using T2, T2∗ and T1ρ mapping. PLoS One 2017;12:1–14.
10. Vadala G, Russo F, Battisti S, et al. Early Intervertebral Disc Degeneration Changes in Asymptomatic Weightlifters Assessed by T1ρ-Magnetic Resonance Imaging. Spine (Phila. Pa. 1976). 2014;39:1881–1886.
11. Wang YXJ, Zhao F, Griffith JF, et al. T1rho and T2 relaxation times for lumbar disc degeneration: An in vivo comparative study at 3.0-Tesla MRI. Eur. Radiol. 2013;23:228–234.
12. Yoon MA, Hong SJ, Kang CH, Ahn KS, Kim BH. T1rho and T2 mapping of lumbar intervertebral disc: Correlation with degeneration and morphologic changes in different disc regions. Magn. Reson. Imaging 2016;34:932–939.
13. Fields AJ, Han M, Krug R, Lotz JC. Cartilaginous end plates: Quantitative MR imaging with very short echo times-orientation dependence and correlation with biochemical composition. Radiology 2015;274:482–489.
14. Ma YJ, Carl M, Searleman A, Lu X, Chang EY, Du J. 3D adiabatic T1ρ prepared ultrashort echo time cones sequence for whole knee imaging. Magn. Reson. Med. 2018;80:1429–1439.
Figures