1476
Correction of errors in estimates of T1Ρ at low spin-lock amplitudes in the presence of B0 and B1 inhomogeneities1Vanderbilt University Medical Center, Nashville, TN, United States
Synopsis
Spin-lock imaging at low locking amplitudes are sensitive to the effects of water diffusion in intrinsic gradients and may provide information on tissue microvasculature. However, although composite pulse preparations have been used to reduce artifacts due to B0 and B1 inhomogeneities, there are still residual errors. Here, we analyze the source of these errors and developed an approximate theoretical analysis to correct these errors. Simulations and experiments on a healthy human subject show that these errors are mainly due to B0 shifts, and can be reduced by this correction approach when the B0 shift is relatively small compared with w1.
Purpose
Spin-lattice relaxation rates in the rotating frame (R1ρ=1/T1ρ) measured by spin-lock methods at low locking amplitudes (w1) are sensitive to the effects of water diffusion in intrinsic gradients and may provide information on tissue microvasculature1,2, but accurate estimates are challenging in the presence of B0 and B1 inhomogeneities. Although composite pulse preparations (90x-τy/2-180y-τ-y/2-90x) have been developed to compensate for non-uniform fields3, there are residual image artifacts and errors in quantification of R1ρ and their dispersion at low w1. Here, we analyzed the source of these errors and developed an approximate theoretical analysis that provides a means to correct them.Methods
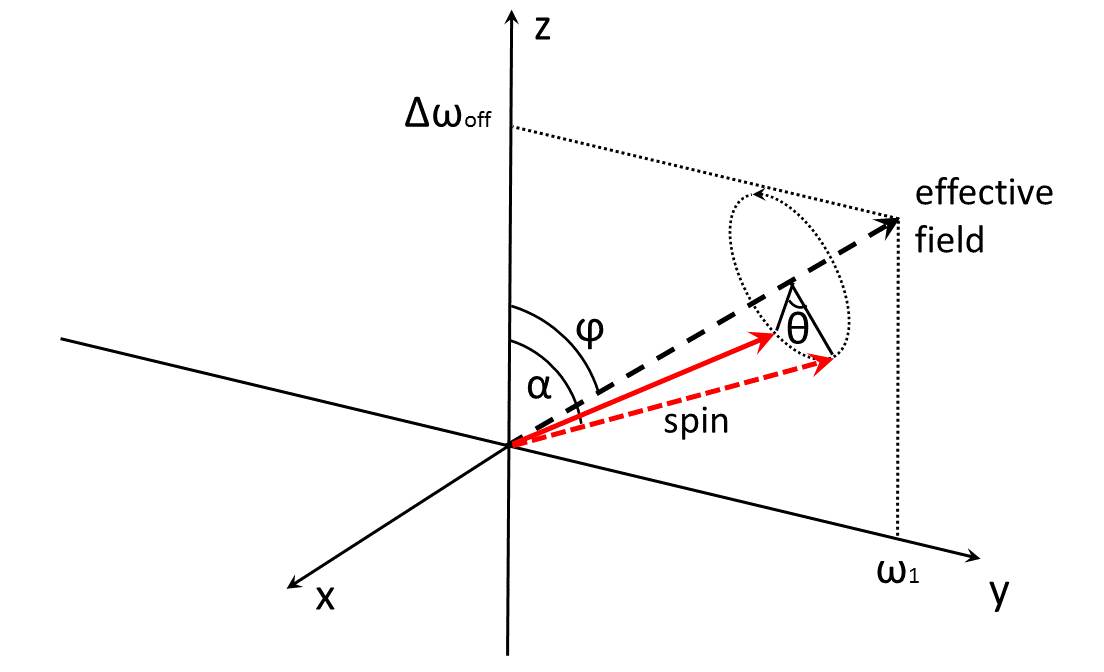
When ω1 is comparable to a local B0 shift (Δωoff), the magnetization nutates about the effective field. When there is also a B1 imperfection, the nominal 90° excitation pulse rotates the magnetization to a zenith angle of only α = β·π/2, in which β is the ratio of the actual flip angle to the nominal flip angle. Fig. 1 shows the nutation of the magnetization about the effective field at angle = θ to the effective field. The effective field itself has a zenith angle of φ and an amplitude of ω1_eff, $$φ=tan^{-1}(\omega_1/\Delta\omega_{off})$$ (1) $$\omega_{1\_eff}=\sqrt{\omega_1^2+\Delta\omega_{off}^2}$$ (2)In spin-lock imaging after the composite preparation cluster, the magnetization nutates back into the transverse plane, in which case image artifacts are reduced. However, a portion of the magnetization is not in the transverse plane during the preparation period, and so does not experience R1ρ decay, and subsequently causes errors in the quantification of R1ρ. Here, we simply separate the magnetization after the first 90x excitation pulse into two components: a transverse component which experiences R1ρ decay, and a residual longitudinal component. The transverse component (f⏊) can be calculated as the average of the projection of magnetization onto the transverse plane with θ varying from 0 to θτ/2=2π·τ/2·ω1_eff (τ = the spin-lock time) and assuming no R1ρ decay,
$$ f_⏊(\theta)=\frac{\int_{0}^{\theta_{\tau/2}}\sqrt{(\sin(\alpha-φ)\cdot\sin(\theta))^2+(\mid\cos(\alpha-φ)\sin(φ)\mid+\mid\sin(\alpha-φ)\cos(φ)\mid\cos(\theta))^2}d\theta}{\theta_{\tau/2}}$$ (3)
The residual longitudinal component will experience relatively slow R1 recovery. If there are no R1ρ or R1 decays, the spin-lock signal after the composite pulse preparation would approximately be the sum of signals from these two components. Assuming the magnetization is 1, the residual longitudinal component is then 1 - f⏊. When there are R1ρ and R1 decays, the spin-lock signal after the composite pulse preparation is approximately these two components modified by relaxation. By assuming R1ρ>>R1 and rewriting f⏊(θ) with f⏊(τ), the normalized spin-lock signal in the presence of B0 and B1 shifts (Soff) can then be described by,
$$\frac{S_{off}(\tau)}{S_0}\approx f_⏊(\tau)exp(-R_{1\rho}\tau)+1-f_⏊(\tau)$$ (4)
R1ρ can be obtained by fitting Soff/S0 to Eq. (4).
We evaluated this correction approach through both simulations of the Bloch equations and experiments on a healthy human subject. Simulations were performed of both a single-pool and a two-pool model of tissue water. The two-pool system was used to mimic self-diffusion with pool A representing water molecules that do not experience any intrinsic gradients and pool B representing water molecules that diffuse through intrinsic gradients. Self-diffusion through intrinsic gradients alters the signal similarly to proton exchange between environments with different resonance frequencies. Spin-lock images were acquired at 3T with a TSE readout and with τ of 2, 12, 22, 32, 43, 52, 62, and 72ms, and w1 of 0, 20, 50 and 100Hz. A B0 map was obtained by two images acquired with a TFE sequence with TEs of 2.14ms and 5.34ms, TR of 7.35ms, and flip angle 30º. A B1 map was obtained by two images acquired with TSE sequence with excitation flip angles of 80º and 160º, TR of 677ms, and TE of 10ms. All images were acquired with a 32-channel head coil on a 3T Philips scanner with an image resolution of 1×1×4mm.
Results
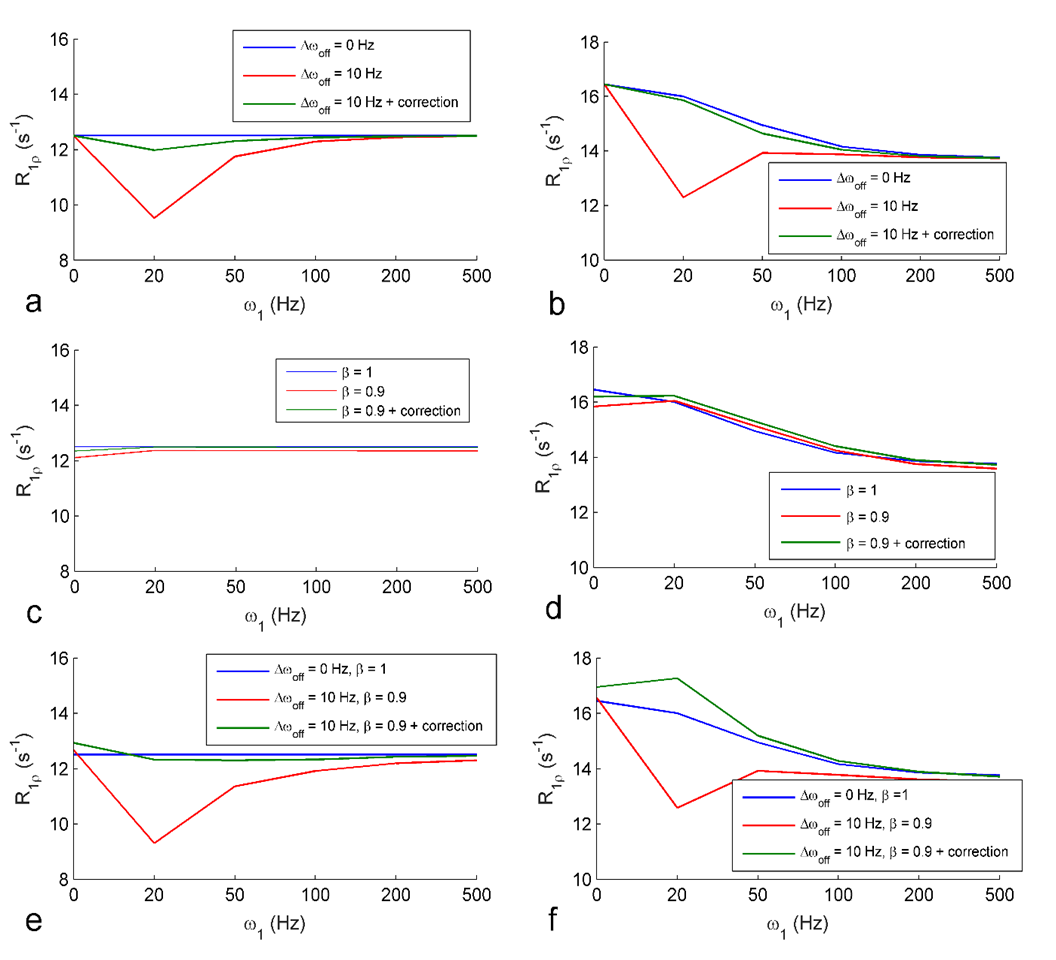
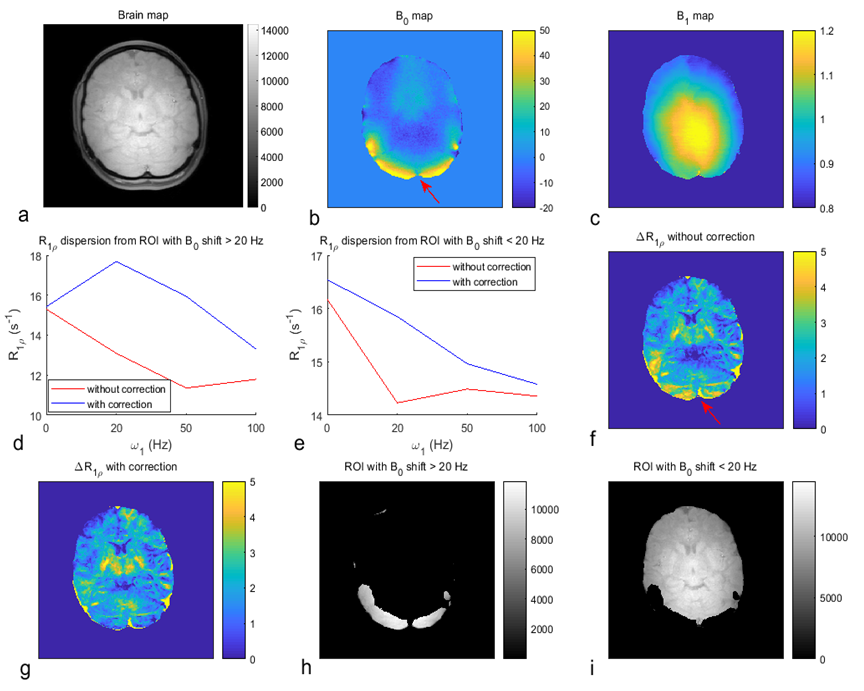
Fig. 2 shows the simulated R1ρ dispersions with a B0 shift, a B1 error, and both B0 and B1 shifts, with and without correction. Note in Fig. 2e and 2f that the artifact can be reduced by using the correction approach. Also note that there are artifacts in the presence of a B0 shift, but not a B1 shift, suggesting the source of the artifact is mainly B0 offsets. Fig. 3 shows images acquired from a healthy human subject. Note in Fig. 3b that there are severe B0 shifts in the region indicated by the red arrow. Note in Fig. 3d that the artifact from this region is not corrected, especially at low w1 (i.e. 20 and 50 Hz). In contrast, the artifact from ROIs with small B0 shift in Fig. 3e can be corrected at low w1. Although the R1ρ dispersion from the region of large B0 shift cannot be corrected with ω1 of 20 and 50 Hz, it is corrected at 100 Hz. Fig. 3f and 3g show maps of ΔR1ρ, the subtraction of two ΔR1ρ images acquired with ω1 of 0 and 100Hz, without and with correction, respectively. Note that the artifact in Fig. 3f (red arrow) is reduced in Fig. 3g.Discussion and Conclusion
The R1ρ artifact at low w1 can be reduced using this correction approach when there are small B0 shifts.Acknowledgements
No acknowledgement found.References
1. Spear JT, Gore JC. Effect of diffusion in magnetically inhomogeneous media on rotating frame spin-lattice relaxation. J Magn Reson 2014;249:80-87
2. Zu ZL, Janve V, Gore JC. Spin-lock imaging of intrinsic susceptibility gradients in tumors. Magn Reson Med 2020;83(5):1587-1595
3. Witschey WR, 2nd, Borthakur A, Elliott MA, et al. Artifacts in T1 rho-weighted imaging: compensation for B(1) and B(0) field imperfections. J Magn Reson 2007;186(1):75-85.
Figures