1475
Reproducible high-resolution T1Ρ maps of the brain in under seven minutes using compressed sensing1Advanced Clinical Imaging Technology,Siemens Healthcare AG, Bern, Switzerland, 2Translational Imaging Center, sitem-insel AG, Bern, Switzerland, 3Departments of Radiology and Biomedical Research, University of Bern, Bern, Switzerland, 4Advanced Clinical Imaging Technology, Siemens Healthcare AG, Lausanne, Switzerland, 5Department of Radiology, University Hospital (CHUV) and University of Lausanne (UNIL), Lausanne, Switzerland, 6LTS5, École Polytechnique Fédérale de Lausanne, Lausanne, Switzerland, 7Siemens Healthcare GmbH, Erlangen, Germany
Synopsis
Relaxometry in the rotating frame can give unique insights into low frequency biological processes, and therefore may be a valuable quantitative MRI method for clinical research of neurodegenerative diseases. However, T1ρ maps require long scan times for whole-brain coverage with high isotropic resolution. We present a T1ρ mapping method based on an accelerated spiral-phyllotaxis 3D Cartesian gradient echo scan with compressed sensing reconstruction that allows for <7-min acquisition time and provides maps directly at the scanner to facilitate a fast workflow for clinical applications. Our method also demonstrated excellent repeatability and reproducibility.
INTRODUCTION
T1ρ is used to study low frequency biological processes to which other contrast mechanisms are less sensitive and has therefore gained increasing interest in basic and clinical research of the brain. For example, it was shown to detect abnormalities in the white matter related to multiple sclerosis [1]. However, long acquisition times are required to obtain 3D T1ρ maps with full-brain coverage and high isotropic resolution. Additionally, offline processing to produce relaxometry maps may limit its implementation in clinical workflows.Here, we present a 3D T1ρ mapping method with an accelerated compressed sensing acquisition, and inline map reconstruction. The first goal of this study was to investigate sequence and reconstruction parameters for a full-brain protocol with 1-mm isotropic resolution and acquisition times (TA) that are feasible for clinical applications. Second, we tested the optimized protocol for repeatability and reproducibility in healthy subjects.
METHODS
IRB-approved experiments were performed in nine healthy subjects (three females, 28.6±3.3yo) at 3 T (MAGNETOM Prisma, Siemens Healthcare, Erlangen, Germany) using a commercial 64-channel head coil. In each subject, whole-brain images were acquired with a segmented 3D FLASH [2] prototype sequence employing a Cartesian variable-density spiral-phyllotaxis sampling pattern [3] in the two phase-encoding directions. Readouts of the FLASH block followed a center-out radial-like trajectory (Figure 1A). A T1ρ preparation module, with adiabatic 90° pulses [4] and a rectangular spin-lock pulse (SL) at 500 Hz, was played out before each readout train (Figure 1B). The SL pulse duration (SL-time) was changed to adjust the T1ρ-weighting of the image. Four volumes were acquired consecutively in one scan with SL-times of 2, 30, 50 and 80 ms for T1ρ mapping. Other protocol parameters included: TR=2000 ms, 160 readouts/TR, 8° FLASH RF-excitation angle, FLASH-TR/TE=5.8/1.9 ms, FOV=256x192x256 mm3, resolution=1x1x1 mm3, sagittal orientation.Reconstructions of all scans were performed inline on the scanner with a prototype compressed sensing algorithm [5] using a Haar wavelet regularization. T1ρ maps were automatically generated inline from the four SL-time volumes using a log-linear voxel-wise fit of $$$M_{t}=M_{0}\exp(-t/T_{1\rho})$$$, with t denoting the SL-time.
To optimize TA with respect to image quality, T1ρ-prepared images with SL-time=80 ms were acquired in one subject with identical protocol parameters and acceleration factors (AF)=1/1.9/3.3/4/5.1/6.1/7/8. AF=1 was used as reference to compute NRMSE and SSIM [6] for the other AFs. T1ρ maps (i.e. images with SL-time=2/30/50 ms) were acquired for AF=1.9-8 and evaluated visually by the authors.
After selection of an AF, the optimized T1ρ mapping protocol was tested in eight other subjects for repeatability where a first Reference scan was compared to a second Repeat scan performed in the same subject after repositioning during the same session. For reproducibility a third scan was performed in the same subject one week later (One-Week scan).
Additionally, an MP-RAGE [7] sequence was acquired as anatomical reference for automatic segmentation of volumes-of-interest (VOI) before each T1ρ-map scan.
Offline analysis: masks of nine bilateral VOIs (in white and gray matter, and deep brain structures) were obtained using the prototype segmentation software MorphoBox [8]. Subsequently, VOIs were rigidly registered [9] to the native space of the T1ρ maps. Median T1ρ values were extracted from each VOI, and their mean and standard deviation were computed across subjects for Reference, Repeat and One-Week scans. Linear regression and Bland-Altman analyses of the medians were performed for repeatability and reproducibility assessment [10].
RESULTS AND DISCUSSION
All scans were reconstructed directly on the scanner hardware in approximately 2 min/volume.TA for different AF are reported in Figure 2 for T1ρ-weighted images and maps. Images showed increased undersampling artifacts with increasing AF; as a result, the NRMSE increased and the SSIM decreased (Figure 2, bottom). Notably, similar visual image quality as well as NRMSE and SSIM were found for AF=4 and 5.1. Noise amplification in the center of the brain with generally poor image quality was found for AF≥7.1. Considering these results, AF=5.1 was selected as a good tradeoff between quality and TA, allowing for T1ρ mapping in <7 min. With this protocol, the reconstruction regularization factor was empirically optimized and set to 0.001.
Representative orthogonal views from one subject using the optimized protocol illustrate the image quality obtained in T1ρ-weighted images and maps (Figure 3).
In another subject, Repeat and One-Week scans show good image quality and qualitative similarity for all T1ρ weightings as well as for the maps in comparison to their Reference scan (Figure 4).
Quantitatively, mean T1ρ ranged between 95 and 110 ms in the VOIs with higher values for gray matter structures and thalamus (Figure 5A). Excellent agreement (R2=0.99) and repeatability (limits of agreement=1.2 ms) were found between Repeat and Reference measures (Figure 5B). Very good agreement (R2=0.96) and high reproducibility (limits of agreement=1.8 ms) were also found for One-Week measures (Figure 5C).
CONCLUSION
High-resolution T1ρ mapping of the whole brain is feasible with the proposed method in under 7 min with images and maps directly obtained at the scanner with reconstruction times compatible with a clinical workflow. Excellent repeatability and good reproducibility of the technique were found in a small healthy cohort. In conclusion, the proposed method may ease the use of T1ρ mapping for clinical research in both cross-sectional and longitudinal studies.Acknowledgements
No acknowledgement found.References
- Filip P et al., Rotating frame MRI relaxations as markers of diffuse white matter abnormalities in multiple sclerosis, NeuroImage: Clinical (2020), doi: https://doi.org/10.1016/j.nicl.2020.102234
- Haase A, Frahm J, Matthaei D, Hänicke W, Merboldt K‐D. FLASH imaging: rapid NMR imaging using low flip angle pulses. J Magn Reson 1986; 67: 258–266.
- Forman C, et al. High-resolution 3D whole-heart coronary MRA: a study on the combination of data acquisition in multiple breath-holds and 1D residual respiratory motion compensation. Magn Reson Mater Phy 2014;27:435-443.
- Schuenke P at al., Adiabatically Prepared Spin-Lock Approach for T1r-Based Dynamic Glucose Enhanced MRI at Ultrahigh Fields. Magnetic Resonance in Medicine 78:215–225 (2017).
- Wetzl J, Forman C, Wintersperger BJ, et al. High‐resolution dynamic CE‐MRA of the thorax enabled by iterative TWIST reconstruction. Magn Reson Med. 2017;77:833–840.
- Zhou, W., A. C. Bovik, H. R. Sheikh, and E. P. Simoncelli. "Image Qualifty Assessment: From Error Visibility to Structural Similarity." IEEE Transactions on Image Processing. Vol. 13, Issue 4, April 2004, pp. 600–612.
- Mugler JP, Brookeman JR. Three-dimensional magnetization-prepared rapid gradient-echo imaging (3D MP RAGE). Magn Reson Med. 1990;15(1):152-157.
- Schmitter, Daniel, et al. "An evaluation of volume-based morphometry for prediction of mild cognitive impairment and Alzheimer's disease." NeuroImage: Clinical 7 (2015): 7-17.
- S. Klein, M. Staring, K. Murphy, M.A. Viergever, J.P.W. Pluim, "elastix: a toolbox for intensity based medical image registration," IEEE Transactions on Medical Imaging (2010), vol. 29, no. 1, pp. 196-205.
- David Cumin (2020). Bland Altman Plot https://www.mathworks.com/matlabcentral/fileexchange/24645-bland-altman-plot), MATLAB Central File Exchange. Retrieved December 15, 2020.
Figures
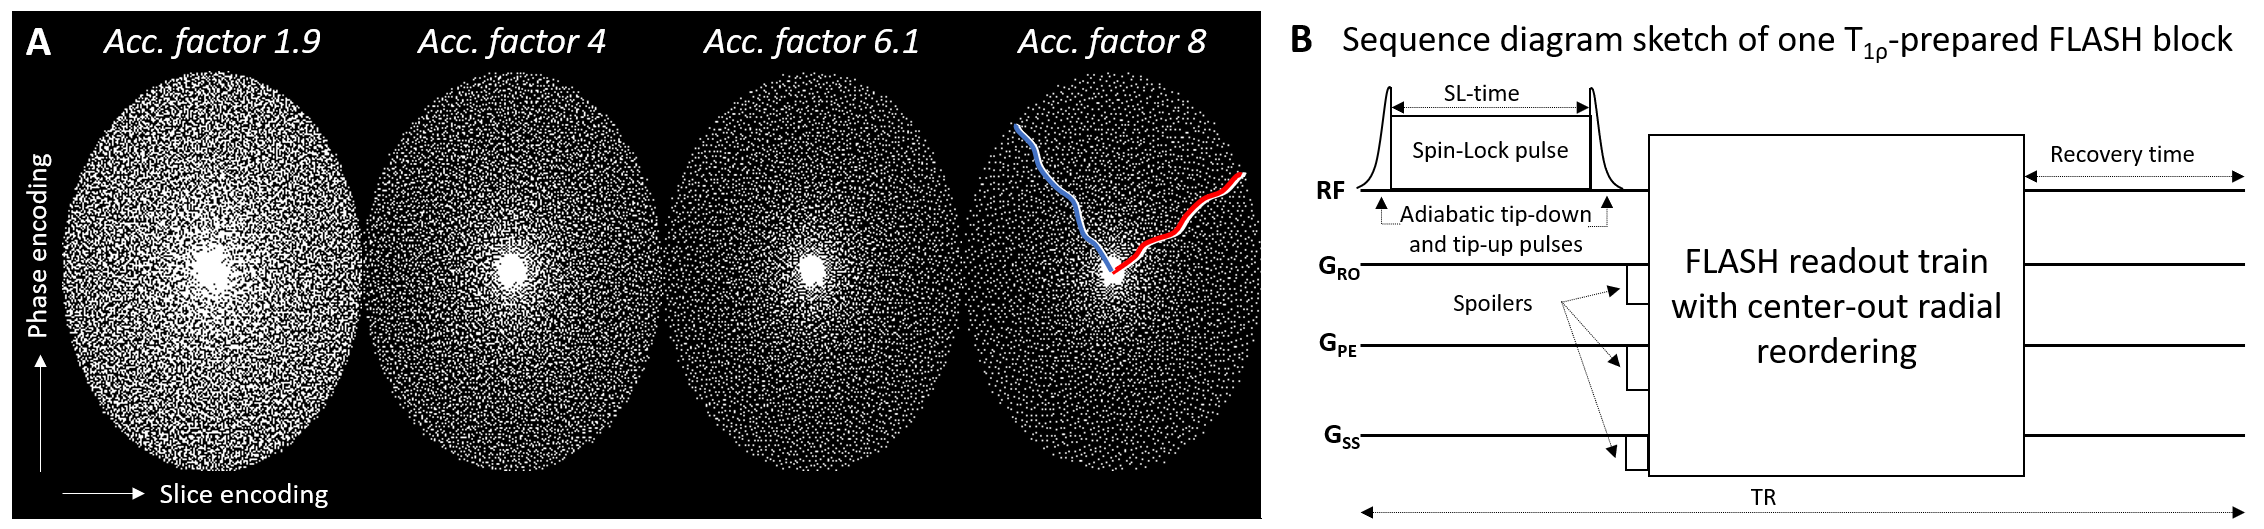
Figure 1
A) Spiral-phyllotaxis pattern in phase and slice encoding dimensions for an undersampled 3D Cartesian trajectory of the segmented FLASH sequence at selected acceleration factors. White dots indicate sampled readout lines. The red and blue lines show example center-out radial-like reordering in two FLASH segments for AF=8. B) T1ρ preparation module implemented with adiabatic tip-down pulse, rectangular spin-lock pulse of duration SL-time, and adiabatic tip-up pulse is played out before the readout train.
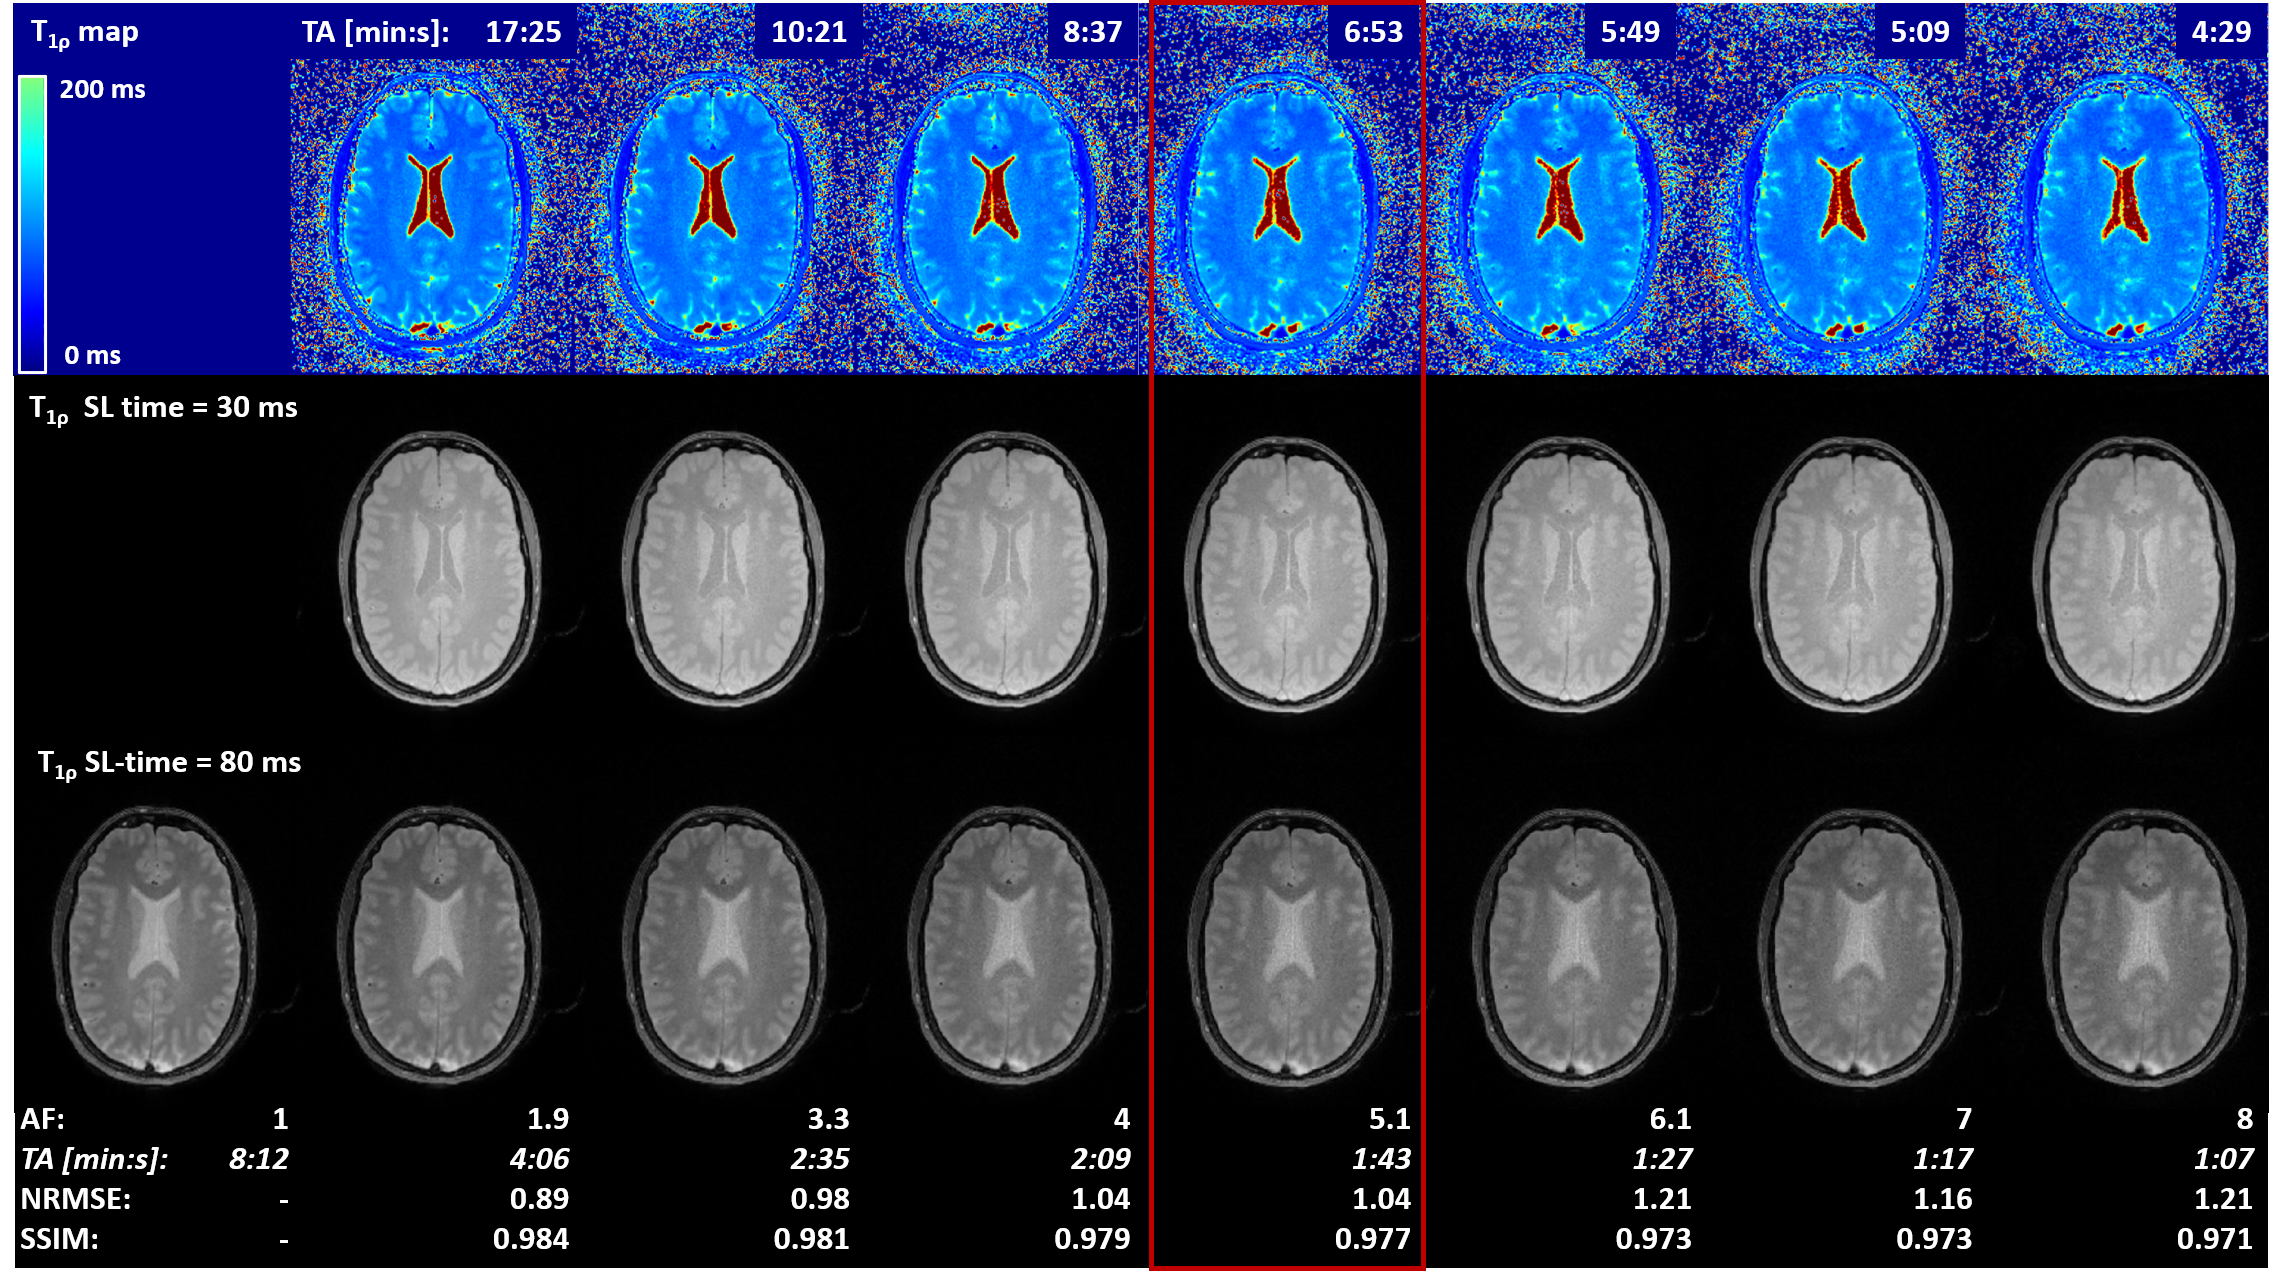
Figure 2
Optimization of T1ρ mapping sequence. Different acceleration factors (AF) were investigated in a healthy subject. Accelerated T1ρ map (top row) and T1ρ-prepared images with SL-time = 2, 30 (middle row), 50 ms were visually compared amongst each other. NRMSE and SSIM were computed for 80-ms SL-time images (bottom row) between accelerated and fully sampled (AF=1) acquisitions. Acceleration factor 5.1 was chosen as good tradeoff between acquisition time and image quality (red box) for the subsequent repeatability and reproducibility study.
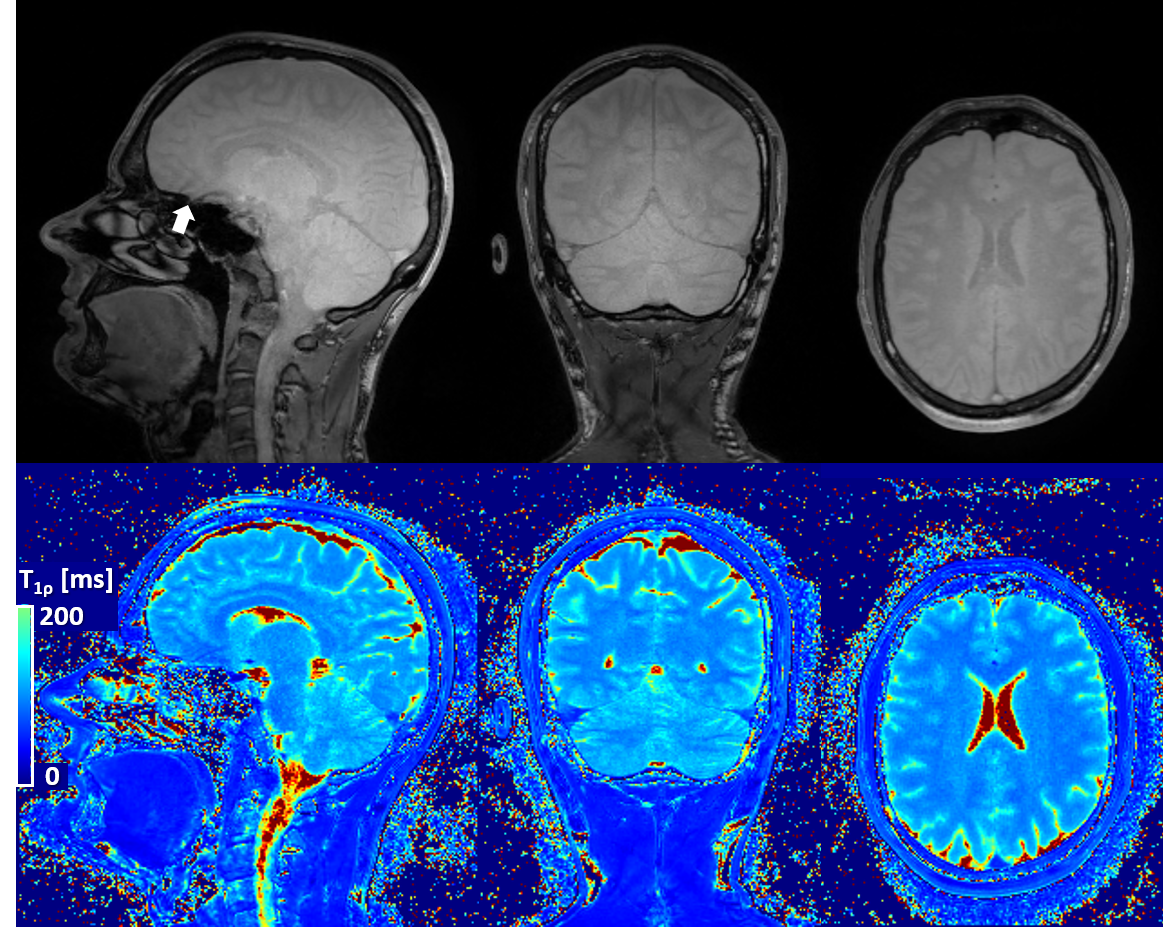
Figure 3
Representative T1ρ-prepared images (only SL-time=30 ms shown in top row) and T1ρ map (bottom row) obtained from the same acquisition. Homogenous T1ρ contrast can be observed in the whole brain, even in lower structures for SL-time=30 ms. Occasionally some artifacts may be observed above the nasal cavity due to air-tissue boundaries (arrow). Quantification of T1ρ also shows good contrast and homogeneity throughout the brain.
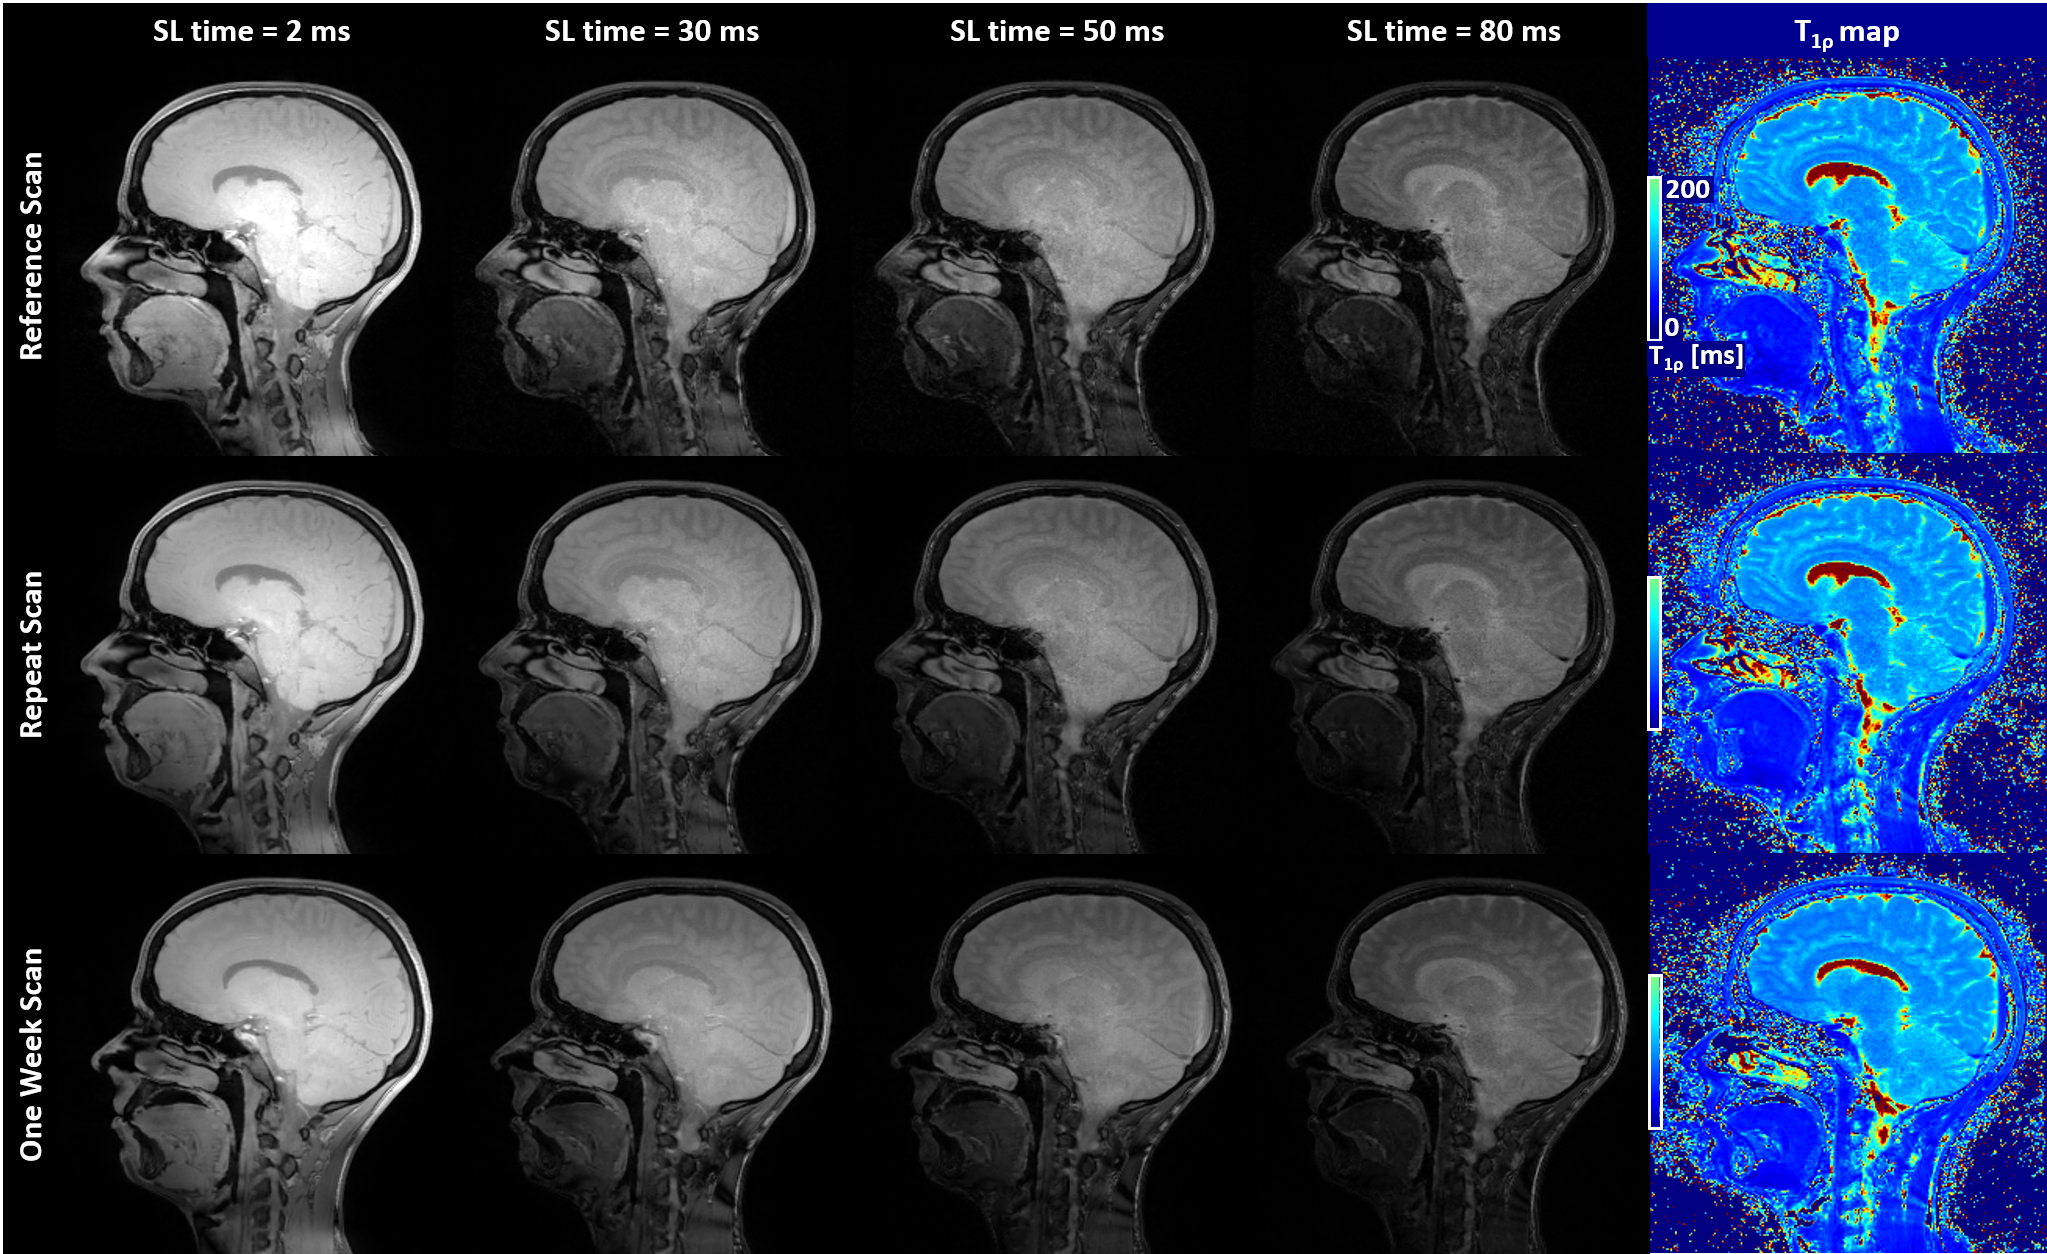
Figure 4
Example sagittal slices from T1ρ-prepared volumes and the resulting map in the same subject during Reference, Repeat and One-Week scan show increased T1ρ weighting as function of SL-time as well as good visual repeatability and reproducibility of image quality between scans.
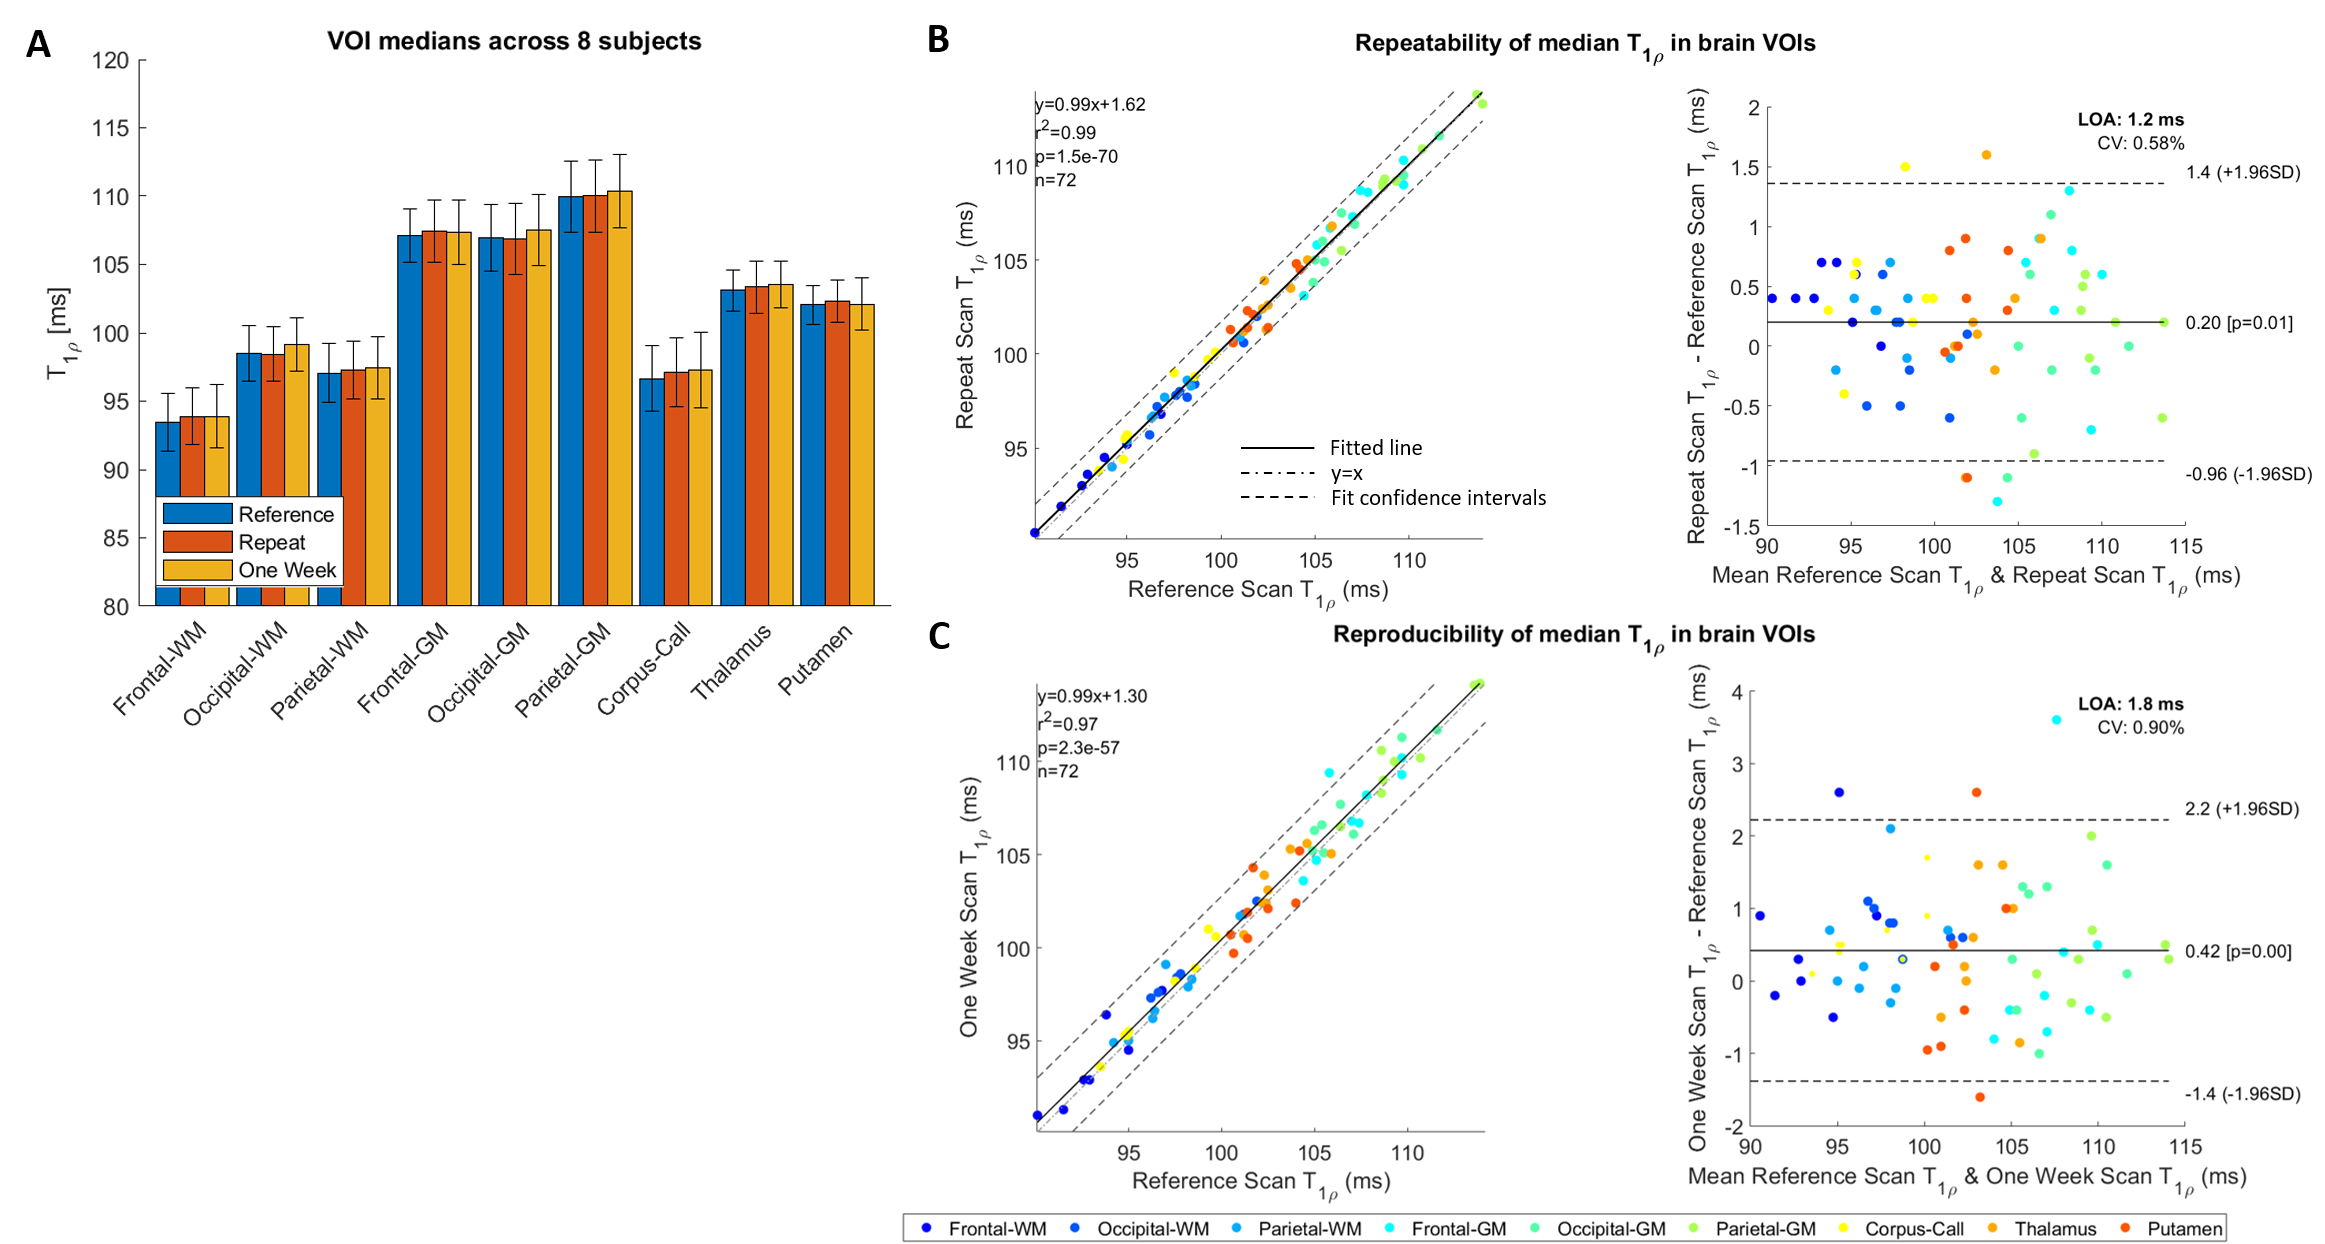
Figure 5
Quantitative results from 8 healthy subjects in 9 brain VOIs. A) Mean of T1ρ medians ranged between 90 and 115 ms in white matter, central brain, and gray matter structures. Error bars denote standard deviations. B) Repeated measures show excellent correlation (R2=0.99) and limit of agreement (LOA) as low as 1.2 ms in a Bland-Altman analysis. C) Measures obtained one week apart show high correlation (R2=0.96) and reproducibility (<2-ms LOA). Low coefficients-of-variance (CV<1%) and mean difference (<0.5 ms) resulted in both repeatability and reproducibility.