1474
Highly accelerated T1Ρ imaging using kernel-based low-rank compressed sensing reconstruction in knees with and without osteoarthritis1Department of Biomedical Engineering, Program of Advanced Musculoskeletal Imaging (PAMI), Cleveland Clinic, Cleveland, OH, United States, 2Department of Electrical Engineering, Case Western Reserve University, Cleveland, OH, United States, 3Electrical Engineering, University at Buffalo, State University of New York, Buffalo, NY, United States, 4Biomedical Engineering, University at Buffalo, State University of New York, Buffalo, NY, United States
Synopsis
The T1ρ imaging is a promising biomarker for early diagnosis of osteoarthritis, but the application of the method is hindered by its long scan time. In this work, a novel compressed sensing algorithm based on kernel-based low-rank was proposed. The algorithm was evaluated with numerical simulation and volunteer scans, where the volunteers with and without osteoarthritis was scanned with prospective downsampling to evaluate the algorithm performance regarding the presence of pathology.
Introduction
MRI T1ρ relaxation times have been suggested as promising imaging biomarkers for detecting early osteoarthritis (OA).1,2 However, the prolonged scan time to acquire multiple echoes for T1ρ mapping remains a challenge for its clinical applications. To solve this problem, compressed sensing techniques have been proposed to accelerate T1ρ imaging.3 Despite promising results, previous studies in the literature were primarily limited to retrospective downsampling and limited to healthy volunteers. In this study, we developed a novel fast T1ρ imaging using kernel-based low-rank compressed sensing reconstruction. Numerical simulations were performed to evaluate the algorithm including performances with different SNRs. Subjects with and without clinically diagnosed osteoarthritis were scanned with prospective downsampling to evaluate whether the presence of pathology will degrade the algorithm performance.Methods
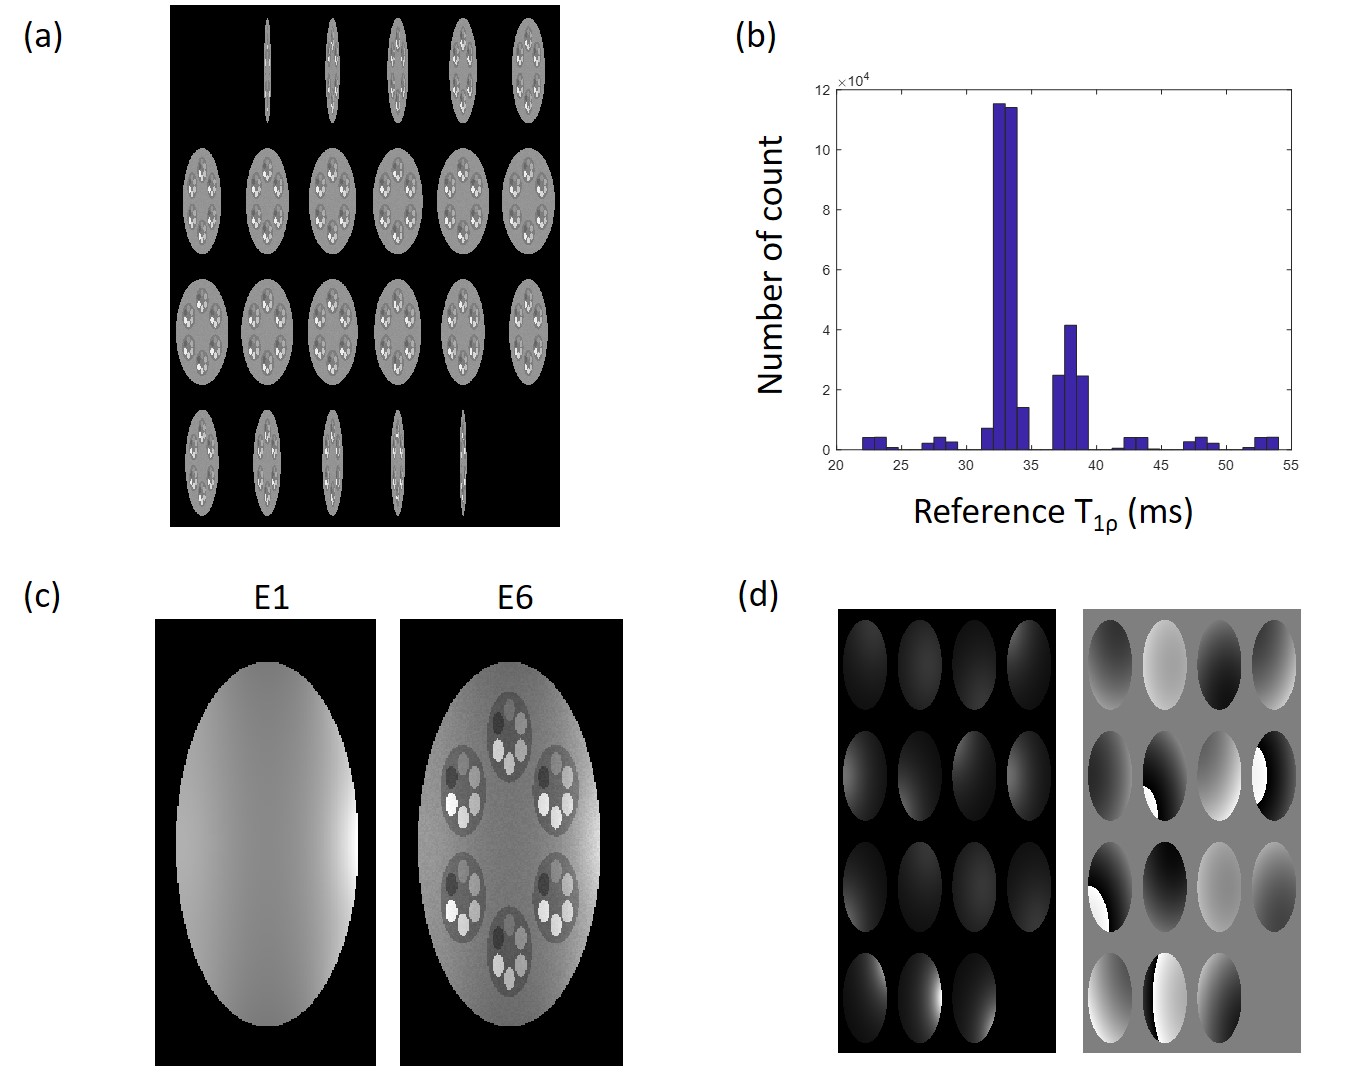
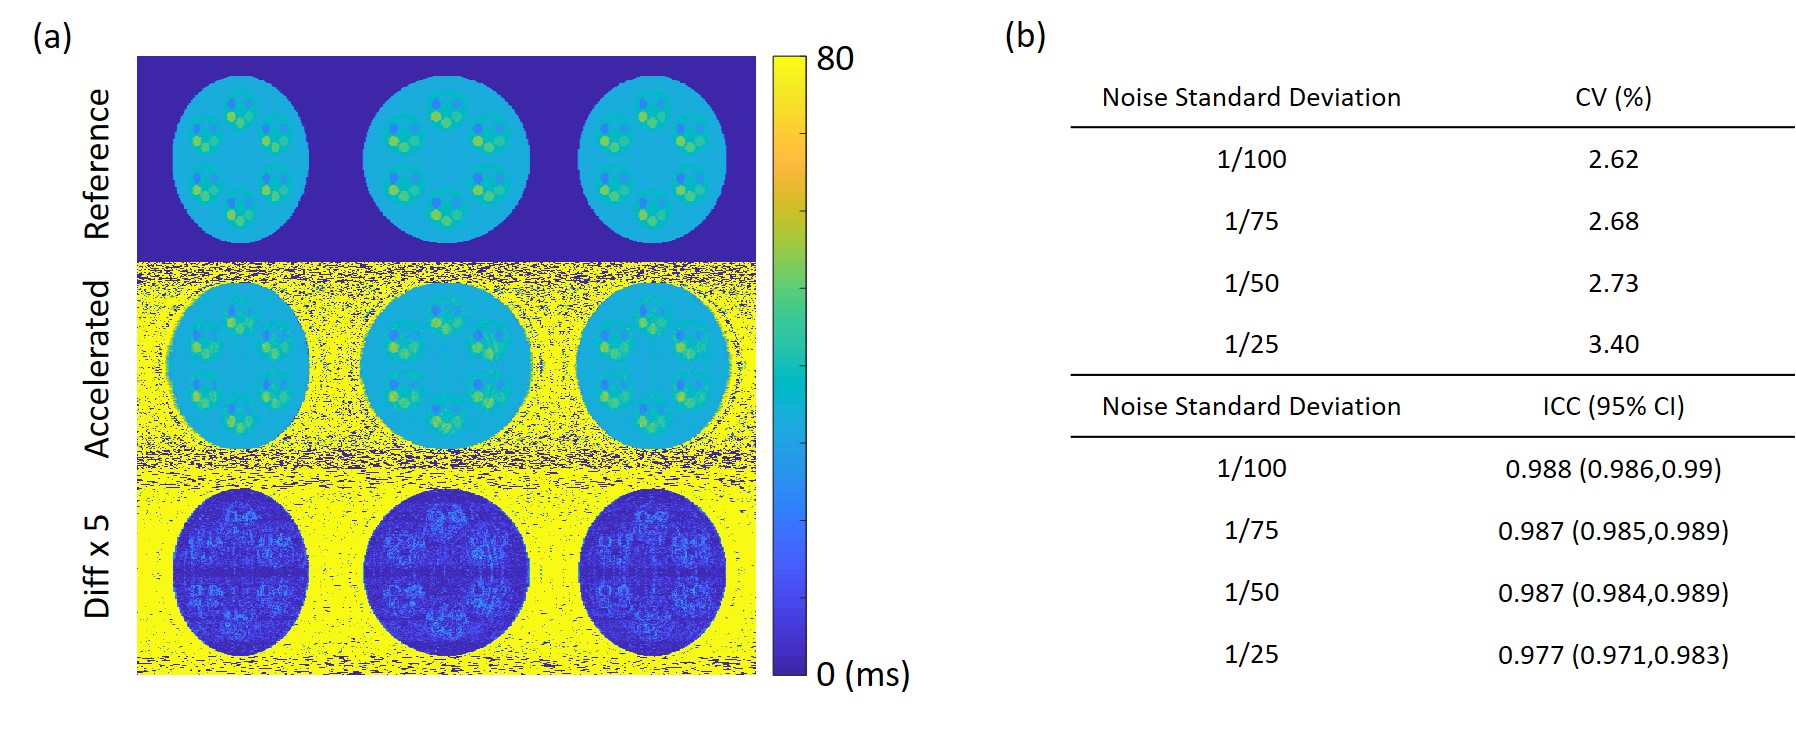
Compressed Sensing Algorithm: The underlying relationship between echo images can be mainly expressed as exponential decay, with additional factors such as noise and motion effect. To solve this complicated relationship, we used the kernel-based low-rank (KLR) method to reconstruct the images. Specifically, temporal bases were learned from low-resolution images obtained from a fully sampled center k-space of each echo. These temporal bases can represent not only the exponential model but also the noise and motion effects. Then an optimization problem was formulated by adding temporal bases as a constraint along with a data fidelity term, which can be solved by an iterative algorithm. The details of the KLR method can be found in (4).Numerical Simulation: Numerical phantom was generated to match the scan parameters from volunteer scans. The form of the phantom is shown in Figure 1. Acceleration factor (AF) of 8 was used for the reconstruction. With the reference T1ρ map, 8 echo images were generated with 4 levels of complex noise added to the image to evaluate the performance regarding signal to noise ratio (SNR). The standard deviation of 1/100, 1/75, 1/50, 1/25 was used with the first echo signal intensity of 1.
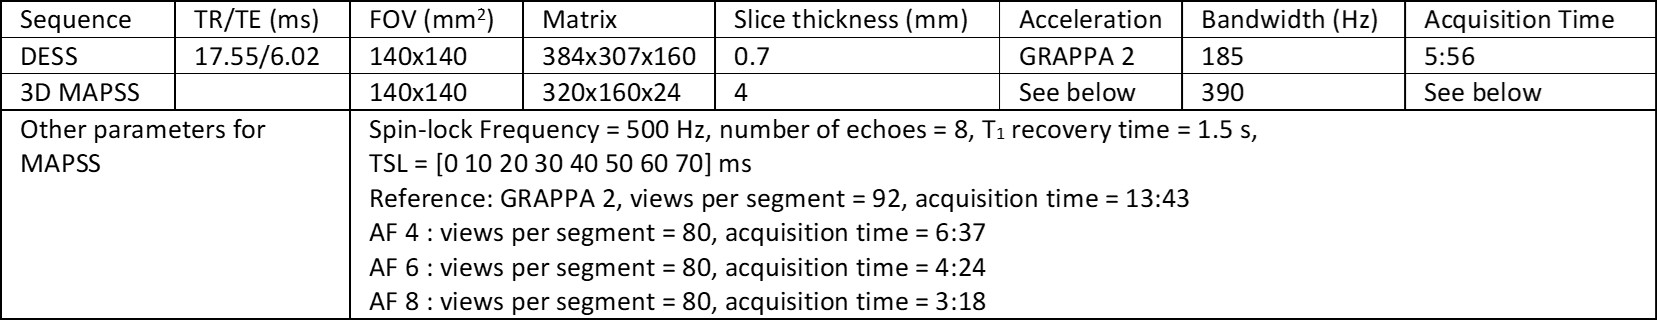
Volunteer Scan: Volunteer scans were performed with a 3T MR scanner (Magnetom Prisma, Siemens Healthcare AG, Erlangen, Germany) with a 1Tx/15Rx knee coil (QED). Eight echo 3D magnetization-prepared angle-modulated partitioned k-space spoiled gradient-echo snapshots (MAPSS) T1ρ mapping sequence5,6 was accelerated with three AFs (4, 6, and 8), along with a reference scan (parallel imaging reconstruction, Phase GRAPPA=2). Dual-echo steady-state (DESS) was also collected for automatic cartilage segmentation. Specific scan parameters are listed in Table 1. A total of nine volunteers were scanned, three with diagnosed OA. Scan/rescan with repositioning between scans was performed for repeatability evaluation. Total six compartments were automatically segmented using an in-house developed deep learning model, and the compartments included medial/lateral femur (MFC/LFC), medial/lateral tibial (MT/LT), trochlear (TRO), and patella (PAT). Coefficients of variation (CVs) and intraclass correlation coefficients (ICCs) were calculated using the mean values of each compartment between accelerated and reference measures. Bland-Altman plot was used to visualize the agreement. CVs of repeated scans were also calculated for each AF.
Results
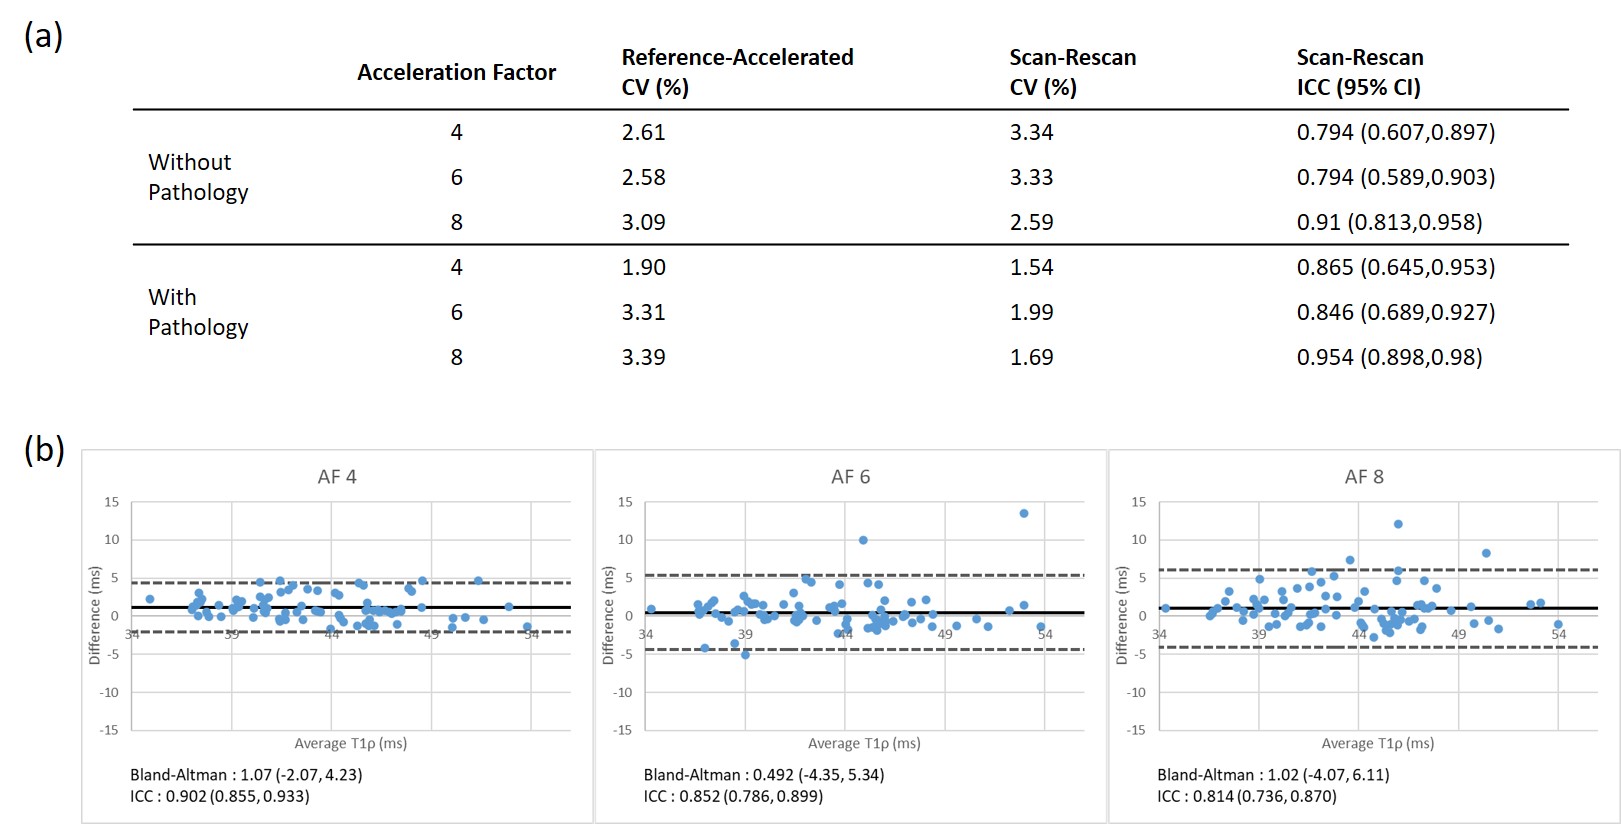
Figure 2 shows the numerical simulation result of the reconstruction algorithm. As shown in CVs and ICCs in Figure 2-b, the difference increases with a decrease of SNR, but the difference stayed within 3.5% CV.Figure 3-a shows the table of CVs and ICCs for evaluation. Volunteer scan also showed CVs smaller than 3.5%, comparable to numerical simulation. Scan/rescan CVs were also showed good repeatability, close to that of the reference scan, which was 1.71% without pathology and 2.88% with pathology. It is worth noting that these results did not show noticeable degradation with pathology. Figure 3-b shows the Bland-Altman plot of the three AFs. For all acceleration factors, a good correlation was observed between the accelerated and reference T1ρ values.
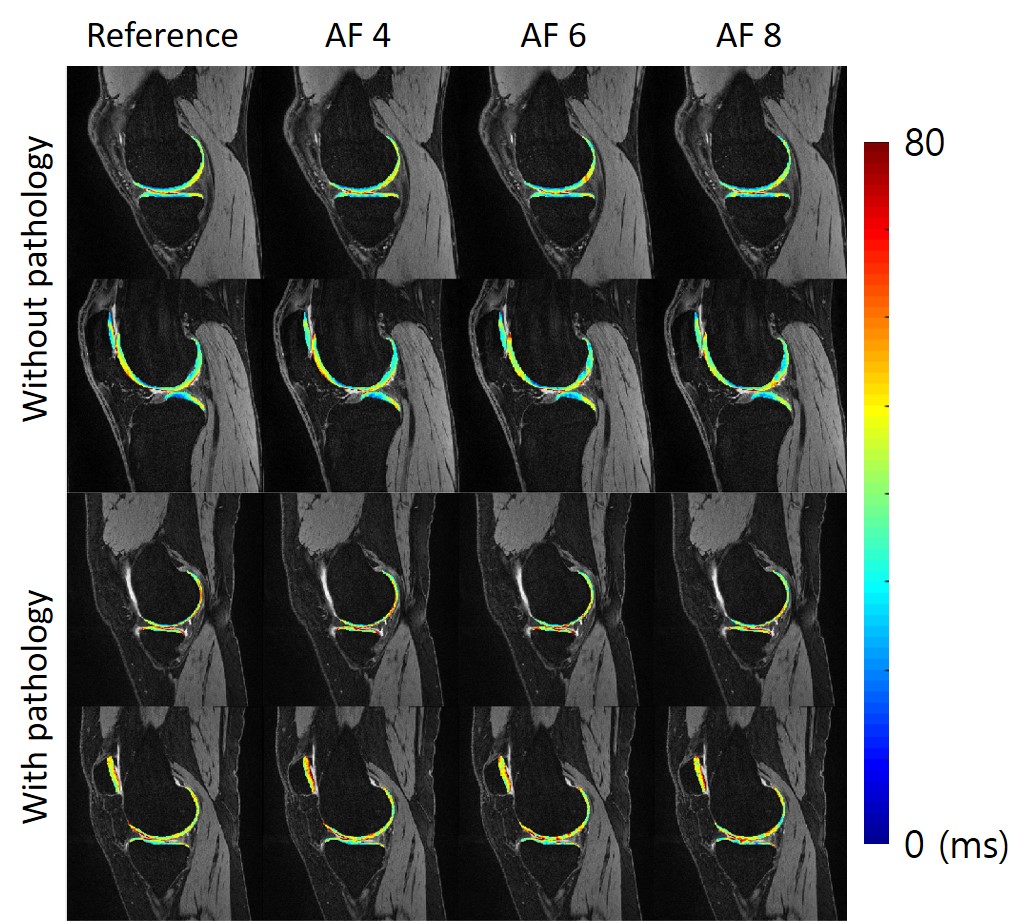
Figure 4 shows sample images of reference and accelerated T1ρ map. As can be seen from the magnified map on the right, fine details of the reference maps were well preserved with all accelerated maps.
Discussion
The numerical simulation result showed that the algorithm could reconstruct the original T1ρ map with a small error with CV<3.5% with first echo SNR>25. In human subjects, the proposed reconstruction algorithm showed a very promising result in terms of scan/rescan repeatability (CV<3.34%), which was comparable to the reference imaging method. It also yielded T1ρ values close to the reference, showing CV < 3.39%. One important finding from the results was that the reconstruction produced comparable results regardless of pathology, with no significant difference between subjects with and without pathology in terms of CVs for all acceleration factors. This implies that the reconstruction algorithm is a reliable method that could be used for fast T1ρ quantification.Conclusion
The proposed compressed sensing algorithm showed promising results for the clinical application of T1ρ mapping with a significantly reduced scan time of under 4 minutes.Acknowledgements
The study was supported by NIH/NIAMS R01 AR077452.References
1. Atkinson, Hayden F., et al. "MRI T2 and T1ρ relaxation in patients at risk for knee osteoarthritis: a systematic review and meta-analysis." BMC musculoskeletal disorders 2019;20(1):182
2. MacKay, James W., et al. "Systematic review and meta-analysis of the reliability and discriminative validity of cartilage compositional MRI in knee osteoarthritis." Osteoarthritis and cartilage 2018;26(9):1140-1152.
3. Zibetti MVW, Sharafi A, Otazo R, Regatte RR. Accelerating 3D-T1ρ mapping of cartilage using compressed sensing with different sparse and low rank models. Magn Reson Med. 2018 Oct;80(4):1475-1491.
4. Nakarmi U, Wang Y, Lyu J, Liang D, Ying L. A Kernel-Based Low-Rank (KLR) Model for Low-Dimensional Manifold Recovery in Highly Accelerated Dynamic MRI. IEEE transactions on medical imaging. 2017;36(11):2297-307
5. Li X, Han ET, Busse RF, Majumdar S. In vivo T(1rho) mapping in cartilage using 3D magnetization prepared angle-modulated partitioned k-space spoiled gradient echo snapshots (3D MAPSS). Magnetic resonance in medicine. 2008;59(2):298-307.
6. Li X, Pedoia V, Kumar D, Rivoire J, Wyatt C, Lansdown D, et al. Cartilage T1rho and T2 relaxation times: longitudinal reproducibility and variations using different coils, MR systems and sites. Osteoarthritis and cartilage. 2015;23(12):2214-23.
Figures