1472
Robust Quantitative T1rho imaging
Huimin Zhang1, Baiyan Jiang1, Jian Hou1, Queenie Chan2, and Weitian Chen1
1Imaging and Interventional Radiology, The Chinese University of Hong Kong, Sha Tin, Hong Kong, 2Philips Healthcare, Hong Kong, Hong Kong
1Imaging and Interventional Radiology, The Chinese University of Hong Kong, Sha Tin, Hong Kong, 2Philips Healthcare, Hong Kong, Hong Kong
Synopsis
T1rho is a valuable biomarker to probe macromolecular components in tissue. However, conventional T1rho quantification techniques are susceptible to B1 RF and B0 field inhomogeneities, which cause failure of spin-lock and signal oscillation. Adiabatic pulses have been used before and after spin-lock for simultaneous B1 RF and B0 field inhomogeneities compensation and have achieved robust spin-lock, but it does not remove the effect of field inhomogeneities to the actual T1rho value. Therefore, robust T1rho quantification still remains a problem. In this work, we utilized AC-iTIP and combined it with a proposed correction method to address this problem.
Introduction
T1rho imaging is a valuable technology to probe slow motional macromolecules in tissues. T1rho is typically quantified by spin-lock techniques. However, conventional spin-lock techniques are susceptible to B1 radiofrequency (RF) and B0 field inhomogeneities, which cause failures of spin-lock and quantification errors. Recently, adiabatic continuous-wave constant amplitude spin-lock (ACCSL) was reported to simultaneously compensate inhomogeneous B1 RF and B0 fields during the spin-lock. [1,2] ACCSL introduces an extra constant DC term to the conventional mono-exponential T1rho relaxation model. The presence of field inhomogeneities affects the spin-lock flip angle $$$\Theta(B_{1},B_{0})$$$, which can result in non-negligible alternations of T1rho quantification if field inhomogeneities are significant [1]. In this work, we propose methods to address these issues.Methods
Following the approaches reported in [3,4], we added a 180-degree water-selective adiabatic full passage (toggling RF pulse) ahead of ACCSL. Two data sets are collected with the toggling RF pulse turned on and off, respectively [3,4]. This is illustrated in Figure 1. According to Jiang et al.[4], the signal acquired without toggling RF pulse can be expressed as: $$S_{TSL}=S_{01}\cdot e^{\frac{TSL}{T1rho(\Theta )}}+ C. (1)$$The signal acquired with toggling RF pulse can be written as: $$S^{iTIP}_{TSL}=-S_{02}\cdot e^{\frac{TSL}{T1rho(\Theta )}}+ C. (2)$$
Subtraction of Eq. (2) from (1) yields a mono-exponential form: $$dS_{TSL}=(S_{01}+S_{02})\cdot e^{\frac{TSL}{T1rho(\Theta )}}, (3)$$ where $$$S_{01}$$$ and $$$-S_{02}$$$ are the initial magnetizations at the beginning of the spin-lock multiplied by a scaling factor. [2] Consequently, $$$T1rho(\Theta)$$$ can be obtained by fitting Equation (3) to a conventional mono-exponential relaxation model.
Under the assumption of a two-pool model consisting of a free water pool and a chemical exchange pool, with prior knowledge of the frequency of spin-lock (FSL) and field inhomogeneities, the fitted $$$T1rho(\Theta)$$$ can be corrected by an analytical equation based on the theory given by Trott and Palmer [5]: $$T1rho_{corr}=\frac{sin^{2}\Theta}{\frac{1}{T1rho(\Theta)}\frac{cos^{2}\Theta}{T_{1}}}, (4)$$ where $$$T1rho_{corr}$$$ is the corrected T1rho value. $$$T1rho_{corr}$$$ is insensitive to longitudinal relaxation time T1 [1]. In our experiments, we set T1 as a constant (1500ms) when performing the correction.
We performed a one-pool Bloch simulation in the presence of field inhomogeneities to compare ACCSL and AC-iTIP. The simulated parameters are listed as: FSL 300 Hz; B1 80% to 120% ; B0 -150Hz to 150Hz; 7 TSLs including 0, 10, 30, 50, 70, 80, 90ms; T2 43ms; T1 1153ms; and the duration of AHP and rAHP in ACCSL 35ms.
Phantom and in vivo scan were conducted using a Philips Achieva 3.0T scanner (Philips Achieva, Philips Healthcare, Best, Netherlands) with the body RF coil as the transmit. For the phantom experiment, an eight-channel head coil was used as the receiver. Four bottles of 2%, 3%, 4%, 5% agarose were used as phantoms. Imaging parameters include the field of view (FOV) 250mm×220mm, slice thickness 3mm, resolution 0.8 mm ×1mm, TE/TR 36 ms/ 2000 ms, 4 TSLs 0, 15, 60, 70ms, and spin-lock frequency 300Hz. We acquired two groups of T1rho-weighted images. Group 1 was acquired with small B0 field inhomogeneity and served as ground truth. Group 2 was acquired with large B0 field inhomogeneity and used to demonstrate the effectiveness of the proposed correction method.
In vivo experiments were performed under the approval of the institutional review board. An eight-channel T/R knee coil (Invivo, Gaineville, FL, USA) was used as the receiver. Imaging parameters were the same as the phantom, except FOV as 160mm×160mm, 3TSLs 0, 15, 60ms. Three groups of data were acquired under various B0 field. The corresponding B1 and B0 maps were acquired using conventional methods.
Results and Discussion
Figure 2 shows the simulated results. Note that AC-iTIP has a negligible C term compared to ACCSL. The T1rho error after correction is within ±0.4%. Figure 3 shows the phantom results. Since AC-iTIP removes the extra C term, its signal follows a mono-exponential decay. Note that after applying the correction, the corrected T1rho map is comparable to the ground truth. Figure 4 shows the in vivo results. Note T1rho maps without correction have significant variations at different levels of field inhomogeneities. In contrast, such variations of T1rho are significantly reduced after our proposed correction method. These results demonstrated the proposed method can achieve robust T1rho quantification in presence of field inhomogeneities.Conclusion
The AC-iTIP approach can remove the extra term introduced by ACCSL while achieving robust spin-lock. The analytical correction improves the robustness of T1rho quantification in the presence of B1 RF and B0 field inhomogeneities.Acknowledgements
This study is supported by a grant from the Innovation and Technology Commission of the Hong Kong SAR (Project MRP/001/18X), Faculty Innovation Award from the Faculty of Medicine, the Chinese University of Hong Kong, and a grant from the Research Grants Council of the Hong Kong SAR (Project SEG CUHK02).References
- Chen, W. (2017). Artifacts correction for T1rho imaging with constant amplitude spin-lock. Journal of Magnetic Resonance, 274, 13-23.
- Jiang, B., & Chen, W. (2018). On‐resonance and off‐resonance continuous wave constant amplitude spin‐lock and T1ρ quantification in the presence of B1 and B0 inhomogeneities. NMR in Biomedicine, e3928.
- Jin, T., & Kim, S. G. (2012). Quantitative chemical exchange sensitive MRI using irradiation with toggling inversion preparation. Magnetic Resonance in Medicine, 68(4), 1056-1064.
- Jiang, B., Jin, T., Blu, T., & Chen, W. (2019). Probing chemical exchange using quantitative spin‐lock R1ρ asymmetry imaging with adiabatic RF pulses. Magnetic Resonance in Medicine, 82(5), 1767-1781.
- Trott, O., & Palmer III, A. G. (2002). R1ρ relaxation outside of the fast-exchange limit. Journal of Magnetic Resonance.
Figures
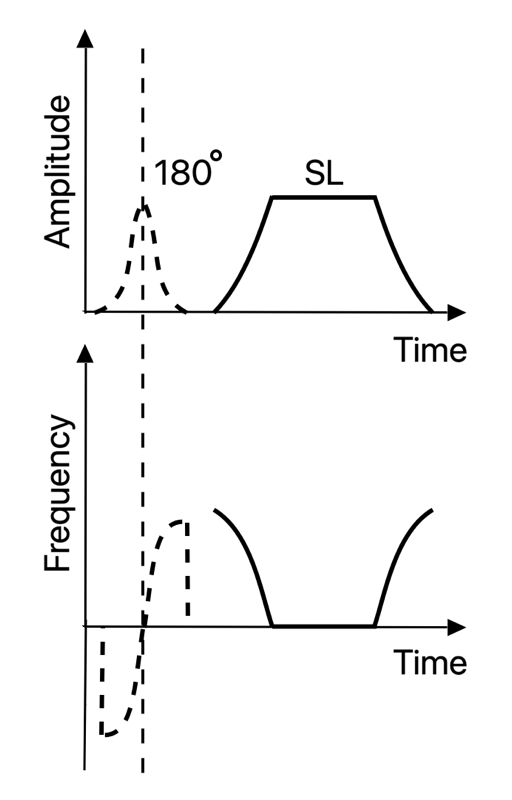
Figure 1. Amplitude and frequency waveforms
of the acquisition methods used in this work.
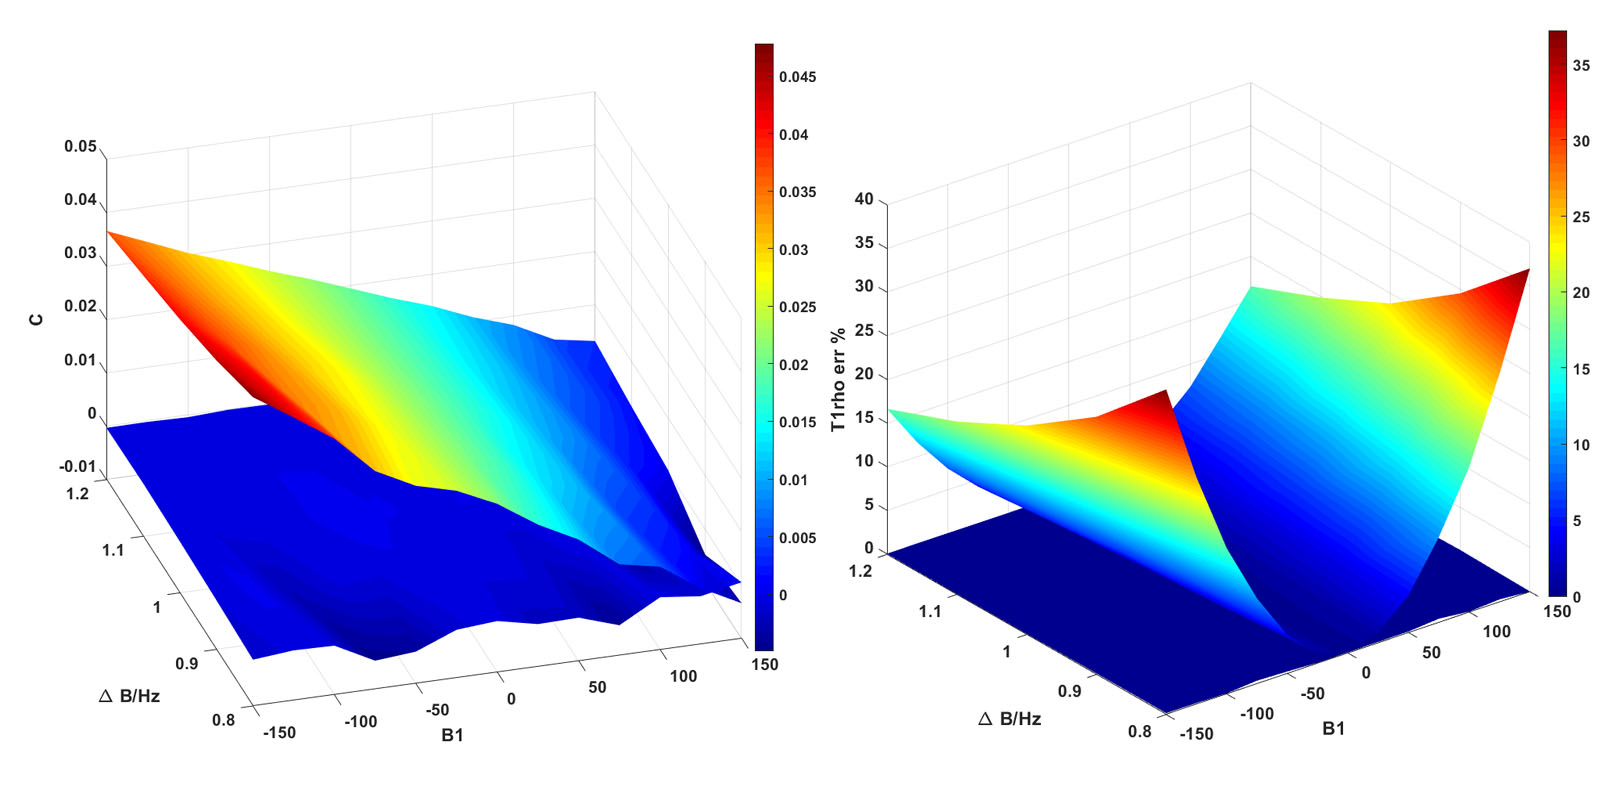
Figure 2. Left displays the maps of the DC term from ACCSL acquisition and the AC-iTIP. Right shows the error percentage of T1rho maps before and after correction.
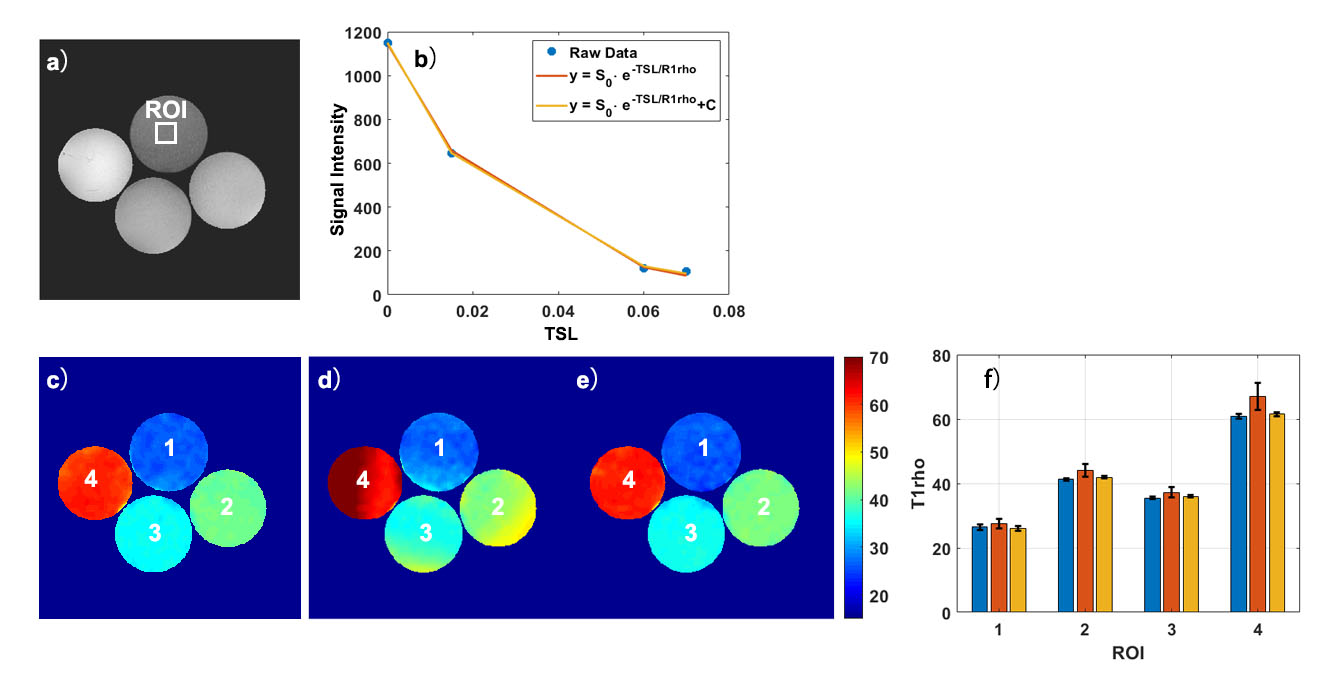
Figure 3. a) A raw image acquired using AC-iTIP at TSL 0
ms. b) The fitting results from the selected ROI in a). c) The ground-truth T1rho
map acquired. d) and e) show the T1rho map before and after correction,
respectively. f) compares the T1rho values in c)-e). Blue, red and yellows bars
represent c), d) and e), respectively.
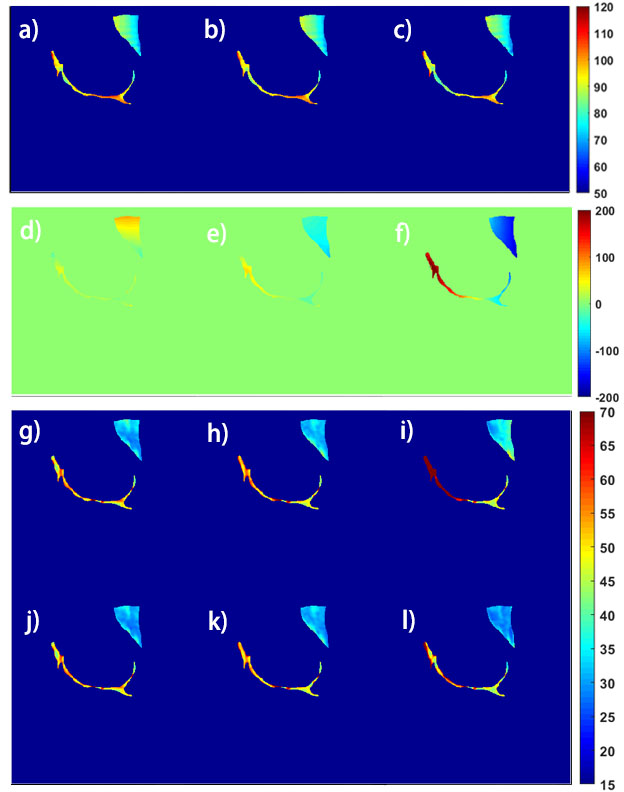
Figure 4. a)-c) and d)-e) show B1 and B0 field maps from three different scans. g)-i) and j)-l) show the T1rho maps in vivo before and after correction. The cartilage and muscle are manually drawn for analysis.