1470
An ASL and CrCEST combined protocol at 3T in the Study of Metabolic and Perfusion Changes Post Revascularization in Peripheral Arterial Disease1Biomedical Engineering, University of Virginia, Charlottesville, VA, United States, 2Cardiovascular Medicine, University of Virginia, Charlottesville, VA, United States, 3Radiology and Medical Imaging, University of Virginia, Charlottesville, VA, United States
Synopsis
Patients with peripheral arterial disease (PAD) have been shown to have a delayed phosphocreatine recovery due to chronic ischemia. Creatine chemical exchange saturation transfer (CrCEST) is an MRI technique that allows for creatine concentrations to be monitored at high spatial resolution. Combining ASL and CrCEST in the same protocol allows for spatial visualization of metabolism and perfusion. The goal of this study is to use this combination to assess changes after revascularization in patients undergoing both endovascular and surgical procedures and evaluate the recovery of both perfusion and metabolism in their muscle tissue.
Introduction
Creatine chemical exchange saturation transfer (CrCEST) is an MRI technique that utilizes radiofrequency pulses to magnetically label protons that are exchanged between creatine and water, allowing for creatine concentrations to be monitored at high spatial resolution. During recovery from exercise, the creatine concentration decays as it is converted to phosphocreatine in the mitochondria of the skeletal muscle. Patients with peripheral arterial disease (PAD) have been shown to have a delayed phosphocreatine recovery, which suggests impaired skeletal muscle metabolism due to chronic ischemia. Arterial spin labeling (ASL) uses tagged inverted arterial blood as endogenous contrast to visualize and quantify perfusion into tissue. Peripheral arterial stenoses and microvascular disease in PAD lead to decreased tissue perfusion. Combining ASL and CrCEST in the same protocol allows for spatial visualization of metabolism and perfusion. The goal of this study is to use this combination to assess changes after revascularization in patients undergoing both endovascular and surgical procedures and evaluate the recovery of both perfusion and metabolism in their muscle tissue. This study will provide a novel comparison of perfusion and metabolism on a muscle wise basis, while also comparing these metrics to patient function through six minute walk-score evaluation.Methods
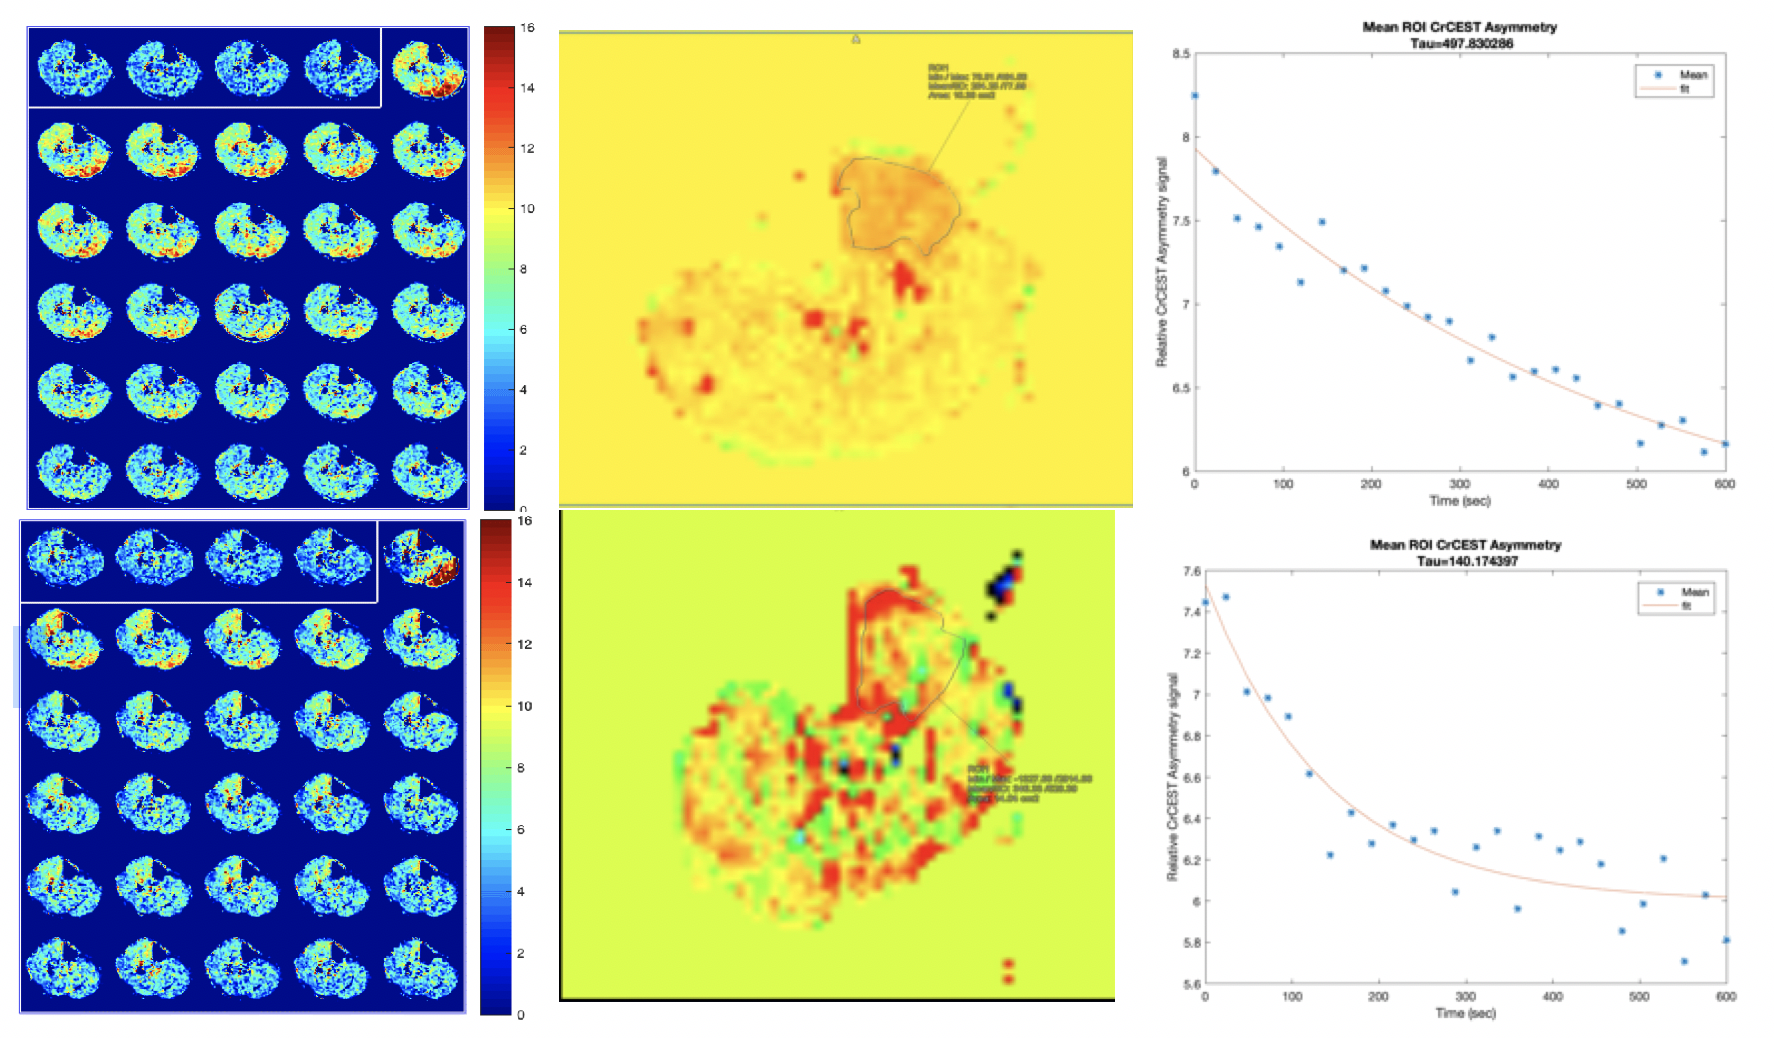
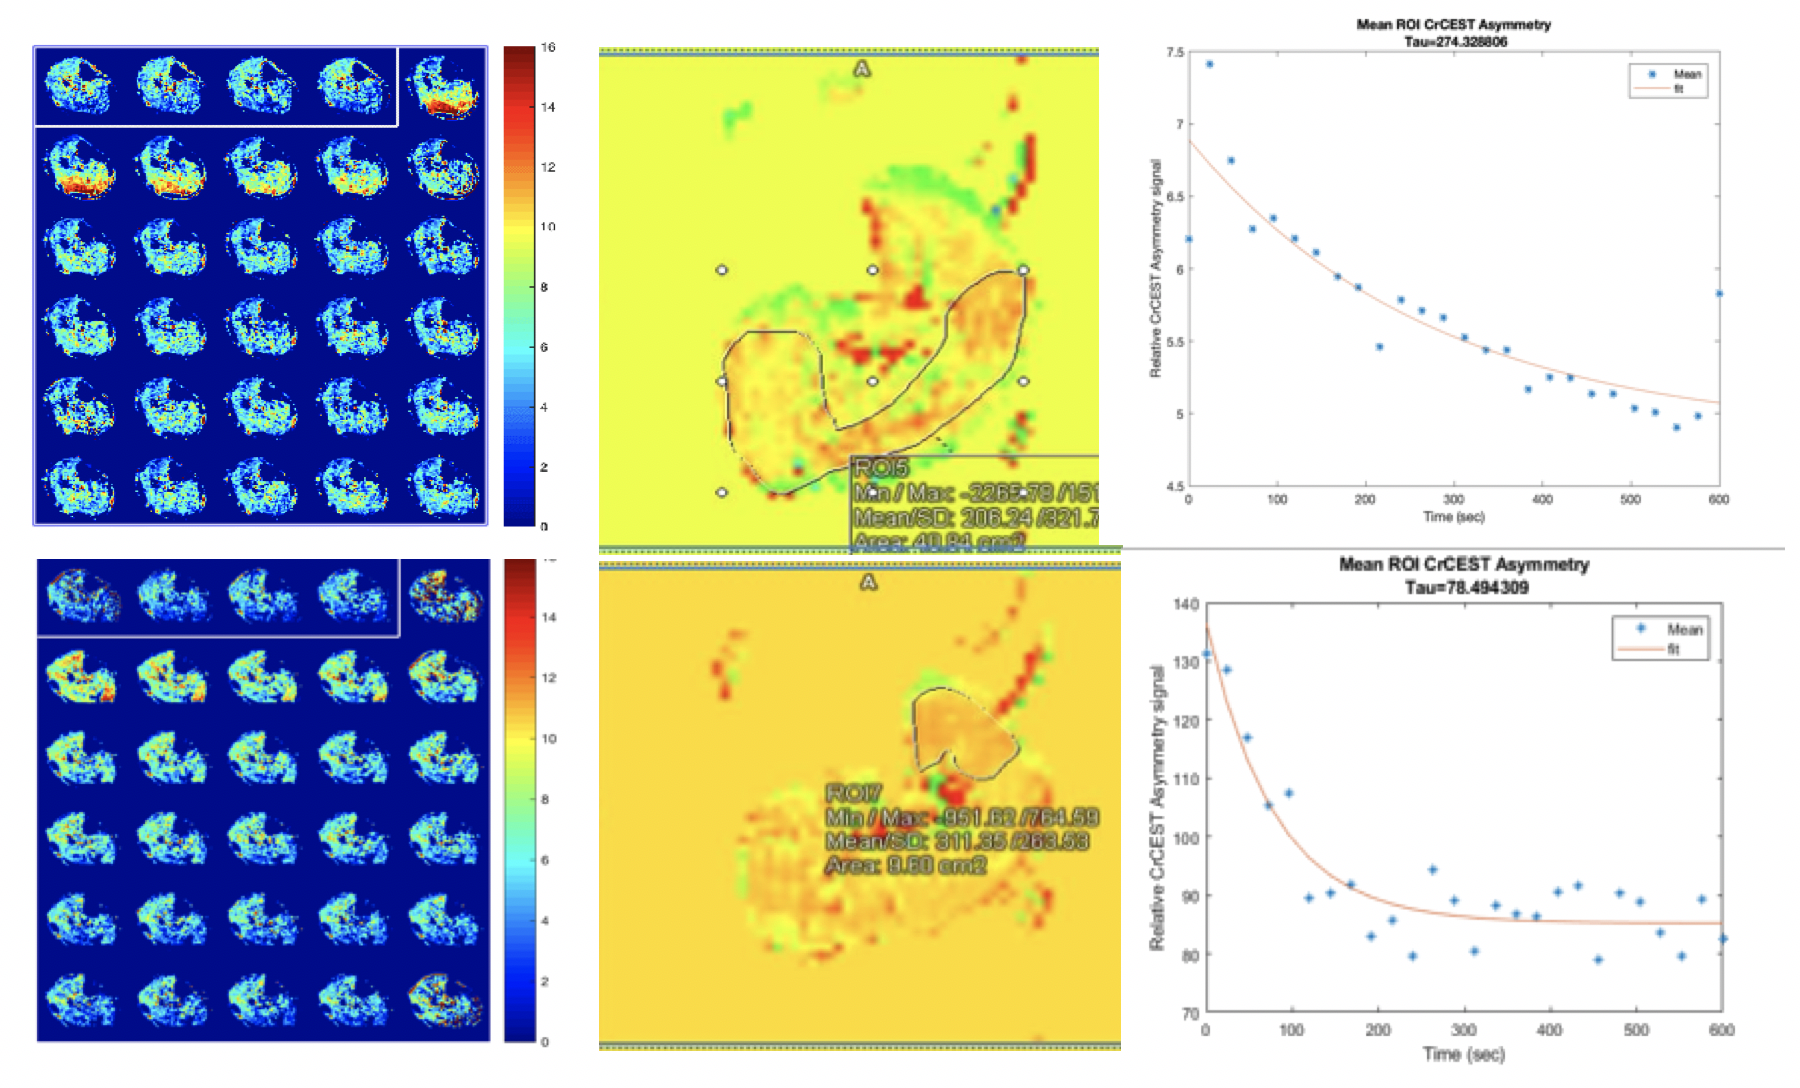
Six subjects with known PAD (defined as symptoms of claudication with confirmed ankle-brachial index<0.9) scheduled for revascularization were enrolled. All underwent an MRI on a 3T PRISMA Siemens scanner using a transmit-receive knee coil. All subjects underwent baseline imaging in which water saturation with shift reference (WASSR) and B1 maps were collected for B0 and B1 correction. Six images were then acquired over 24 second intervals with saturation frequency offsets of ±1.3, ±1.8, and ±2.3 ppm. The CEST effect reduces the signal at +1.8 ppm compared to -1.8 ppm, referred to as CrCESTasym. Imaging parameters included FOV 160x160 mm and matrix 128x128. Baseline pre-exercise images were obtained, following which the subject performed plantarflexion ergometry on an MR-compatible ergometer (Ergospect, NL) until calf exhaustion at which point post-exercise images were obtained. CrCESTasym maps were obtained with a region of interest (ROI) drawn around the anterior tibialis, posterior tibialis, and gastrocnemius muscles. Creatine decay times were obtained by fitting an exponential curve to the CrCESTasym values. For the ASL imaging, control-tagged image pairs were acquired repetitively using a PASL pulse sequence with single-shot echo-planar imaging readouts (field of view 200x200 mm, matrix 64x64, repetition time 4000 ms, echo time 32 ms, four 8-mm slices). The tag was applied 35 mm proximal to the first imaging slice for 1200 ms, followed by a 1500 ms post-label delay.[1] The delay is needed to ensure that the entire bolus reaches the distal slice before imaging, thus avoiding potential underestimation of blood flow.[2] Motion correction was performed between temporal frames and relative blood flow maps using a simplified single compartment ASL model. ROI are drawn around the muscle group demonstrating the highest perfusion and compared to the corresponding muscle group in the CEST analysis.Results
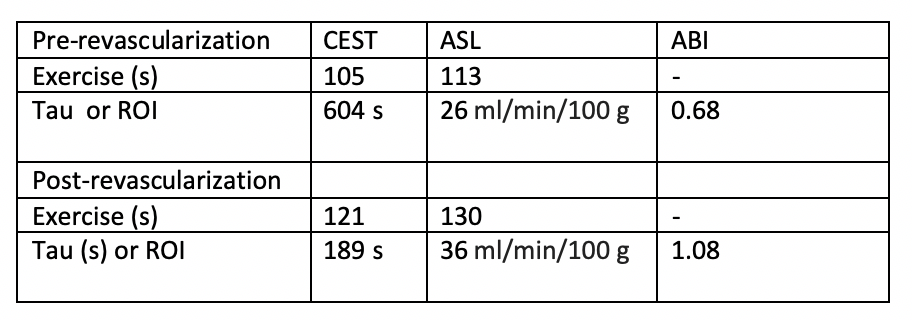
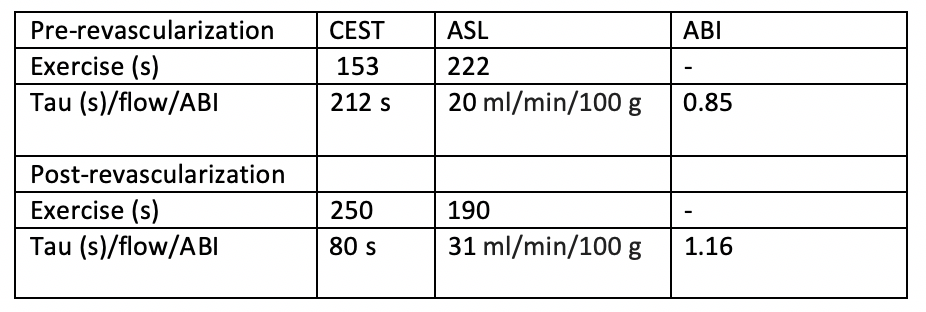
Six PAD patients were imaged before revascularization. Due to COVID-19 pandemic precautions, only two patients have been able to return 6 months after revascularization, and results of these patients are shown in Figures 1 and 2, and Table 1 and 2. The two patients so far have successfully completed post-procedure imaging, and show an increase in perfusion and a decrease in creatine decay time compared to pre-procedure imaging.Discussion
This combination of ASL and CrCEST will provide a novel methodology to compare metabolism and perfusion on a muscle-group specific basis. The purpose of this study is not to necessarily compare the efficacy of endovascular versus surgical revascularization, as the patient population referred to each group may differ in terms of severity of symptoms. This will serve as a study of the utility of CrCEST and ASL in correlating imaging to functional outcomes. This study will be the first to investigate the relationship between metabolism and perfusion on a muscle-by-muscle basis, It will lead to a better understanding of PAD and could lead to improved treatment planning for PAD patients.Conclusion
CrCEST can be utilized to distinguish creatine kinetics in PAD. ASL is an innovative approach to quantify perfusion in PAD patients. Together, they can map perfusion and metabolism in individual muscle groups in PAD and localize response to standard and innovative therapies. In this study, we demonstrated the feasibility of this approach in patients. Further studies pre- and post-revascularization in PAD are ongoing.Acknowledgements
We'd like to thank Jennifer Kay for recruiting and organizing our patientsReferences
(1) Pollak AW, Meyer CH, Epstein FH et al. Arterial Spin Labeling MR Imaging Reproducibly Measures Peak-Exercise Calf Muscle Perfusion: A Study in Patients With Peripheral Arterial Disease and Healthy Volunteers. JACC: Cardiovascular Imaging 2012 December;5(12):1224-30.
(2) Grozinger G, Pohmann R, Schick F et al. Perfusion measurements of the calf in patients with peripheral arterial occlusive disease before and after percutaneous transluminal angioplasty using Mr arterial spin labeling. J Magn Reson Imaging 2014 October 1;40(4):980-7.
Figures