1469
Investigating MT and CEST Characteristics of DU145 Prostate Tumour Xenografts in Relation to Radiation Treatment Response
Leedan Murray1, Wilfred W. Lam1, and Greg J. Stanisz1,2
1Physical Sciences, Sunnybrook Research Institute, Toronto, ON, Canada, 2University of Toronto, Toronto, ON, Canada
1Physical Sciences, Sunnybrook Research Institute, Toronto, ON, Canada, 2University of Toronto, Toronto, ON, Canada
Synopsis
MT and CEST characteristics of DU145 prostate tumour xenografts with known responses to radiation treatment were investigated to determine characteristics that may predict treatment response. After excision for histology, tumours were categorized according to their response to treatment (responder, partial responder and non-responder). Average MTR, qMT parameters, and CEST and rNOE contributions were calculated for each category. Significant changes were mostly observed in the necrotic/apoptotic regions of the tumour and were most evident in the qMT parameters. It may be possible to determine efficacy early on in the course of treatment based on the studied MR characteristics.
Introduction
Prostate cancer is the most common non-skin cancer in men and can reappear in almost a third of high-risk patients after radiation treatment1.Magnetization transfer (MT)-prepared pulse sequences are sensitive to magnetization exchange between semisolid macromolecules and water, such as the changes in membrane structure that occur in lipid bilayers during apoptosis2. The magnitude of this effect can be quantified with the magnetization transfer ratio (MTR)3. Chemical exchange saturation transfer (CEST) and relayed nuclear Overhauser effect (rNOE) are contrast mechanisms that are also measured using MT sequences. These mechanisms can be used as a non-invasive tool to detect tumour metabolism4.
This study investigated the MT and CEST characteristics of active and necrotic/apoptotic regions of prostate tumour xenografts in relation to their known response to radiation treatment, with the goal of determining the characteristics that may predict treatment response. This could lead to the creation of a novel, non-invasive way to evaluate a tumour's response to radiation, and in turn, treatment efficacy.
Methods
Approximately 3 x 10⁶ cells of DU145 human prostate adenocarcinoma were injected into the hind limbs of female athymic nude mice (n = 15). To simulate a standard human dose of radiation treatment, tumours were treated with a single dose of radiation at 6.3 Gy for 3.5 minutes after 4-6 weeks of growth.MRI was performed at 7T (BioSpec 70/30 USR) 0-3 days pre-treatment and 8-20 days post-treatment. T2-weighted structural images, T1 and T2 maps, and saturation transfer images with B1 = 0.5, 2, 3 and 6 μT were acquired.
After the final MRI, tumours were excised and the imaged slices were stained for structure (H+E) and necrosis/apoptosis (TUNEL).
Images were automatically segmented into 5 regions (active tumour, necrosis/apoptosis, muscle/connective tissue, muscle and blood/edema) according to methods developed by our group5. MT and CEST spectra of regions deemed to be either active tumour or necrosis/apoptosis were fitted to a two-pool quantitative MT model6.
Results
Tumours were differentiated into three categories (responder, partial responder and non-responder) according to their response to the radiation treatment (Figure 1).In the “responders” (n = 3), the segmentation showed an increase in relative areas of necrosis/apoptosis after treatment (Figure 2b), and the TUNEL images showed staining on the majority of the section. This indicated that the tumour was mostly necrotic.
“Partial responders” (n = 8) also had an increase in relative necrosis/apoptosis post-treatment in the segmentation and had large areas of TUNEL staining in the histology, but still showed areas of active tumour in both segmentation and histology.
“Non-responders” (n = 4) were those with a decrease in necrosis/apoptosis post-treatment, and did not show significant areas of TUNEL staining in the histology images.
MTR at 48 ppm and quantitative MT (qMT) parameters were averaged for each category of response (Figures 3-4). CEST and rNOE contributions (Figure 5) were calculated using a modification of the apparent exchange-dependent relaxation (AREX) formula7.
Discussion
Although it was unlikely to see the overall volume of the tumour decrease within the time frame of this experiment, possible early markers of treatment efficacy were observed in MTR, qMT parameters and CEST contributions of the studied tumours, mostly within the necrotic regions.The average MTR with B1 = 6 μT for the responding tumours prior to treatment was significantly less than for the non-responding tumours in both active (p < 0.05) and necrotic/apoptotic (p < 0.001) regions (Figure 3b, d). However, the only difference observed between pre- and post-treatment time points within a group was the decrease in the necrosis/apoptosis of the partial responders at 6 μT (Figure 3d). This may be driven by the decrease in RMTM0,MT for necrosis/apoptosis (p < 0.05) in the partial responders (Figure 4g). No significant changes were observed within groups in the active regions.
A similar phenomenon can be seen in Figure 4, where significant changes were also mostly observed in the necrotic/apoptotic regions of the tumour (Figure 4e-h). After treatment, both T1,L and T2,L for necrosis/apoptosis in the non-responders were significantly less than those for responders (p < 0.05) and partial responders (p < 0.01), yet no differences were seen between groups prior to treatment. This shows that T1,L and T2,L in necrotic/apoptotic regions of the tumour may be a good indication of how the tumour is responding to radiation treatment.
At -3.3 ppm, the CEST and rNOE contributions of active regions in partial responders prior to treatment were significantly less than those in responders and non-responders (p<0.05, Figure 5c). Contributions in the necrosis/apoptosis of partial responders decreased post-treatment at 3.5 ppm, and decreased for responders at -3.3 ppm (p < 0.05; Figure 5d, f). However, these contributions did not significantly change for non-responders over the course of treatment since metabolism slows as more cells in responding tumours become necrotic after radiation therapy.
Conclusion
The CEST and MT characteristics of prostate tumour xenografts with known responses to radiation therapy may help to identify characteristics that can indicate a tumour’s response to treatment in a non-invasive way. The differences in these characteristics, particularly in the necrosis/apoptosis, show that it may be possible to determine efficacy early on in the course of treatment.Acknowledgements
The authors thank the Canadian Institutes of Health Research (grant number PJT148660) and Terry Fox Research Institute (grant number 1083) for funding.References
- Viani GA, Stefano EJ, Alfonso SL. Higher-than-conventional radiation doses in localized prostate cancer treatment: a meta-analysis of randomized, controlled trials. Int J Radiat Oncol Biol Phys 2009;74(5):1405-1418.
- Wolff SD, Balaban RS. Magnetization transfer contrast (MTC) and tissue water proton relaxation in vivo. Magn Reson Med 1989;10(1):135-144.
- Grossman RI, Gomori JM, Ramer KN, et al. Magnetization transfer: theory and clinical applications in neuroradiology. RadioGraphics 1994;14:279-290.
- Goldenberg JM, Pagel MD. Assessments of tumour metabolism with CEST MRI. NMR Biomed 2019;32(10):3943.
- Lam WW, Oakden W, Karami E, et al. An Automated Segmentation Pipeline for Intratumoural Regions in Animal Xenografts Using Machine Learning and Saturation Transfer MRI. SciRep 2020;10:8063.
- Lam WW, Oakden W, Murray L, et al. Differentiation of Normal and Radioresistant Prostate Cancer Xenografts Using Magnetization Transfer-Prepared MRI. SciRep 2018;8:10447.
- Windschuh J, Zaiss M, Meissner J-E, et al. Correction of B1-inhomogeneities for relaxation-compensated CEST imaging at 7 T. NMR Biomed 2015;28(5):529-537.
Figures
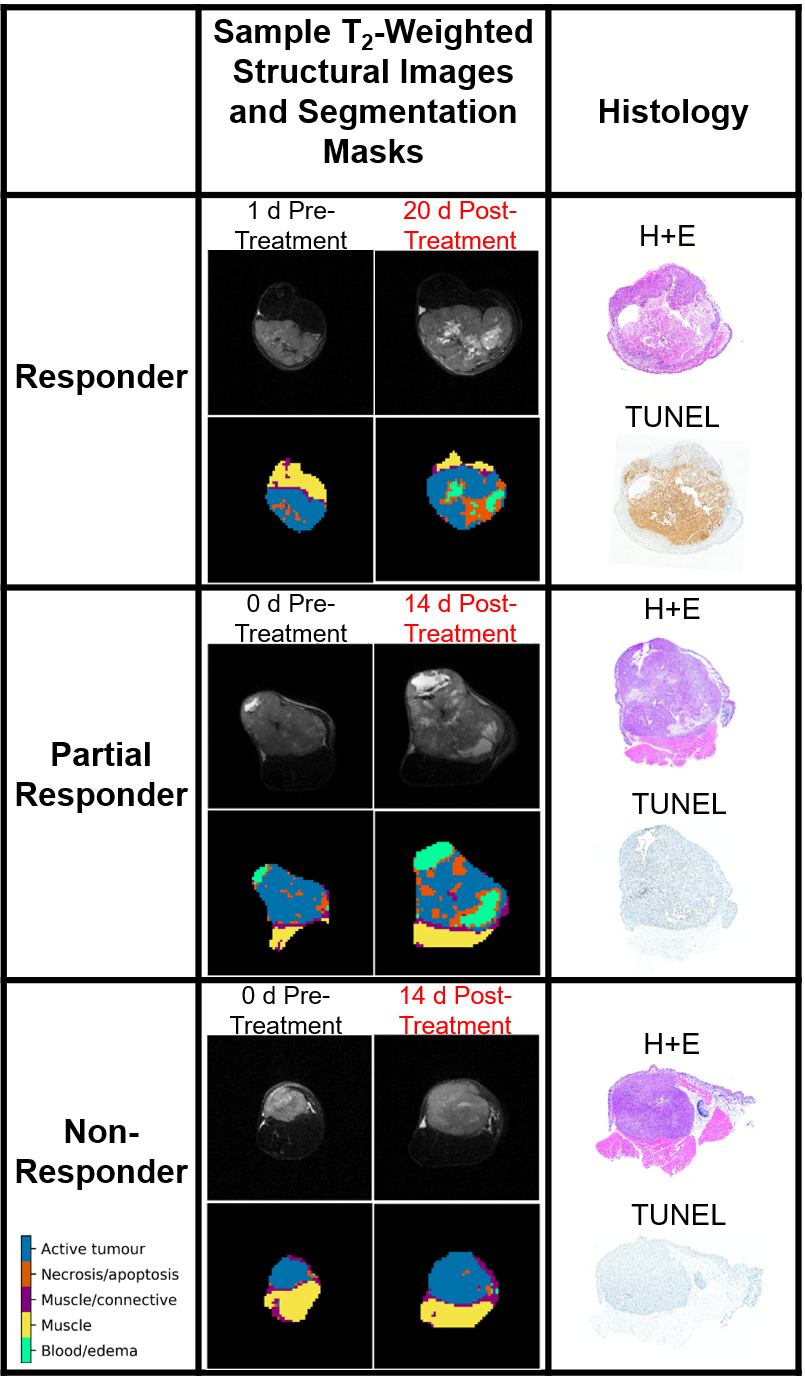
Figure 1: Representative
segmentation masks, T2-weighted images and histology (H+E and TUNEL
stains) for each category of response to radiation treatment (responder, partial
responder, non-responder).
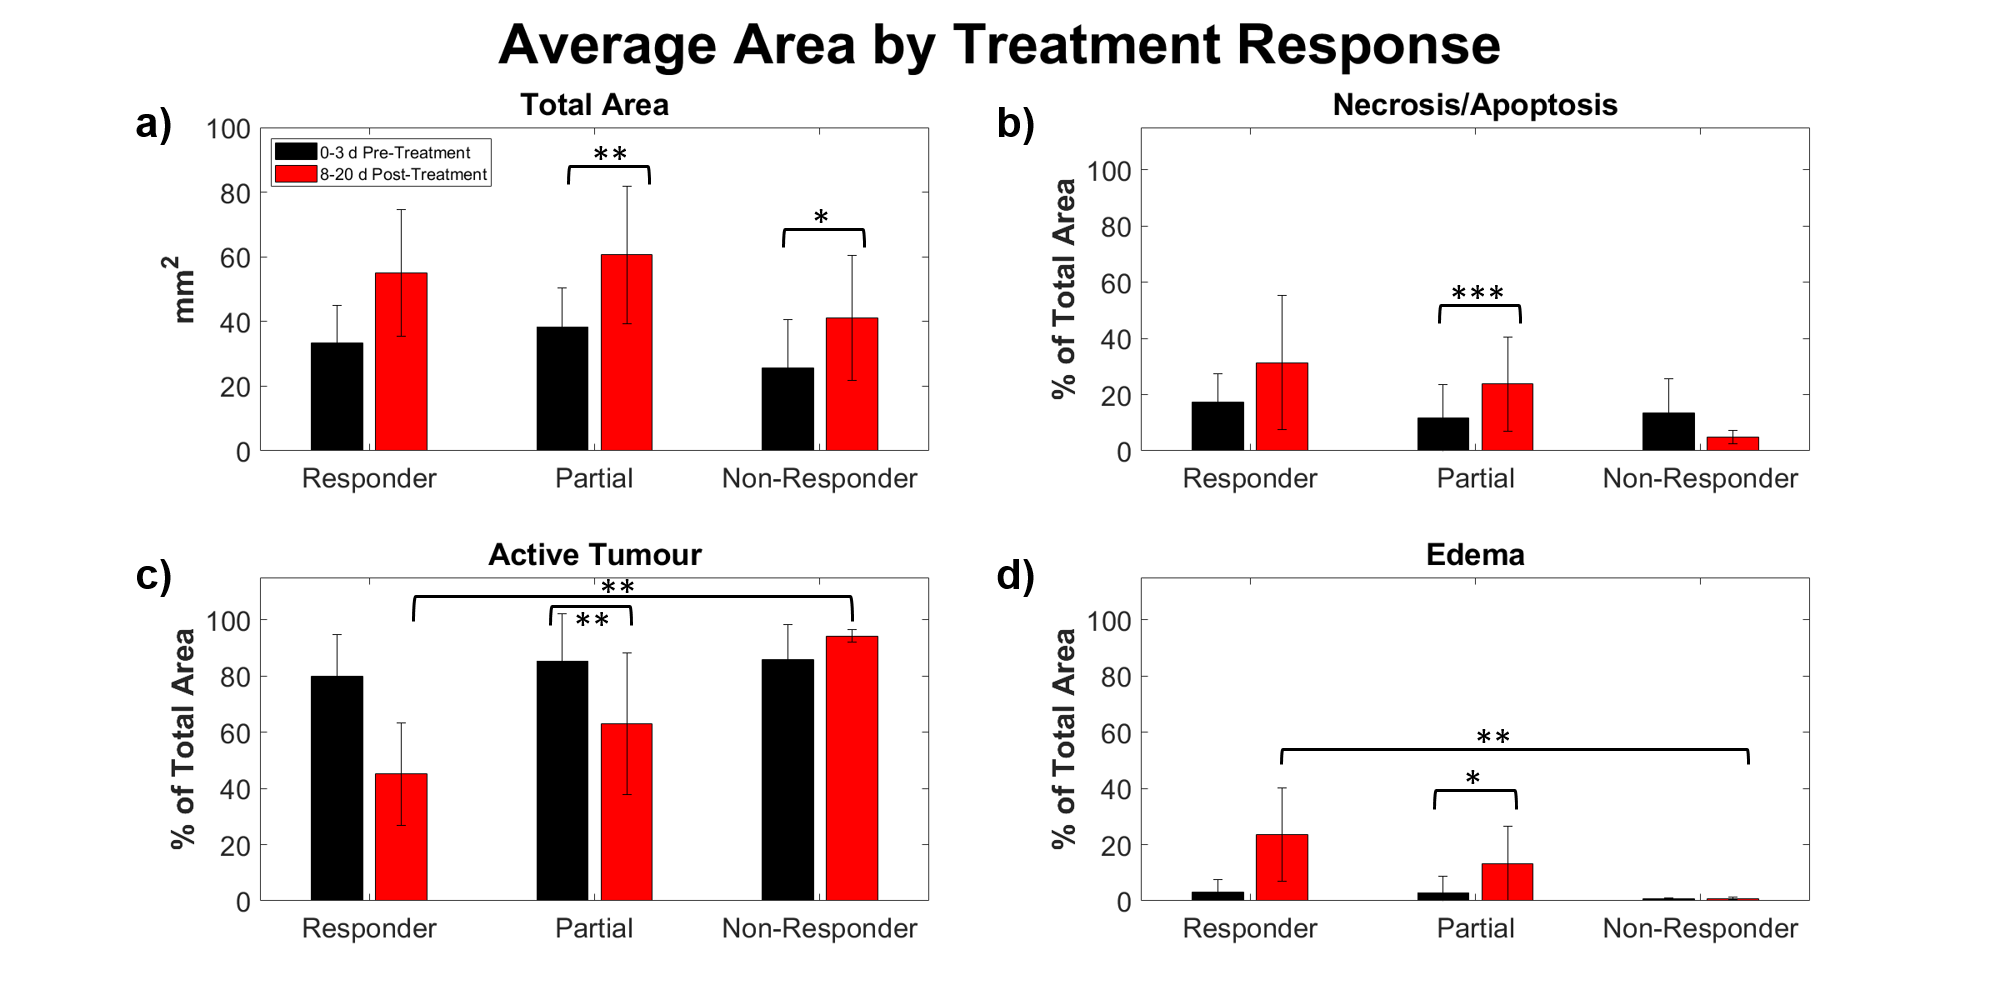
Figure 2: Average (a) total area, and relative areas of (b) Necrosis/apoptosis, (c) Active tumour and (d) edema of studied tumour slices as
determined by number of voxels in the corresponding segmentation masks. *p <
0.05. **p < 0.01. ***p < 0.001.
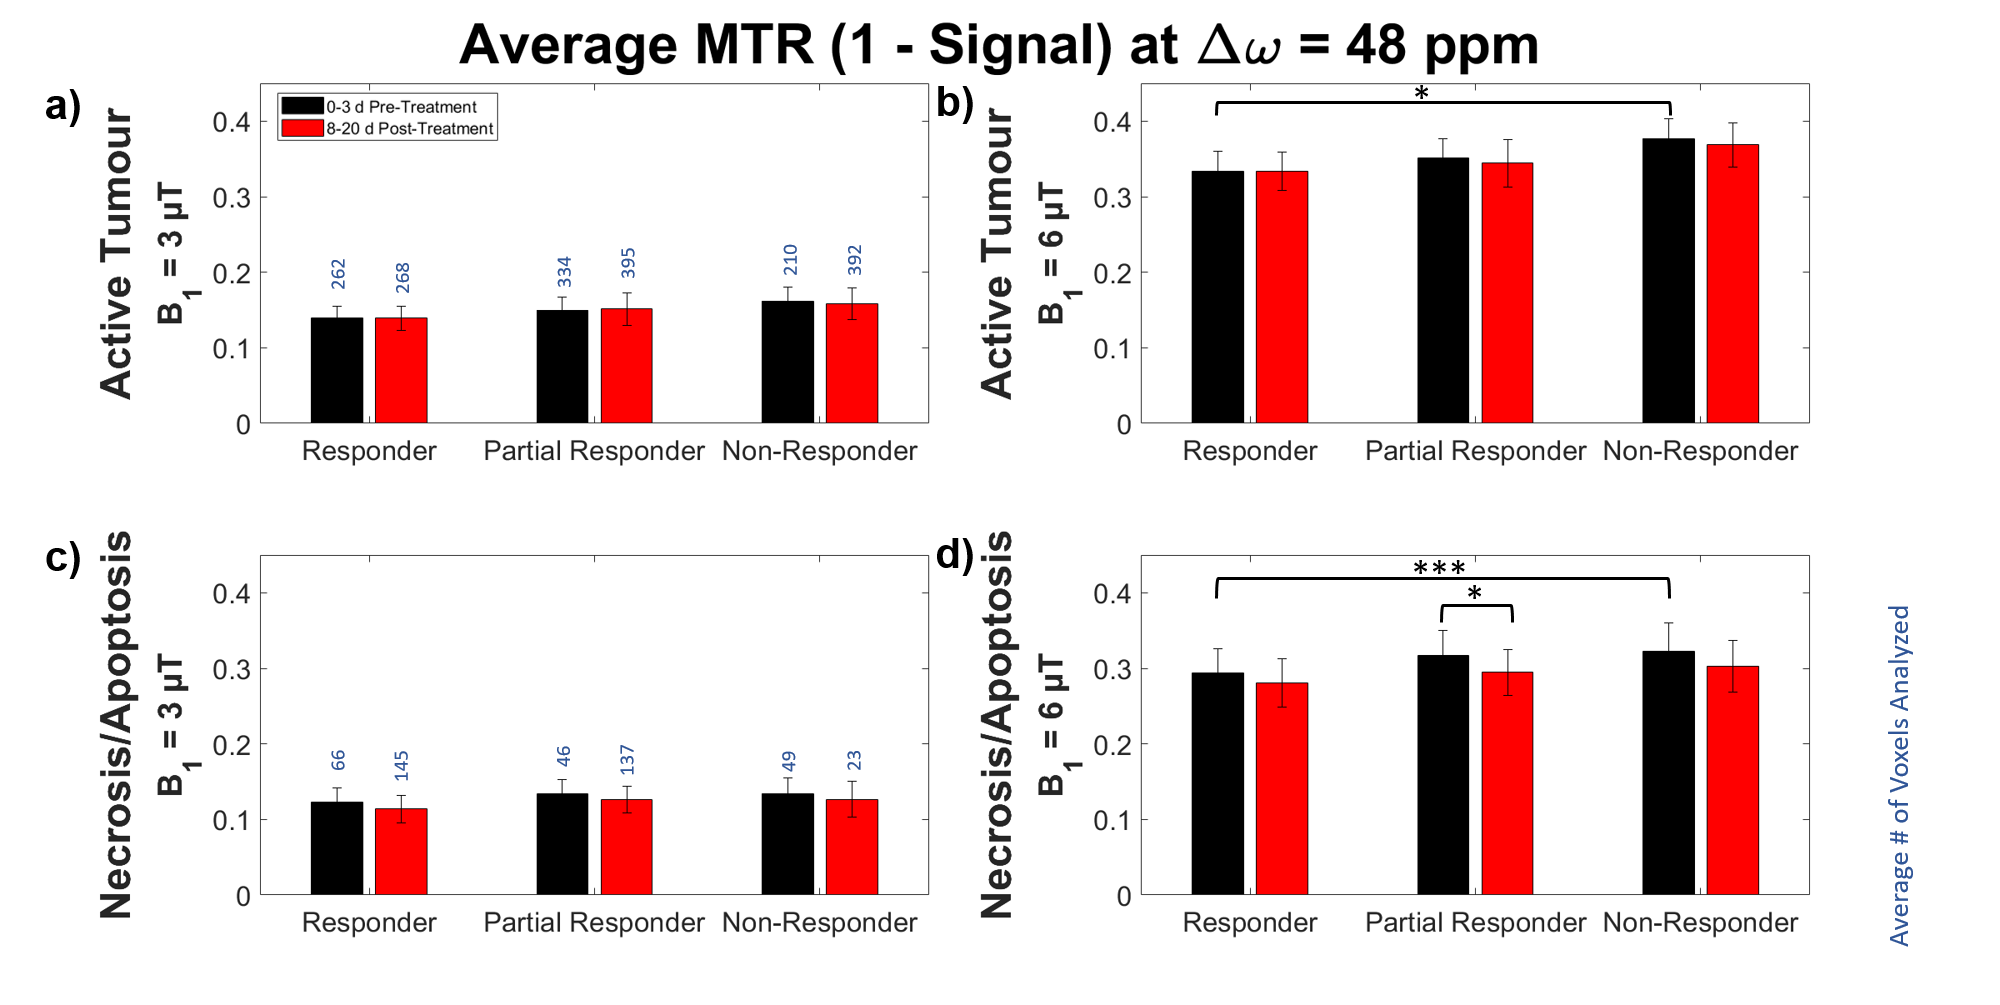
Figure 3: Average MTR by
treatment response at ∆ω = 48 ppm of (a, b)
active and (c, d) necrotic/apoptotic
regions with B1 = 3 and 6 μT. *p < 0.05. ***p < 0.001.
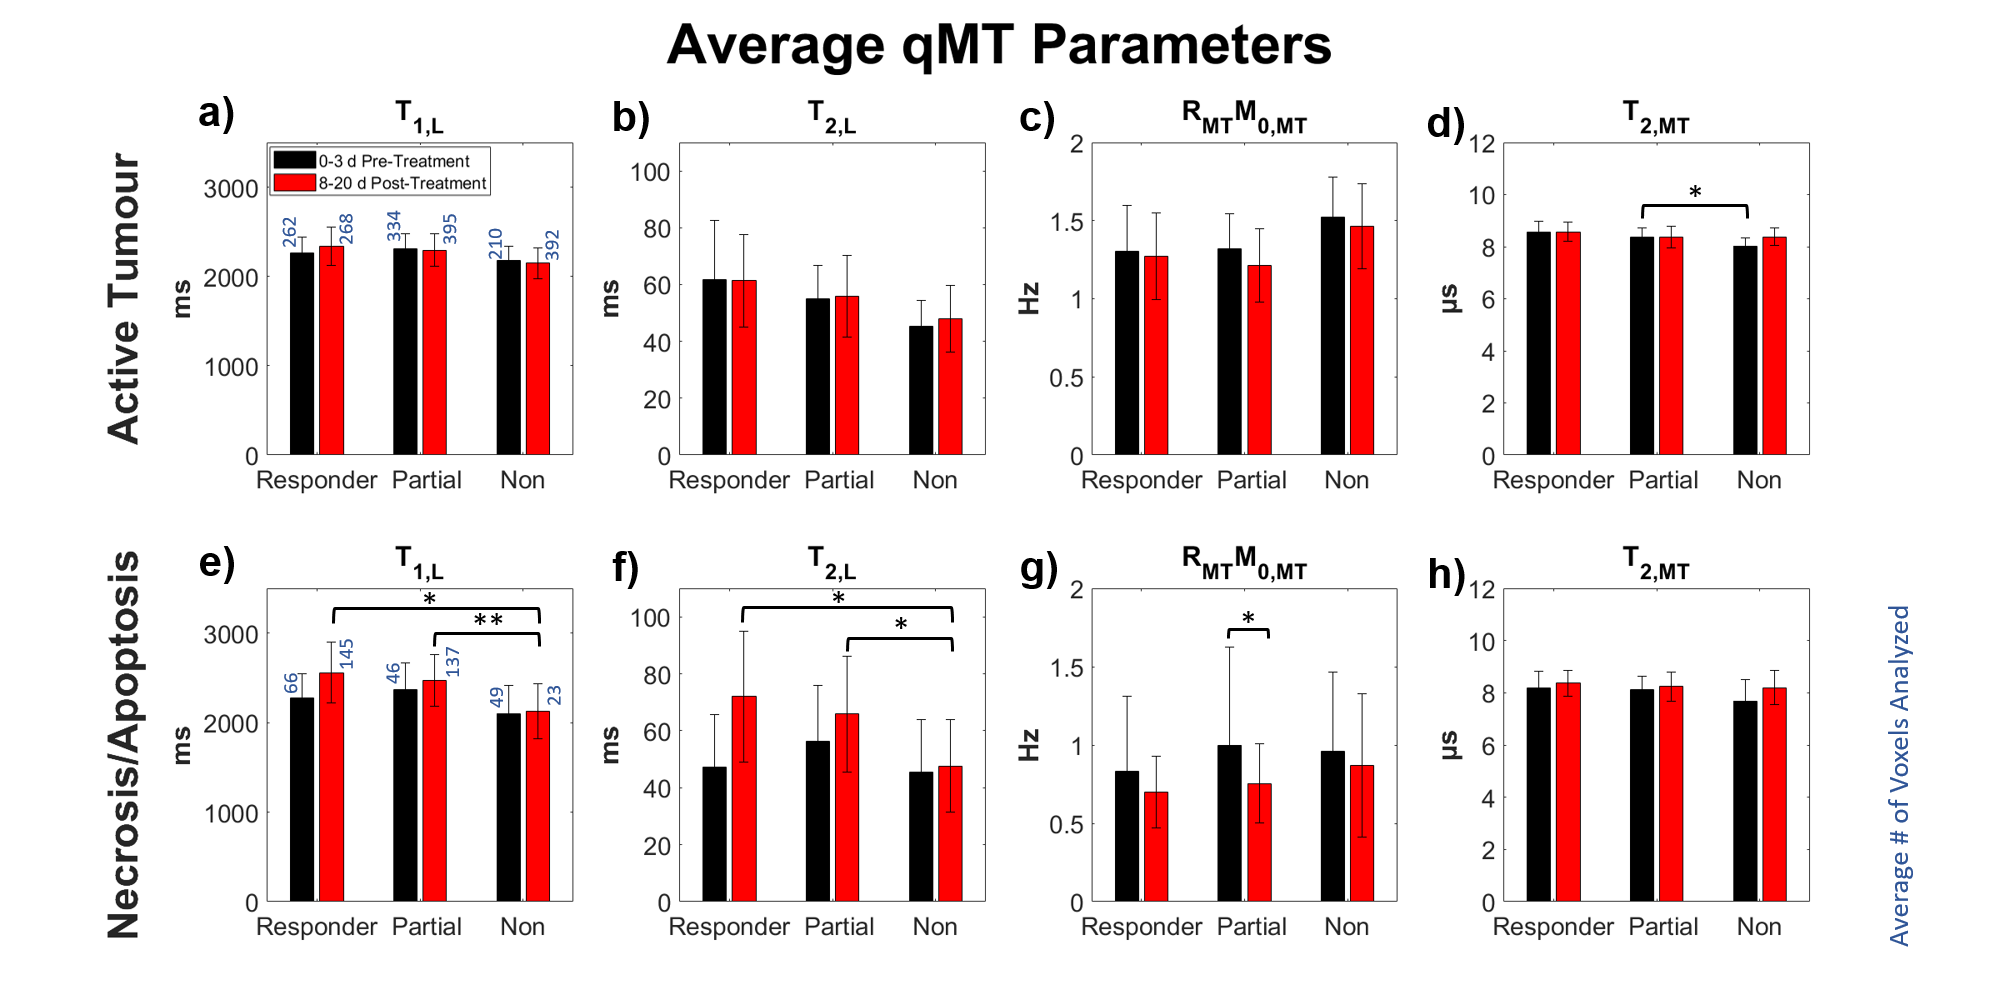
Figure 4: Average
estimated qMT parameters by treatment response of (a-d) active and (e-h)
necrotic/apoptotic regions. Free parameters were: T1 and T2
of the water pool (T1,L and T2,L respectively), the exchange rate of
magnetization from the MT pool to the water pool (RMT), original
magnetization of the MT pool relative to the water pool (M0,MT), and
T2 of the MT pool (T2,MT). *p < 0.05. **p < 0.01.
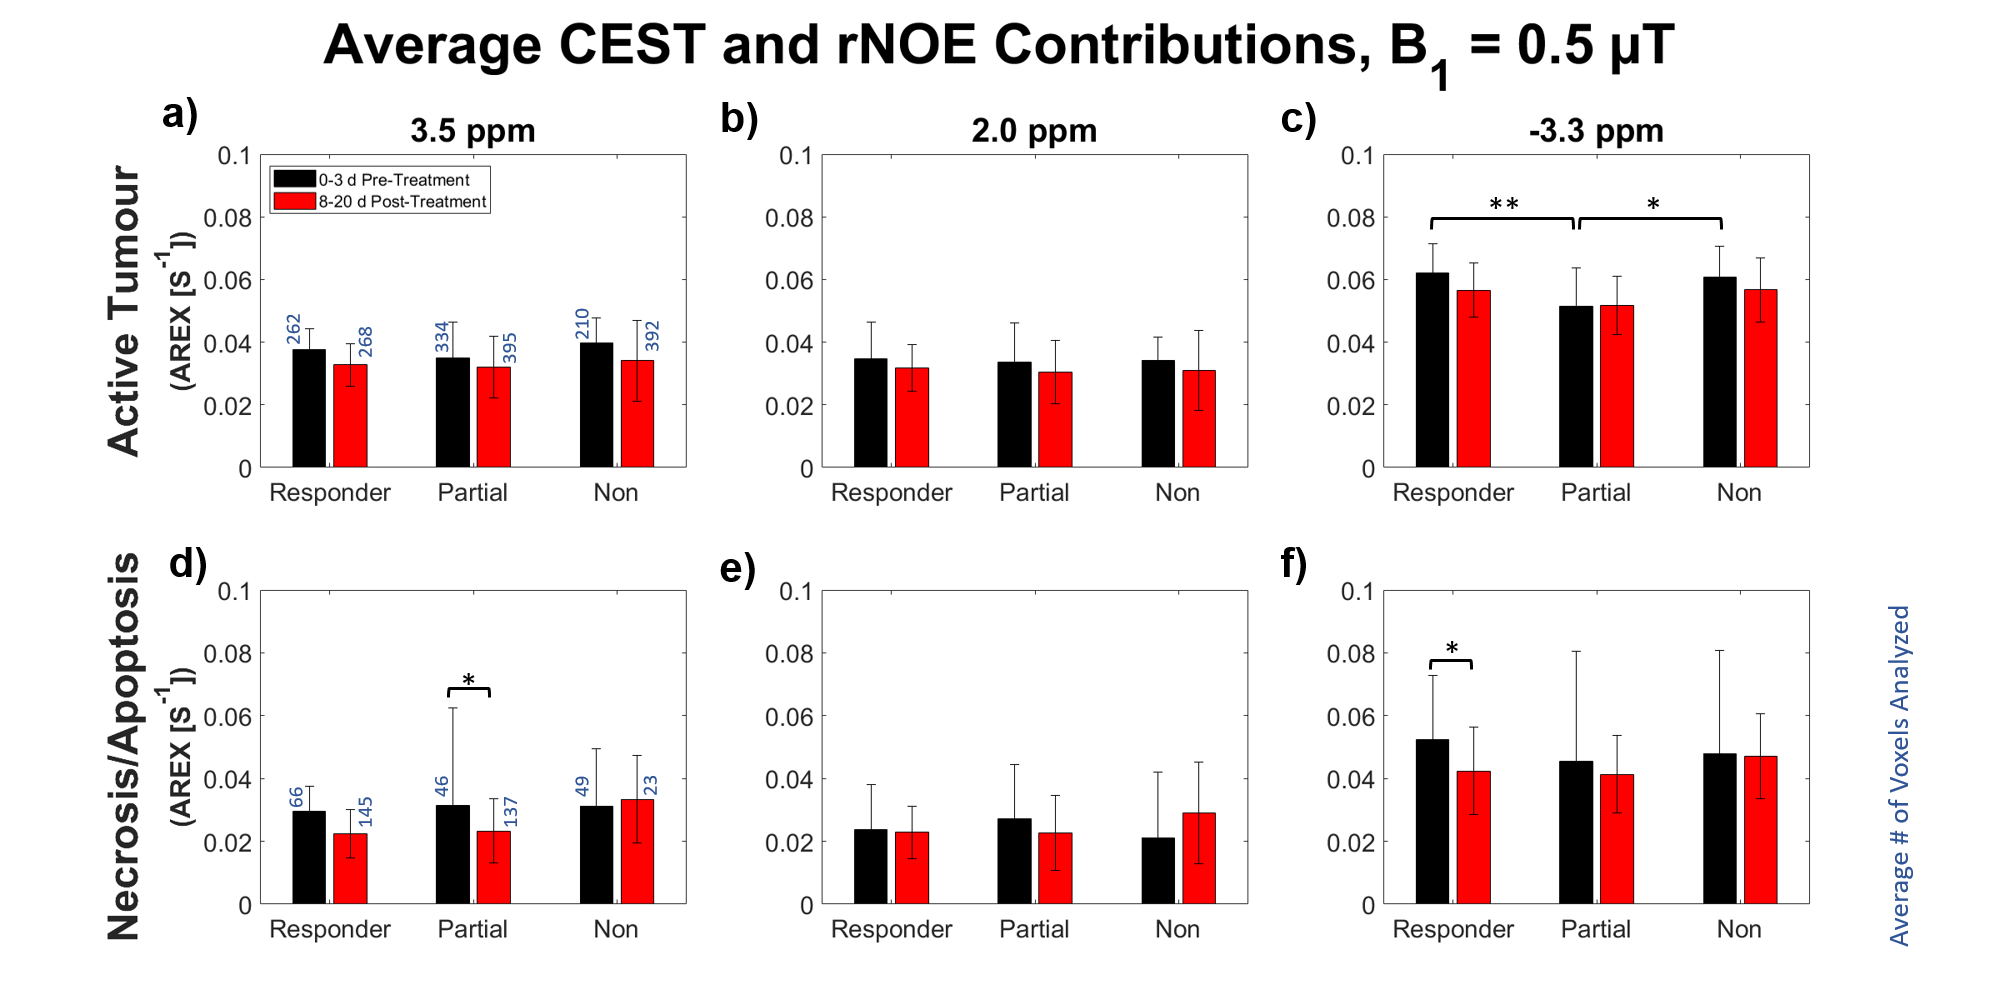
Figure 5: Average CEST
and rNOE contributions with B1 = 0.5 μT of treatment responses of (a-c) active and (d-f) necrotic/apoptotic regions at (a, d) 3.5 ppm, (b, e) 2.0
ppm and (c, f) -3.3 ppm. *p
< 0.05. **p < 0.01.